

Research on the detection effect of post-processing method of Acoustic Doppler Velocimetry data based on three-dimensional phase space thresholding method and robust estimation method
-
摘要: 水流是影响藤壶、牡蛎、藻类等水生生物能否成功附着在渔业装备上的重要环境因素,水体流速的变化会改变藻类新陈代谢过程,制约藤壶与牡蛎幼虫大面积扩散。流速测量数据的准确性对研究渔业装备上附着生物的附着机制起到至关重要的作用。声学多普勒流速仪(ADV)是测量水体流速的重要设备。然而,水体中的气泡、大颗粒悬浮物等因素会影响ADV的相关系数和信噪比,从而导致流速数据中产生野点,降低了数据的准确性。本文基于国内外主流算法稳健估算法与三维相空间法,以ADV实际测量的流速数据为例,对比研究两种后置处理方法的检测效果。结果显示,稳健估算法平均检出率为4.95%,峰度系数平均下降77.71%,三维相空间法平均检出率为14.60%,峰度系数平均下降84.05%。综合分析,三维相空间法处理效果较好,其检测准确性高于稳健估算法,但存在过处理现象。建议在处理野点含量低于5%的数据时选用相空间法,而对于野点偏离样本平均值较远的数据时,可以选用稳健估算法。本文对减小流速数据误差,为准确定量研究水流对渔业装备附着生物的附着量与种类影响有着重要的意义。Abstract: Water flow is an important environmental factor that affects whether barnacles, oysters, algae, and other aquatic organisms can successfully attach to fishing equipment. Changes in water velocity will change the metabolism of algae and restrict the spread of barnacles and oyster larvae. The accuracy of the flow velocity data plays a vital role in studying the attachment mechanism of organisms attached to fishery equipment. Acoustic Doppler Velocimetry (ADV) is an important device for measuring the flow velocity. However, factors such as bubbles and large suspended solids in the water will affect the correlation coefficient and signal-to-noise ratio of ADV, resulting in outliers in the flow velocity data and reducing the accuracy of the data. Based on the domestic and foreign mainstream algorithms—robust estimation method and the three-dimensional phase space thresholding method, actual measured flow velocity data of ADV are taken as an example to compare and study the detection effects of the two post-processing methods. The results showed that the average detection rate of the robust estimation method was 4.95%, the kurtosis coefficient decreased by 77.71%, the average detection rate of the three-dimensional phase space thresholding method was 14.60%, and the kurtosis coefficient decreased by 84.05%. Comprehensive analysis showed that the three-dimensional phase space thresholding method had a better processing effect, and its detection accuracy was higher than that of the robust estimation method, but there was a phenomenon of overprocessing. It was recommended that the three-dimensional phase space thresholding method be used when dealing with data with an outlier content of less than 5%, and for data whose outliers deviate from the sample average, the robust estimation method was recommended. This article is of great significance for reducing the error of flow velocity data and accurately and quantitatively studying the influence of water flow on the attachment amount and types of fishery equipment attached organisms. It also provides a scientific basis for the subsequent development of a post-processing algorithm with high detection accuracy and less overprocessing.
-
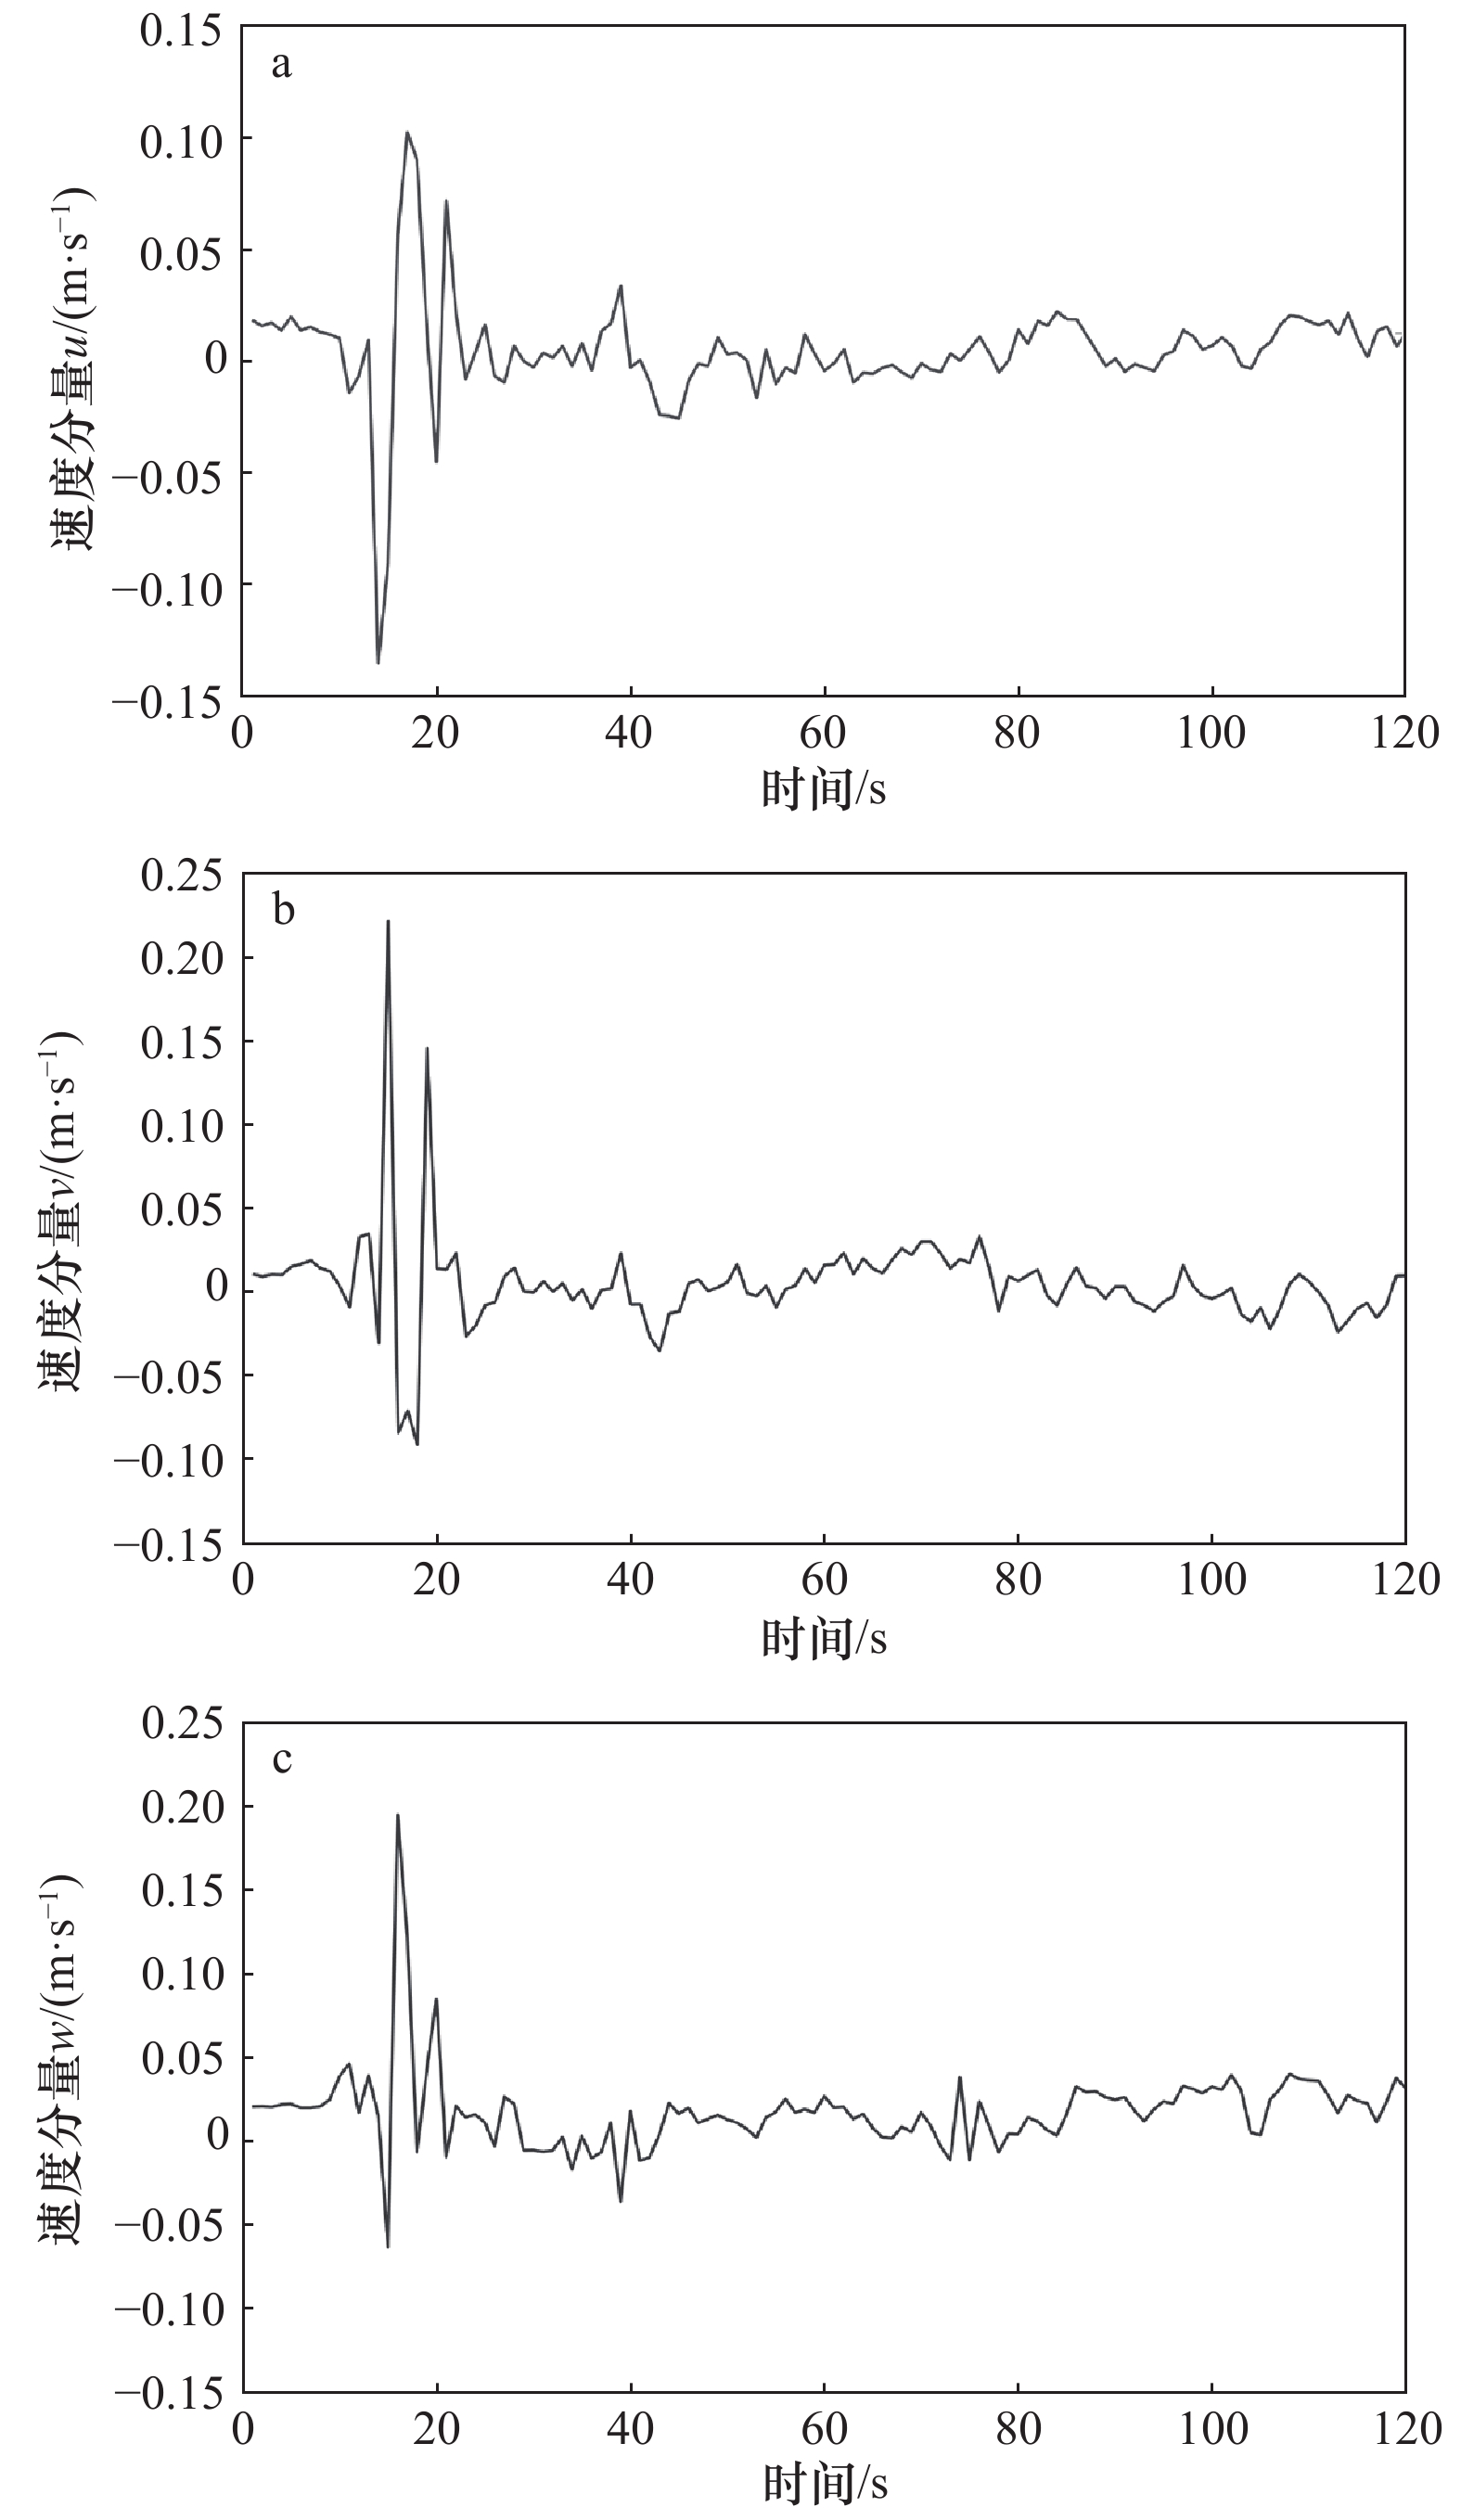
图 2 站点A水面下30 cm处流速数据
Fig. 2 Flow velocity data at 30 cm below the water surface at Station A

图 3 站点A水面下30 cm处稳健估算法检测结果
a. 速度分量u流速数据检测结果;b. 速度分量v流速数据检测结果;c. 速度分量w流速数据检测结果
Fig. 3 The detection results of the robust estimation method at 30 cm below the water surface of Station A
a. Velocity data detection result in u; b. velocity data detection result in v; c. velocity data detection result in w

图 4 站点A水面下30 cm处三维相空间法检测结果
a. 速度分量u流速数据检测结果;b. 速度分量v流速数据检测结果;c. 速度分量w流速数据检测结果
Fig. 4 The detection results of the three-dimensional phase space thresholding method at 30 cm below the water surface of Station A
a. Velocity data detection result in u; b. velocity data detection result in v; c. velocity data detection result in w
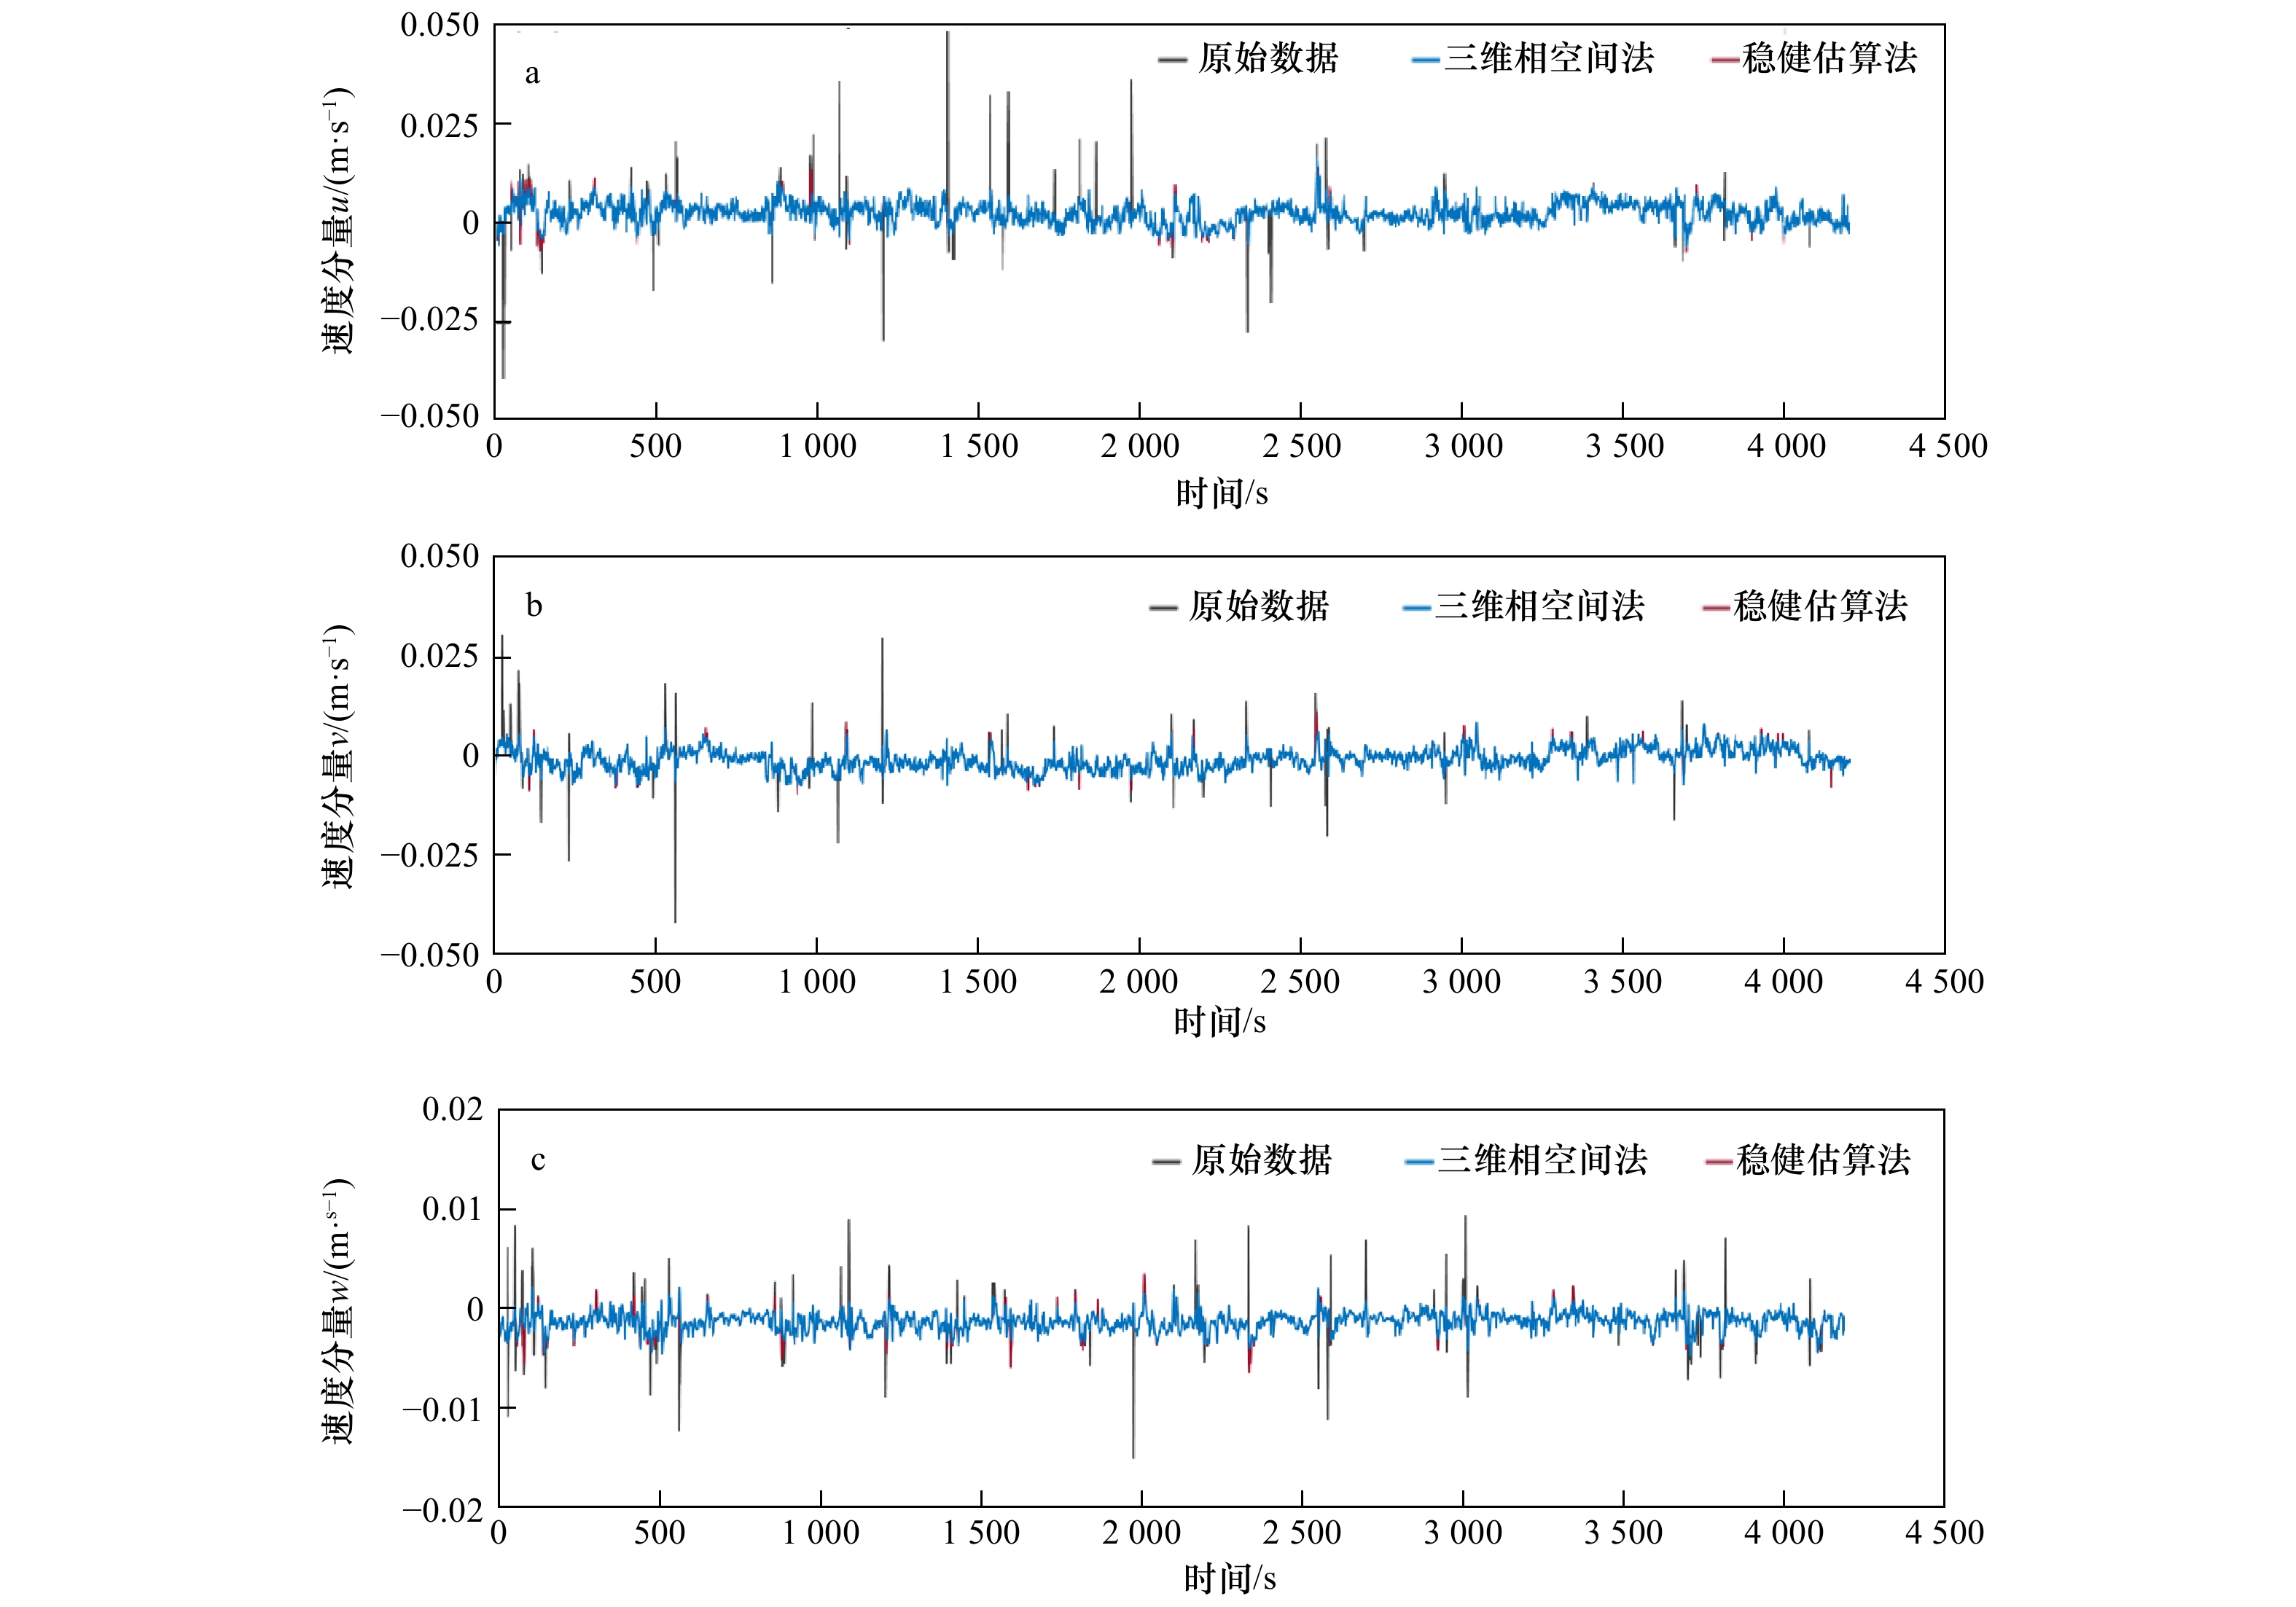
图 5 站点A离底20 cm处数据处理效果对比
a. 速度分量u流速数据检测结果;b. 速度分量v流速数据检测结果;c. 速度分量w流速数据检测结果
Fig. 5 Comparison of data processing effects at 20 cm above the bottom of Station A
a. Velocity data detection result in u; b. velocity data detection result in v; c. velocity data detection result in w
表 1 站点A水面下30 cm处流速数据统计参数值
Tab. 1 Statistical parameter values of flow velocity data at 30 cm below the surface of Station A
方法名称 速度分量 平均值/(m·s−1) 标准偏差 峰度系数 偏斜系数 最大值/(m·s−1) 最小值/(m·s−1) 实测数据 u −0.007 721 0.023 845 16.910 402 −1.113 332 0.089 9 −0.147 9 v −0.011 987 0.030 562 27.141 593 3.214 157 0.205 3 −0.107 6 w 0.001 576 0.025 555 23.118 644 3.021 304 0.178 3 −0.079 6 稳健估算法 u −0.007 051 0.011 142 3.255 587 −0.162 135 0.023 2 −0.038 3 v −0.014 798 0.017 709 7.712 472 −1.497 770 0.018 5 −0.092 8 w −0.001 415 0.015 846 4.440 737 −0.877 804 0.029 8 −0.059 1 三维相空间法 u −0.007 238 0.009 276 2.101 112 −0.011 201 0.009 6 −0.029 0 v −0.011 054 0.012 881 2.448 117 0.099 970 0.017 0 −0.040 3 w 0.003 131 0.017 945 6.105 687 1.342 966 0.068 2 −0.027 6  下载: 导出CSV
表 2 站点A离底20 cm处流速数据统计参数值
Tab. 2 Statistical parameter values of flow velocity data at 20 cm above the bottom of Station A
方法名称 速度分量 平均值/(m·s−1) 标准偏差 峰度系数 偏斜系数 最大值/(m·s−1) 最小值/(m·s−1) 实测数据 u 0.002 485 0.003 438 28.518 138 0.539 132 0.048 2 −0.039 2 v −0.000 983 0.003 137 18.550 231 0.103 749 0.030 2 −0.042 1 w −0.001 342 0.001 293 18.826 066 0.127 427 0.009 4 −0.015 1 稳健估算法 u 0.002 464 0.002 641 3.500 889 0.089 815 0.016 7 −0.006 3 v −0.001 015 0.002 607 2.824 961 0.155 629 0.008 4 −0.007 8 w −0.001 330 0.000 908 3.817 821 −0.163 720 0.002 2 −0.004 8 三维相空间法 u 0.002 486 0.002 714 3.615 697 0.032 647 0.014 2 −0.008 0 v −0.001 022 0.002 629 3.082 643 0.171 276 0.010 9 −0.009 9 w −0.001 372 0.000 935 4.963 777 −0.413 947 0.003 5 −0.006 5
下载: 导出CSV
-
[1] 黄一心, 丁建乐, 鲍旭腾, 等. 中国渔业装备和工程科技发展综述[J]. 渔业现代化, 2019, 46(5): 1−8. doi: 10.3969/j.issn.1007-9580.2019.05.001Huang Yixin, Ding Jianle, Bao Xuteng, et al. Development research on China fishery equipment and engineering technology[J]. Fishery Modernization, 2019, 46(5): 1−8. doi: 10.3969/j.issn.1007-9580.2019.05.001 [2] 杨宗澄, 白秀琴, 姜欢, 等. 船体表面海洋污损生物附着规律分析[J]. 船舶工程, 2016, 38(2): 29−33, 79.Yang Zongcheng, Bai Xiuqin, Jiang Huan, et al. Analysis of biofouling occurrence trends on ship hull surface[J]. Ship Engineering, 2016, 38(2): 29−33, 79. [3] 王海涛, 张东兴, 郑岩. 防除海洋污损生物附着的技术研究进展[J]. 水产学杂志, 2018, 31(6): 47−50. doi: 10.3969/j.issn.1005-3832.2018.06.010Wang Haitao, Zhang Dongxing, Zheng Yan. A review: research progress on prevention and removal technology of marine fouling organisms[J]. Chinese Journal of Fisheries, 2018, 31(6): 47−50. doi: 10.3969/j.issn.1005-3832.2018.06.010 [4] Jadidi P, Zeinoddini M, Soltanpour M, et al. Towards an understanding of marine fouling effects on VIV of circular cylinders: aggregation effects[J]. Ocean Engineering, 2018, 147: 227−242. doi: 10.1016/j.oceaneng.2017.10.037 [5] Balasubramanian V, Rajaram R, Palanichamy S, et al. Lanosterol expressed bio-fouling inhibition on Gulf of Mannar coast, India[J]. Progress in Organic Coatings, 2018, 115: 100−106. doi: 10.1016/j.porgcoat.2017.11.009 [6] Crisp D J. The behaviour of barnacle cyprids in relation to water movement over a surface[J]. Journal of Experimental Biology, 1955, 32(3): 569−590. doi: 10.1242/jeb.32.3.569 [7] 廖平安, 胡秀琳. 流速对藻类生长影响的试验研究[J]. 北京水利, 2005(2): 12−14.Liao Ping’an, Hu Xiulin. Experimental study on the effect of flow velocity on algal growth[J]. Beijing Water Resources, 2005(2): 12−14. [8] 严松, 吴浩, 孙大鹏, 等. 声学多普勒流速仪在水槽流速测量中的应用[J]. 实验室研究与探索, 2017, 36(5): 9−13. doi: 10.3969/j.issn.1006-7167.2017.05.003Yan Song, Wu Hao, Sun Dapeng, et al. Application of acoustic Doppler velocimetry in flume flow experiment[J]. Research and Exploration in Laboratory, 2017, 36(5): 9−13. doi: 10.3969/j.issn.1006-7167.2017.05.003 [9] Sharma A, Maddirala A K, Kumar B. Modified singular spectrum analysis for despiking acoustic Doppler velocimeter (ADV) data[J]. Measurement, 2018, 117: 339−346. doi: 10.1016/j.measurement.2017.12.025 [10] Fugate D C, Friedrichs C T. Determining concentration and fall velocity of estuarine particle populations using ADV, OBS and LISST[J]. Continental Shelf Research, 2002, 22(11/13): 1867−1886. [11] Goring D G, Nikora V I. Despiking acoustic Doppler velocimeter data[J]. Journal of Hydraulic Engineering, 2002, 128(1): 117−126. doi: 10.1061/(ASCE)0733-9429(2002)128:1(117) [12] Cea L, Puertas J, Pena L. Velocity measurements on highly turbulent free surface flow using ADV[J]. Experiments in Fluids, 2007, 42(3): 333−348. doi: 10.1007/s00348-006-0237-3 [13] Donoho D L, Johnstone I M. Ideal spatial adaptation by wavelet shrinkage[J]. Biometrika, 1994, 81(3): 425−455. doi: 10.1093/biomet/81.3.425 [14] Rousseeuw P J. Robust estimation and identifying outliers[M]. 2nd ed. New York: McGraw-Hill, 1998. [15] Zhong Chunyi, Yin Fang, Zhang Junbo, et al. Optimized algorithm for processing outlier of water current data measured by acoustic Doppler velocimeter[J]. Journal of Marine Science and Engineering, 2020, 8(9): 655. doi: 10.3390/jmse8090655 [16] Nikora V I, Goring D G. ADV measurements of turbulence: can we improve their interpretation[J]. Journal of Hydraulic Engineering, 1998, 124(6): 630−634. doi: 10.1061/(ASCE)0733-9429(1998)124:6(630) [17] Wahl T L. Discussion of “Despiking Acoustic Doppler Velocimeter Data” by Derek G. Goring and Vladimir I. Nikora[J]. Journal of Hydraulic Engineering, 2003, 129(6): 484−487. doi: 10.1061/(ASCE)0733-9429(2003)129:6(484) [18] Joanes D N, Gill C A. Comparing measures of sample skewness and kurtosis[J]. Journal of the Royal Statistical Society: Series D (The Statistician), 1998, 47(1): 183−189. doi: 10.1111/1467-9884.00122 [19] Köse Ö. Various filtering algorithms used to eliminate outliers in velocity time series obtained by ADVs (acoustic Doppler velocimeter)[J]. Arabian Journal of Geosciences, 2013, 6(7): 2691−2697. doi: 10.1007/s12517-012-0523-8 [20] Parsheh M, Sotiropoulos F, Porté-Agel F. Estimation of power spectra of acoustic-Doppler velocimetry data contaminated with intermittent spikes[J]. Journal of Hydraulic Engineering, 2010, 136(6): 368−378. doi: 10.1061/(ASCE)HY.1943-7900.0000202 [21] Jesson M, Sterling M, Bridgeman J. Despiking velocity time-series—Optimisation through the combination of spike detection and replacement methods[J]. Flow Measurement and Instrumentation, 2013, 30: 45−51. doi: 10.1016/j.flowmeasinst.2013.01.007 [22] Islam M R, Zhu D Z. Kernel density-based algorithm for despiking ADV data[J]. Journal of Hydraulic Engineering, 2013, 139(7): 785−793. doi: 10.1061/(ASCE)HY.1943-7900.0000734 [23] Razaz M, Kawanisi K. Signal post-processing for acoustic velocimeters: detecting and replacing spikes[J]. Measurement Science and Technology, 2011, 22(12): 125404. doi: 10.1088/0957-0233/22/12/125404 -

计量
- 文章访问数: 426
- HTML全文浏览量: 130
- PDF下载量: 30
- 被引次数: 0
