Statistical analysis on wave characteristics in the Sanmen Bay of Zhejiang middle coast
-
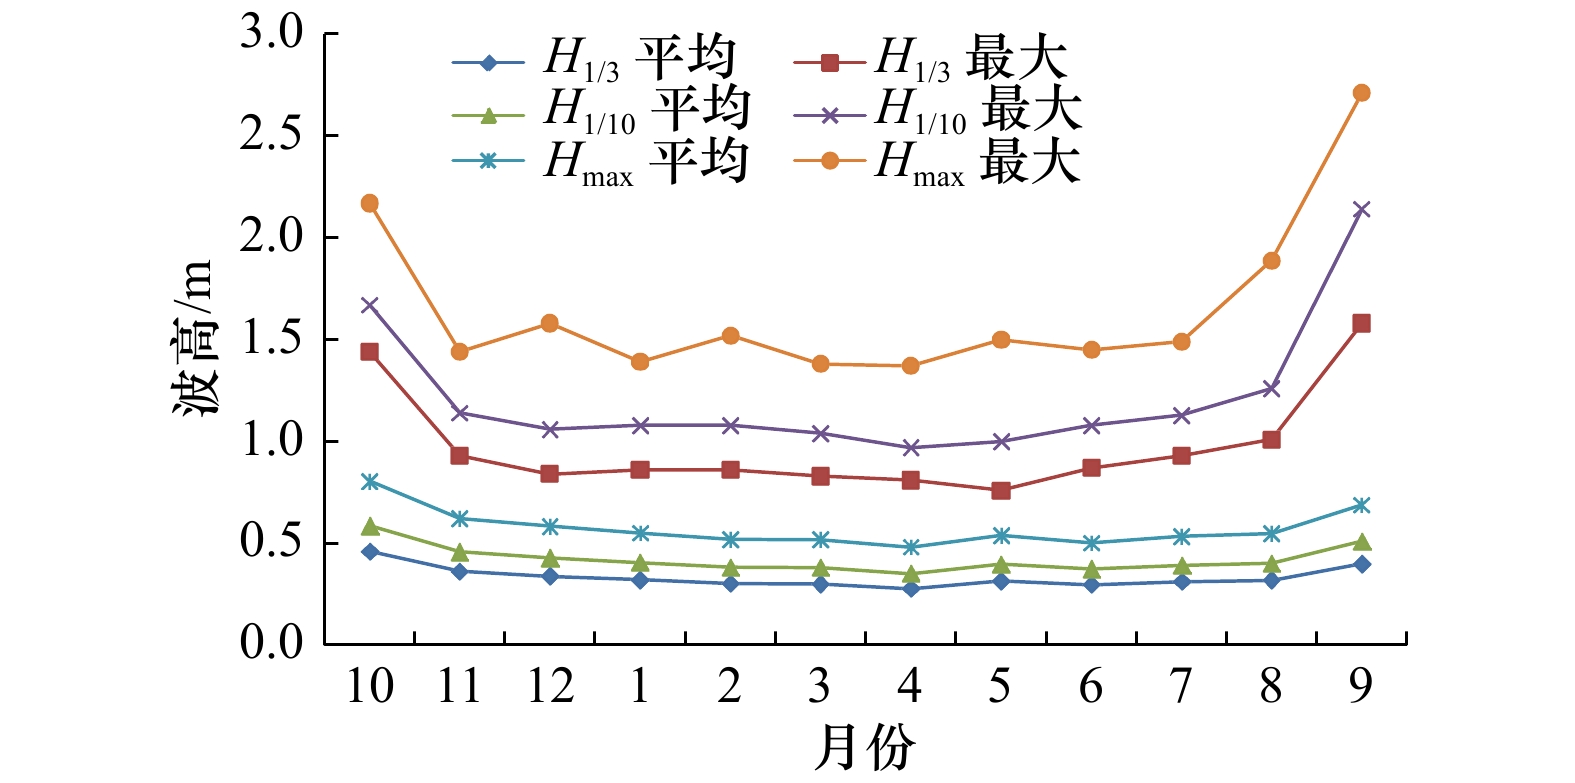
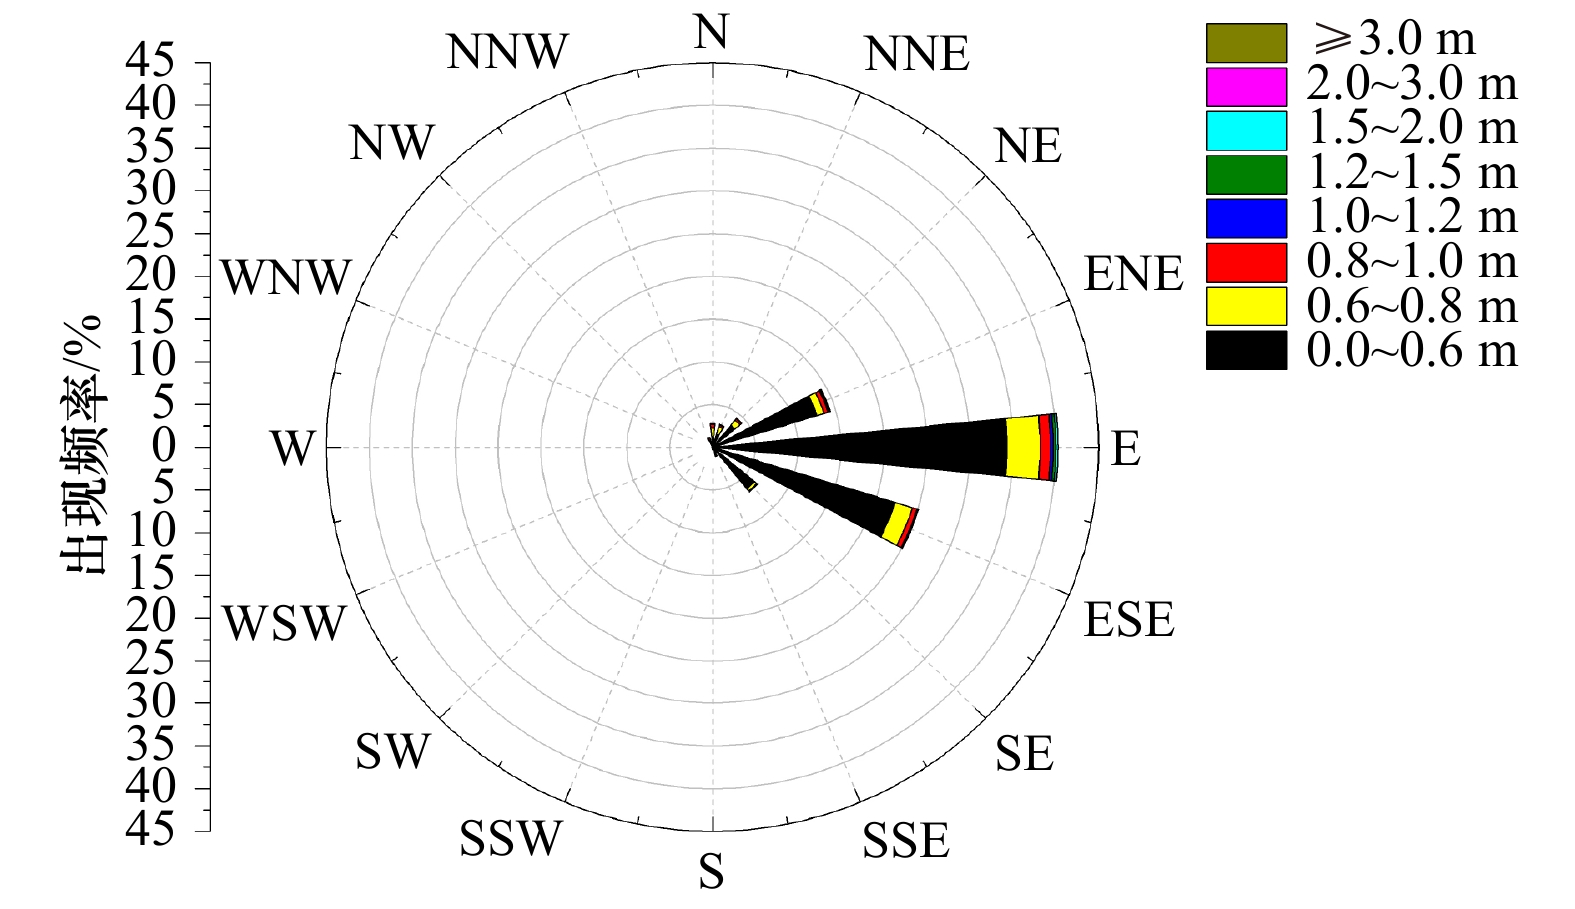
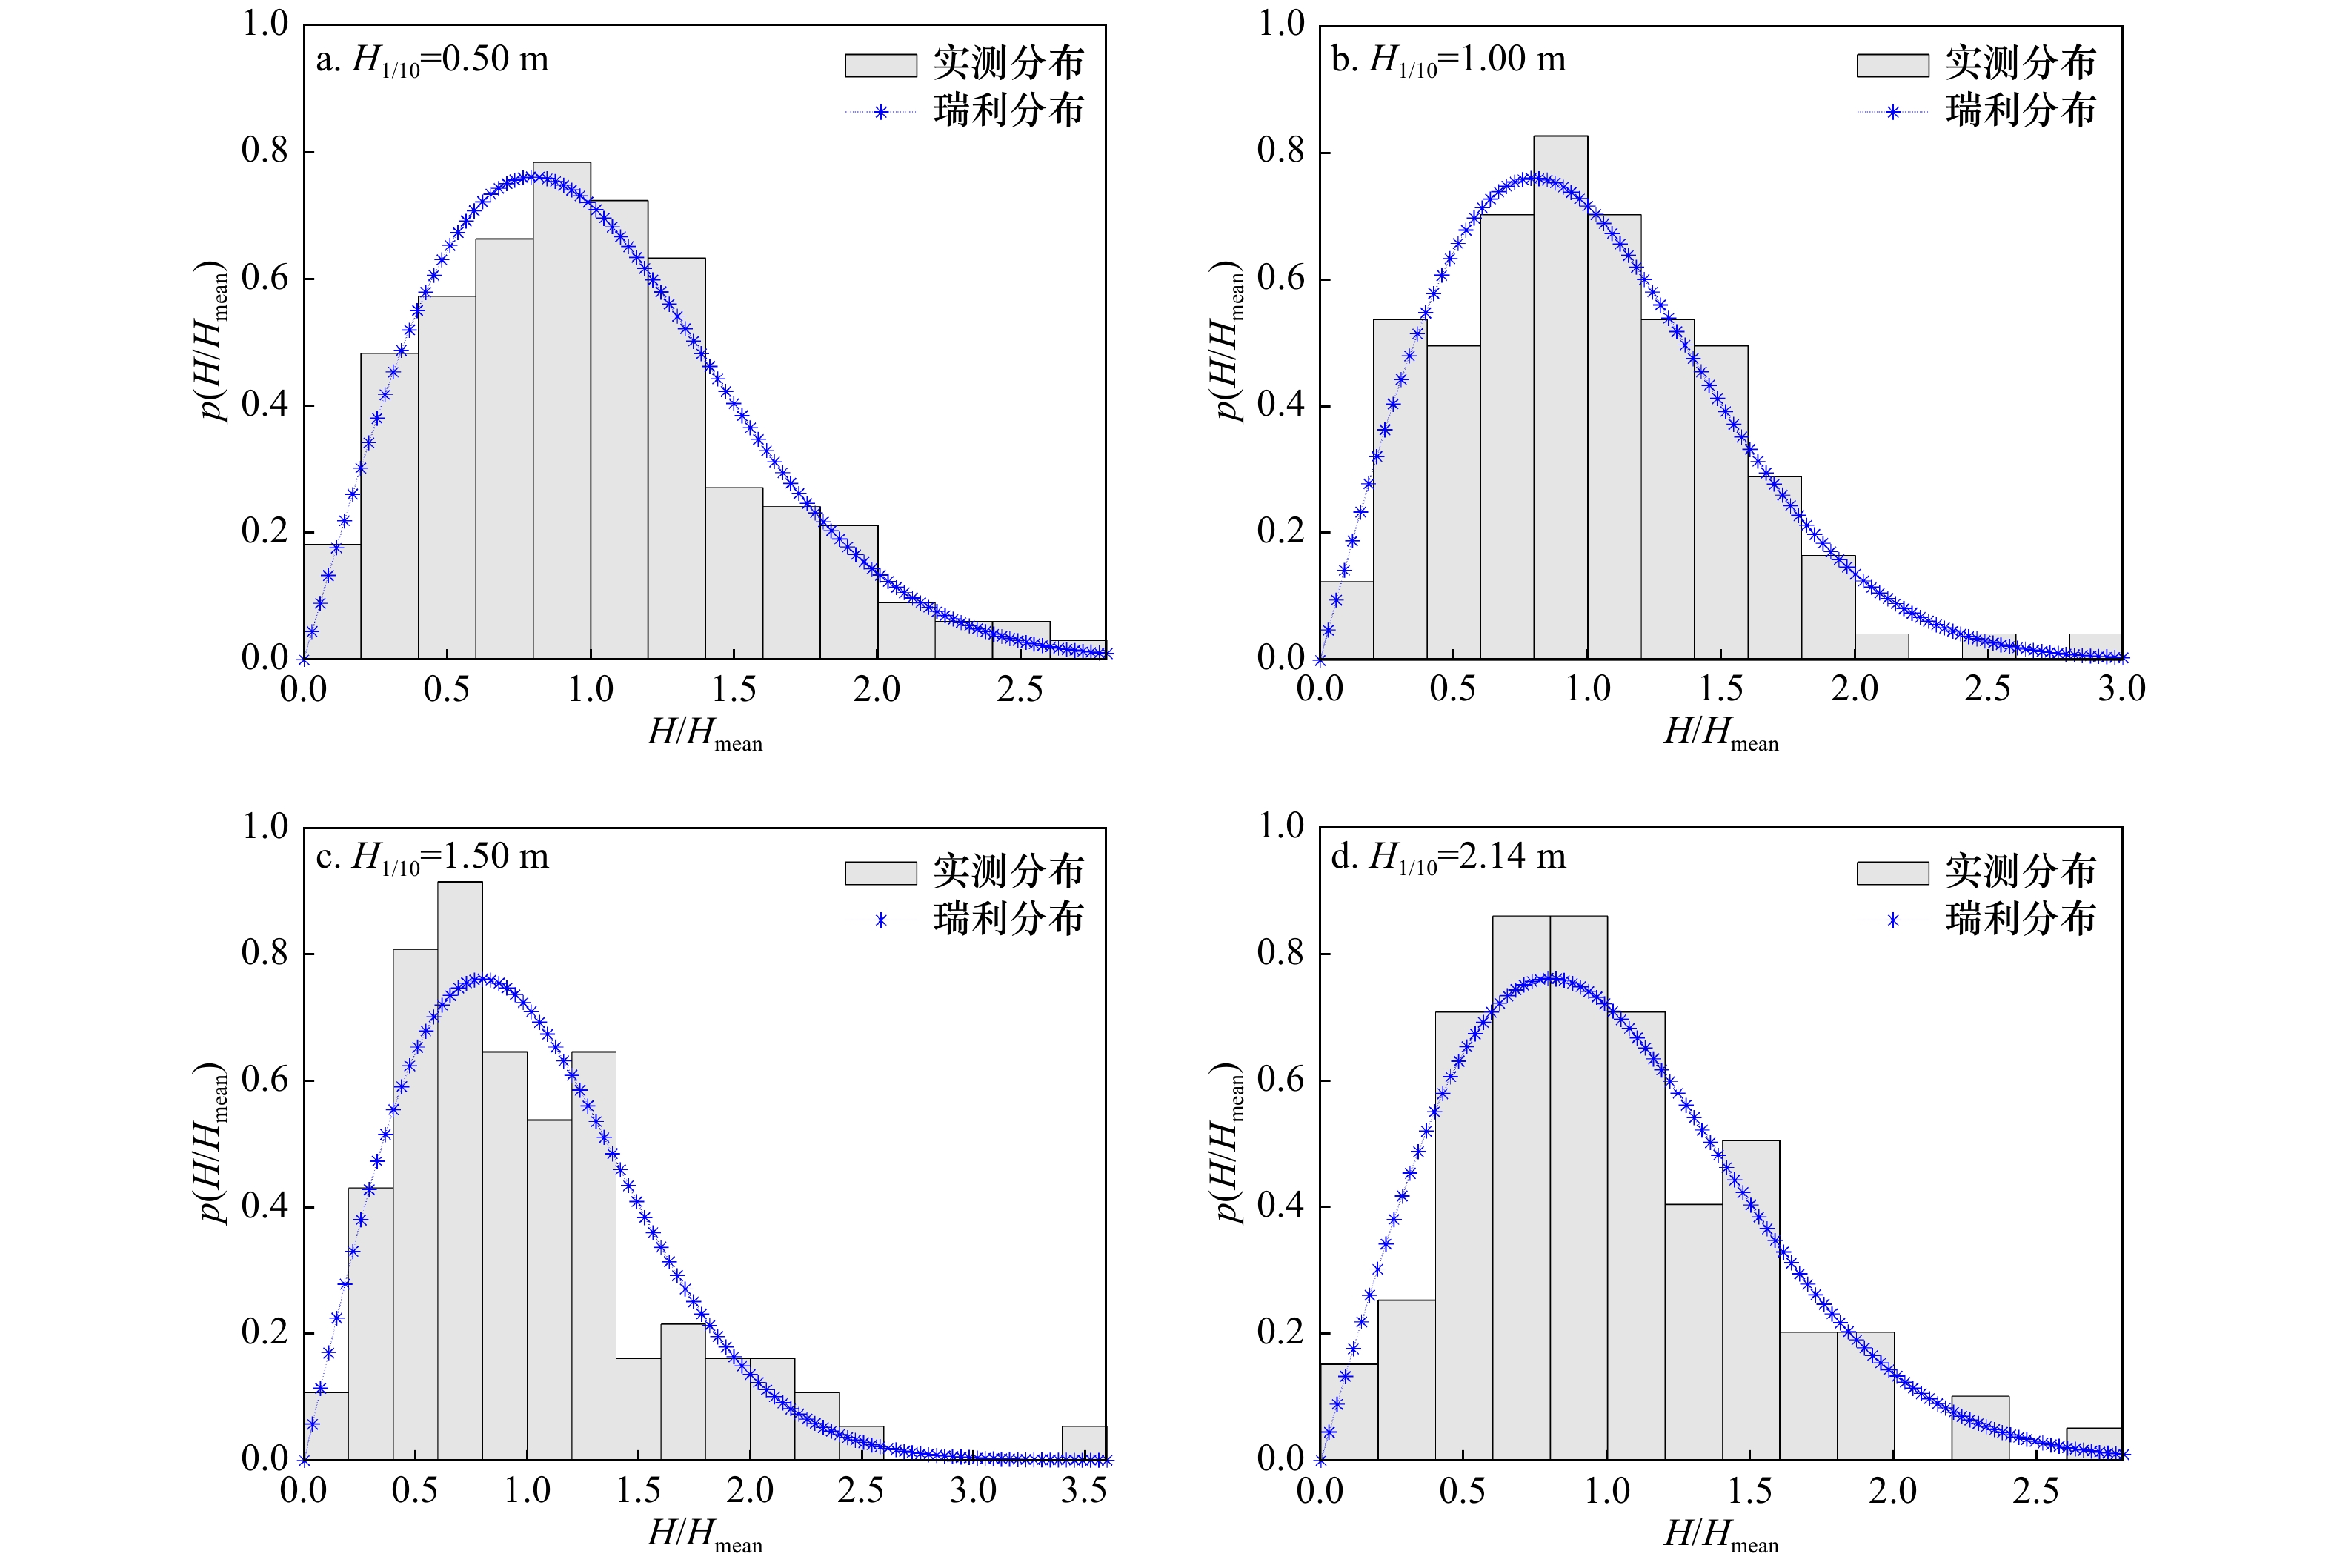
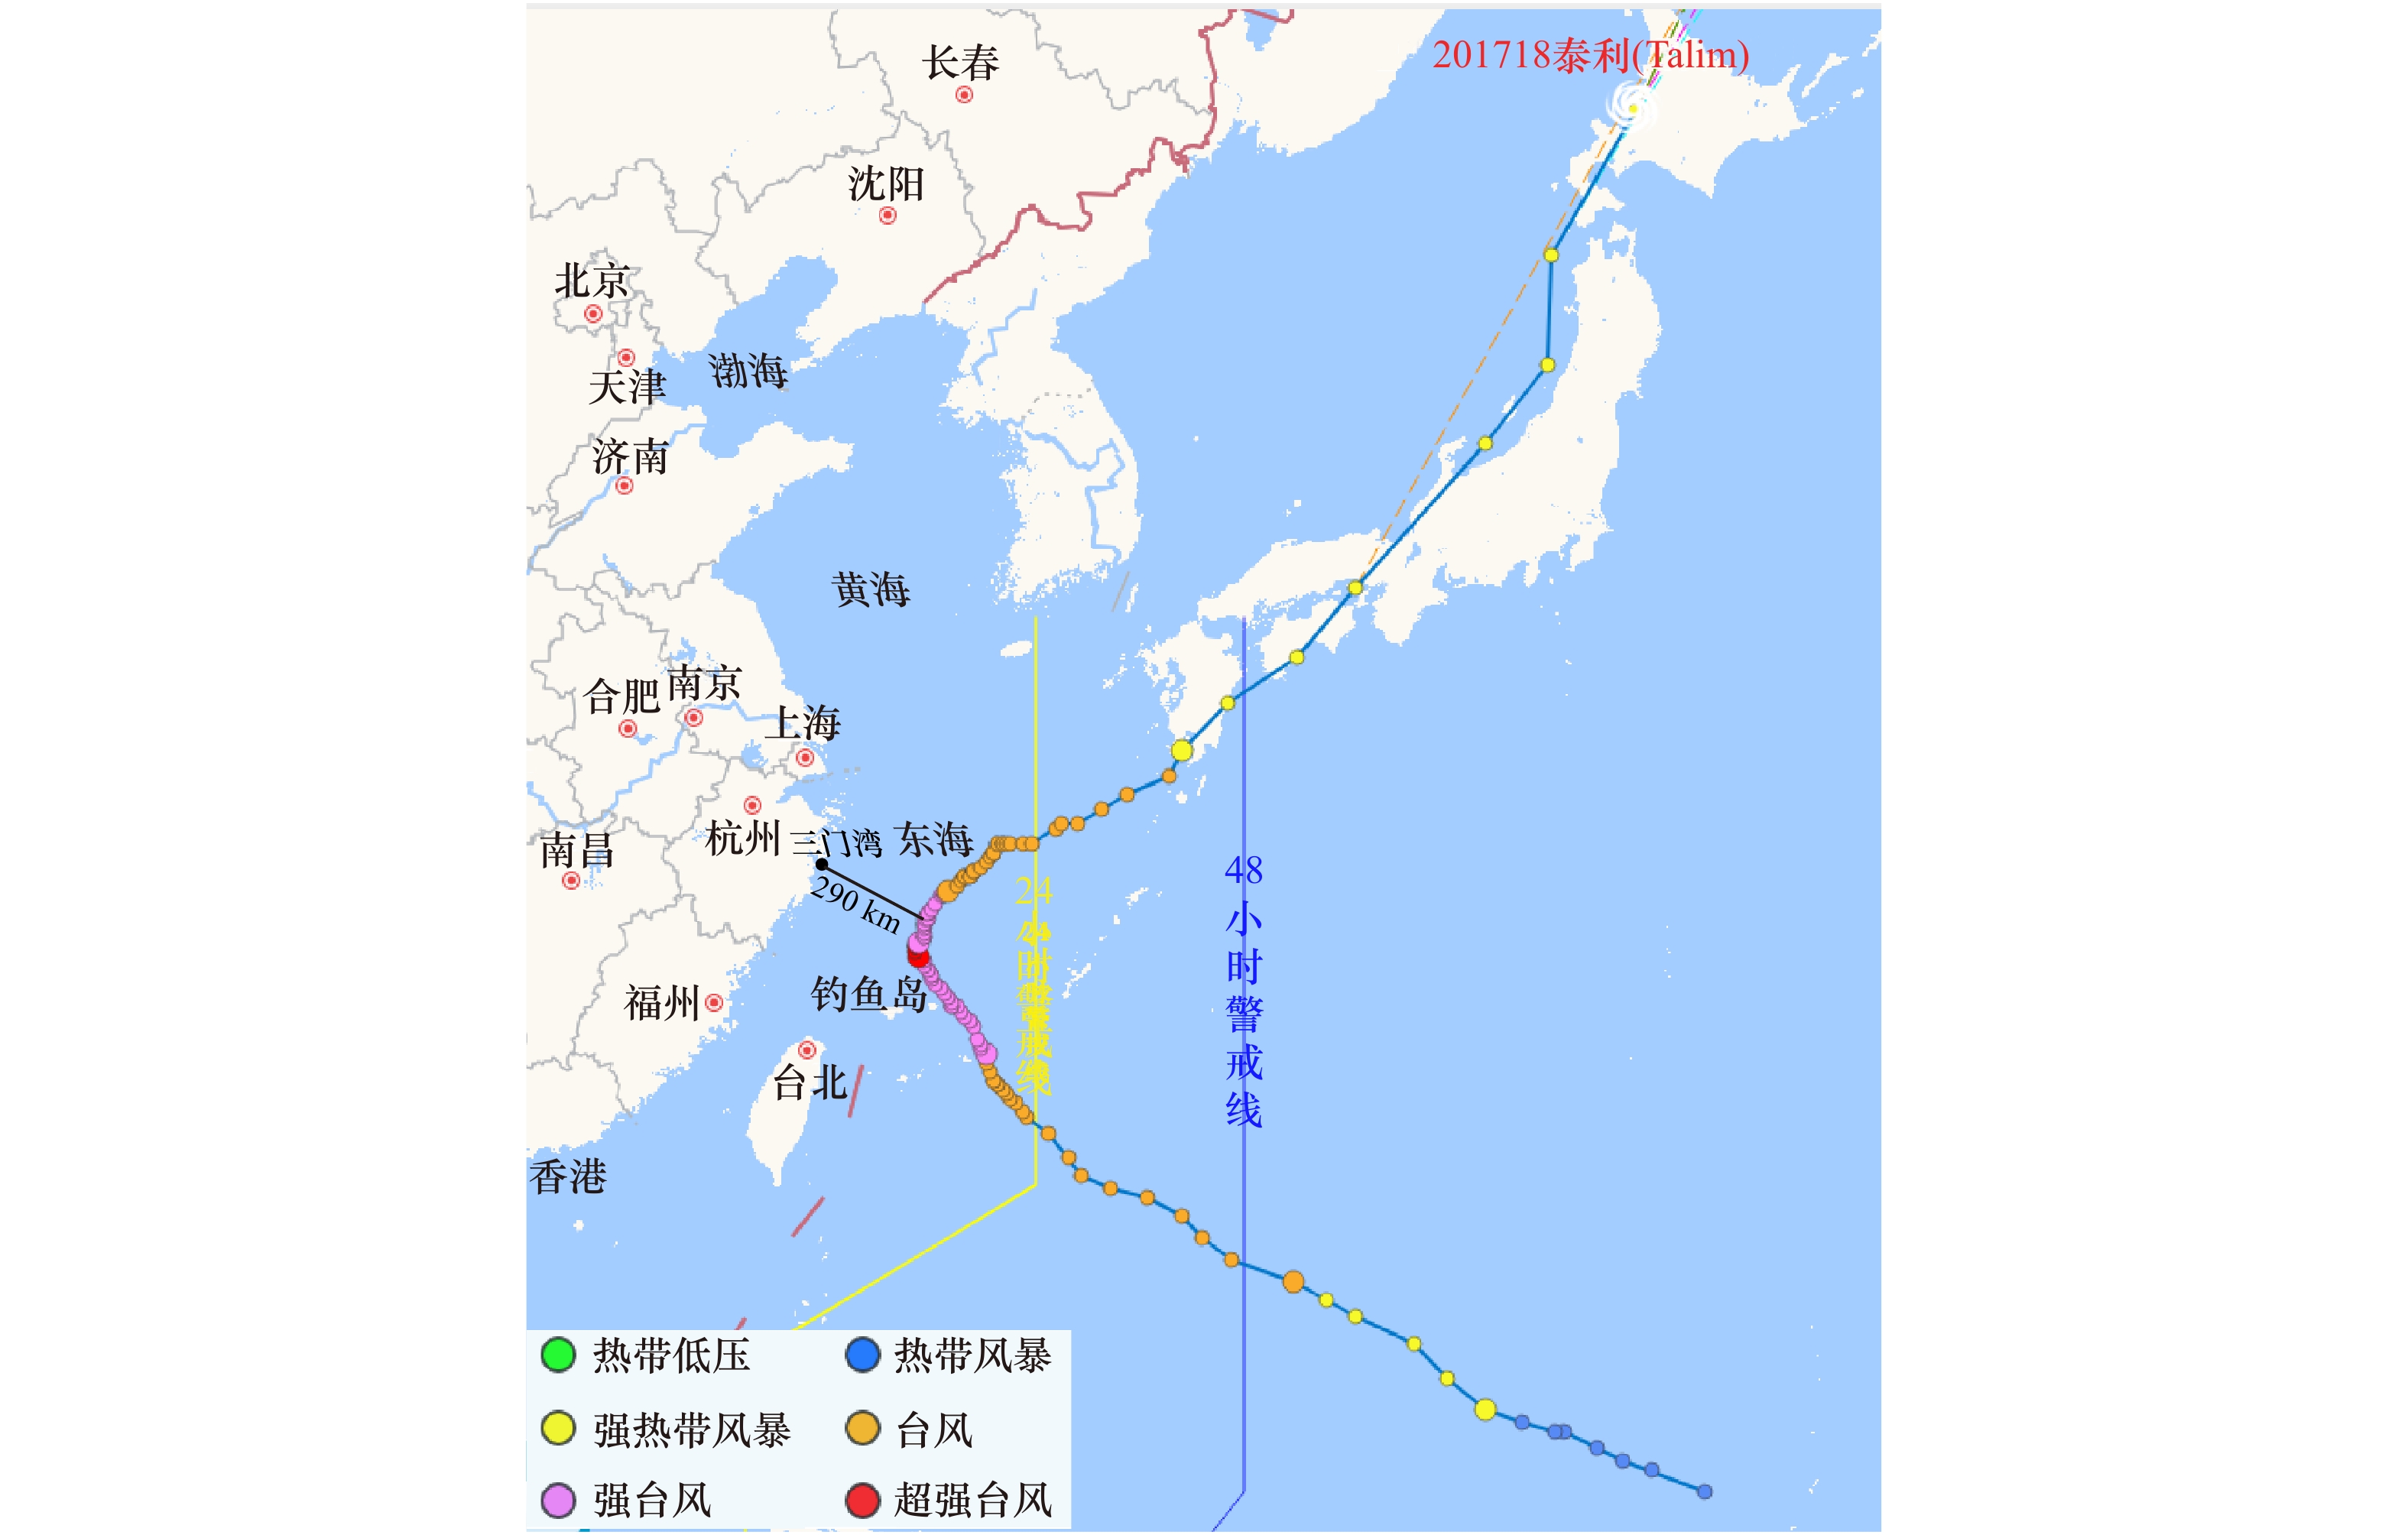
摘要: 为了研究浙江中部三门湾海域的波浪特征,本文基于AWAC波浪观测仪在该海域进行了连续1年的观测,对观测得到的波浪参数进行了统计分析、线性回归分析,同时研究分析了三门湾海域受台风影响时,波浪参数和波浪谱的变化情况,探讨了波浪变化的原因。研究表明,三门湾海域常浪向和强浪向均为E向,地形是主导因素;显著波高绝大部分在0.8 m以下,期间的最大波高为2.71 m;该海域的波浪特征分布是一个比较典型的瑞利分布;台风“泰利”期间波能谱以双峰为主,外海涌浪和研究海域风区内的风浪形成混合浪,其中0.08 Hz左右的低频涌浪成分占比很大,而0.25 Hz左右的高频风浪成分占比较小。本文的研究工作为沿海海洋工程结构物的设计建造以及防灾减灾提供重要参考依据。Abstract: In order to study the wave characteristics in the Sanmen Bay, field observation based on AWAC data acquisition equipment was continued for one year, and the statistical analysis, linear regression analysis was done. Moreover, statistics and spectral variations of waves during the typhoon occurrence were investigated, and the reason for the variations was determined on the basis of wave data collected. The results show that the dominant wave direction and the strong wave direction are both E due to the topography of coastal areas; during the wave observation period, H1/10 is mainly under 0.8 m, and Hmax is 2.71 m; the distribution of wave characteristics is a typical Rayleigh distribution in this region; the wave spectra estimated during Typhoon Talim is double-peaked, and the total wave is a combination of swell and wind sea, when the low frequency swell about 0.08 Hz is in a dominant position and the high frequency wind sea about 0.25 Hz is relatively weak. This study will be important as reference in the design of offshore structures as well as for disaster prevention and mitigation.
-
Key words:
- wave characteristics /
- Sanmen Bay /
- linear regression analysis /
- wind sea /
- swell /
- wave spectra
-
表 1 测站各级各向显著波高(H1/10)出现频率分布(%)
Tab. 1 Distribution of H1/10 in different levels and different directions (%)
H1/10/m N NNE NE ENE E ESE SE SSE S SSW SW WSW W WNW NW NNW 合计 0.0~0.6 1.13 1.63 3.39 12.72 34.35 22.24 6.31 1.10 0.30 0.03 0.09 − 0.01 0.02 0.06 0.32 83.70 0.6~0.8 1.18 0.89 0.78 0.88 3.84 2.12 0.34 0.05 0.01 − − − − − 0.01 0.53 10.62 0.8~1.0 0.40 0.25 0.21 0.51 1.21 0.57 0.08 − − − − − − − 0.02 0.31 3.56 1.0~1.2 0.09 0.05 0.02 0.08 0.34 0.13 0.03 − − − − − − − − 0.07 0.81 1.2~1.5 − − 0.01 0.07 0.29 0.01 0.01 − − − − − − − − − 0.39 1.5~2.0 − − − 0.08 0.25 − − − − − − − − − − − 0.33 ≥2.0 − − − 0.01 − − − − − − − − − − − − 0.01 合计 2.80 2.82 4.41 14.35 40.27 25.07 6.78 1.14 0.31 0.03 0.09 − 0.01 0.02 0.09 1.22 99.42 平均值/m 0.64 0.57 0.47 0.40 0.43 0.39 0.35 0.31 0.25 0.28 0.32 − 0.22 0.37 0.55 0.71 0.42 最大值/m 1.08 1.12 1.43 2.14 1.95 1.26 1.22 0.79 0.66 0.38 0.5 − 0.22 0.47 0.86 1.06 2.14 注:−代表不存在这些情况。 表 2 测站各级各向平均波周期出现频率分布(%)
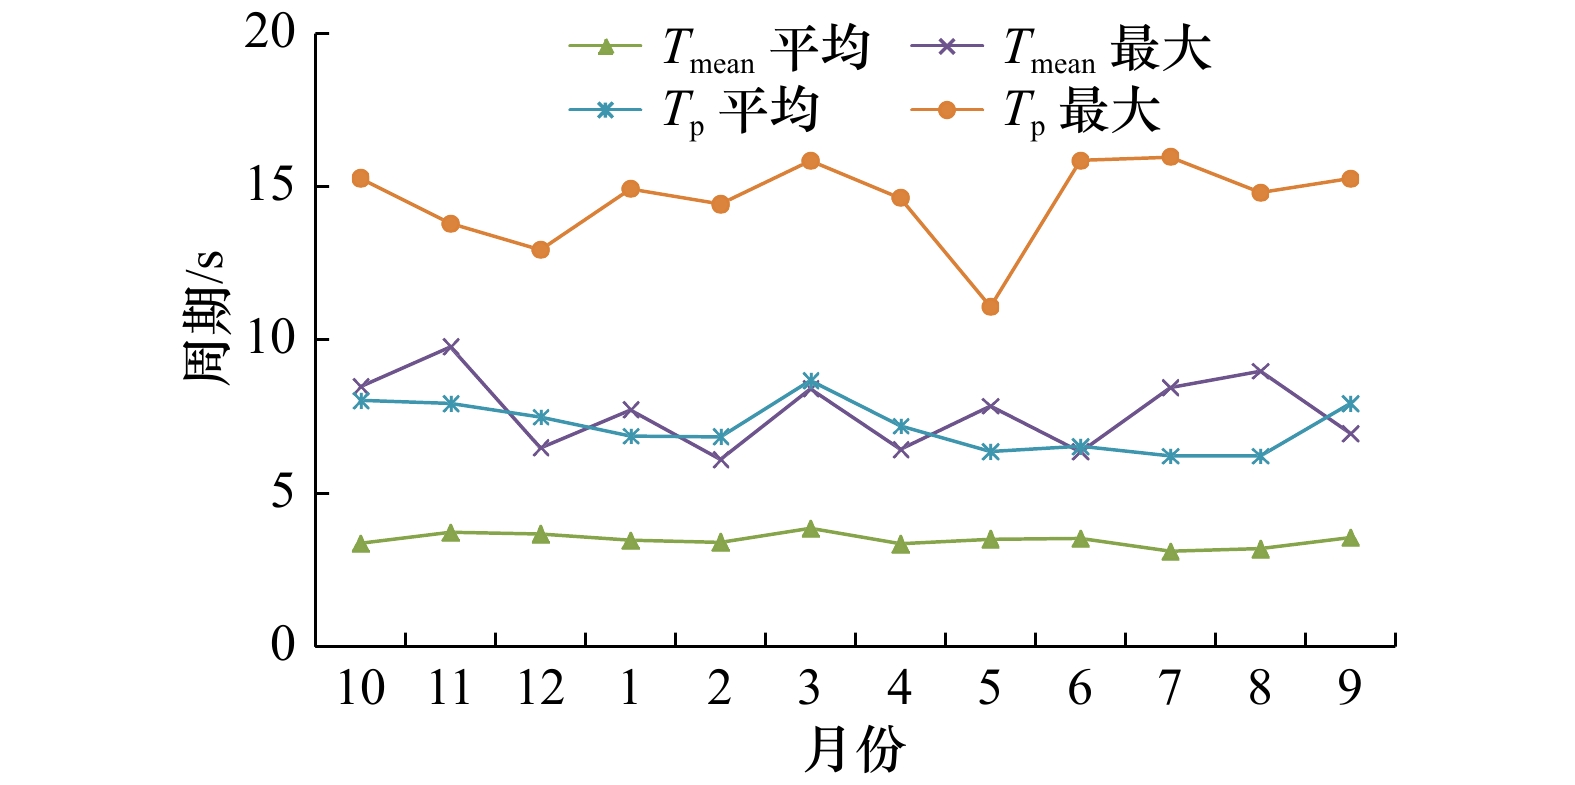
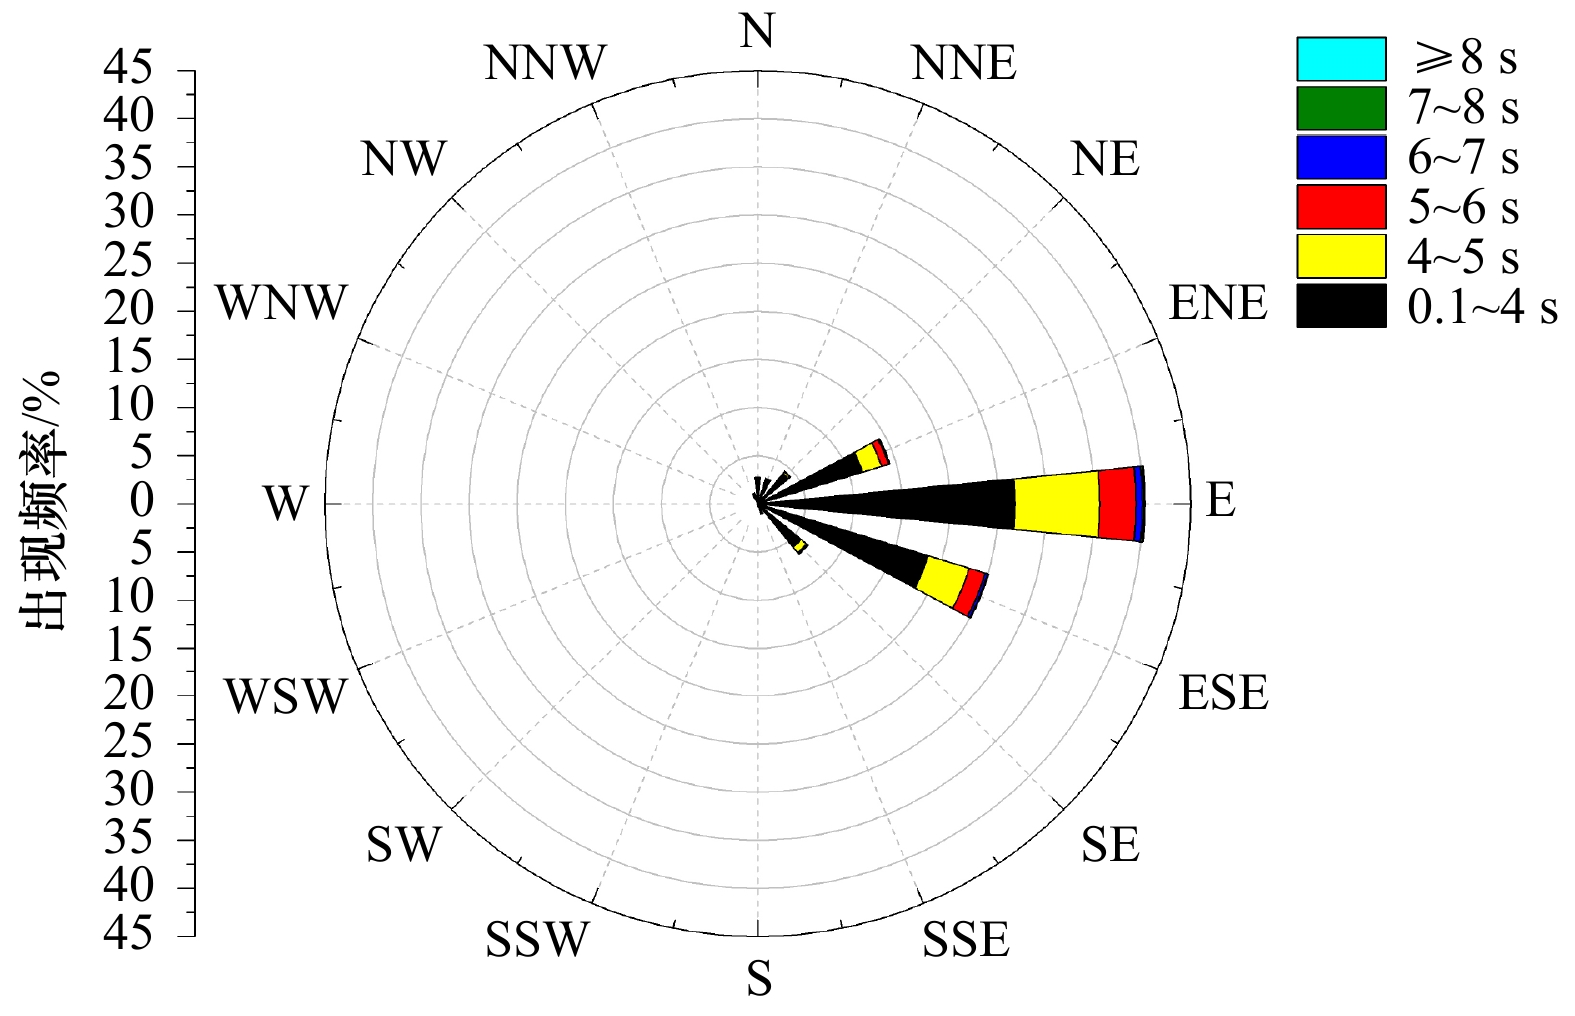
Tab. 2 Distribution of Tmean in different levels and different directions (%)
Tmean/s N NNE NE ENE E ESE SE SSE S SSW SW WSW W WNW NW NNW 合计 0.1~4 2.79 2.79 4.17 11.39 26.76 18.55 5.84 1.05 0.26 0.03 0.07 − − 0.02 0.08 1.22 75.02 4~5 0.01 0.02 0.18 2.08 8.81 4.44 0.71 0.06 0.05 − 0.02 − − − 0.01 − 16.39 5~6 − 0.01 0.06 0.73 3.74 1.76 0.16 0.03 − − − − 0.01 − − − 6.51 6~7 − − − 0.13 0.66 0.25 0.06 − − − − − − − − − 1.10 7~8 − − − 0.01 0.17 0.05 0.01 − − − − − − − − − 0.24 ≥8 − − − 0.01 0.13 0.02 − − − − − − − − − − 0.16 合计/% 2.80 2.82 4.41 14.35 40.27 25.07 6.78 1.14 0.31 0.03 0.09 − 0.01 0.02 0.09 1.22 99.42 平均值/s 2.94 2.90 3.03 3.39 3.71 3.49 3.14 3.07 3.20 2.51 2.84 − 5.36 2.47 3.03 3.06 3.47 最大值/s 4.05 5.53 5.92 8.09 9.78 8.45 7.10 5.55 4.99 2.68 4.40 − 5.36 2.90 4.73 3.60 9.78 注:−表示不存在这些情况。 表 3 三门湾海域各波参数比值系数
Tab. 3 Wave parameter ratio factors of the Sanmen Bay
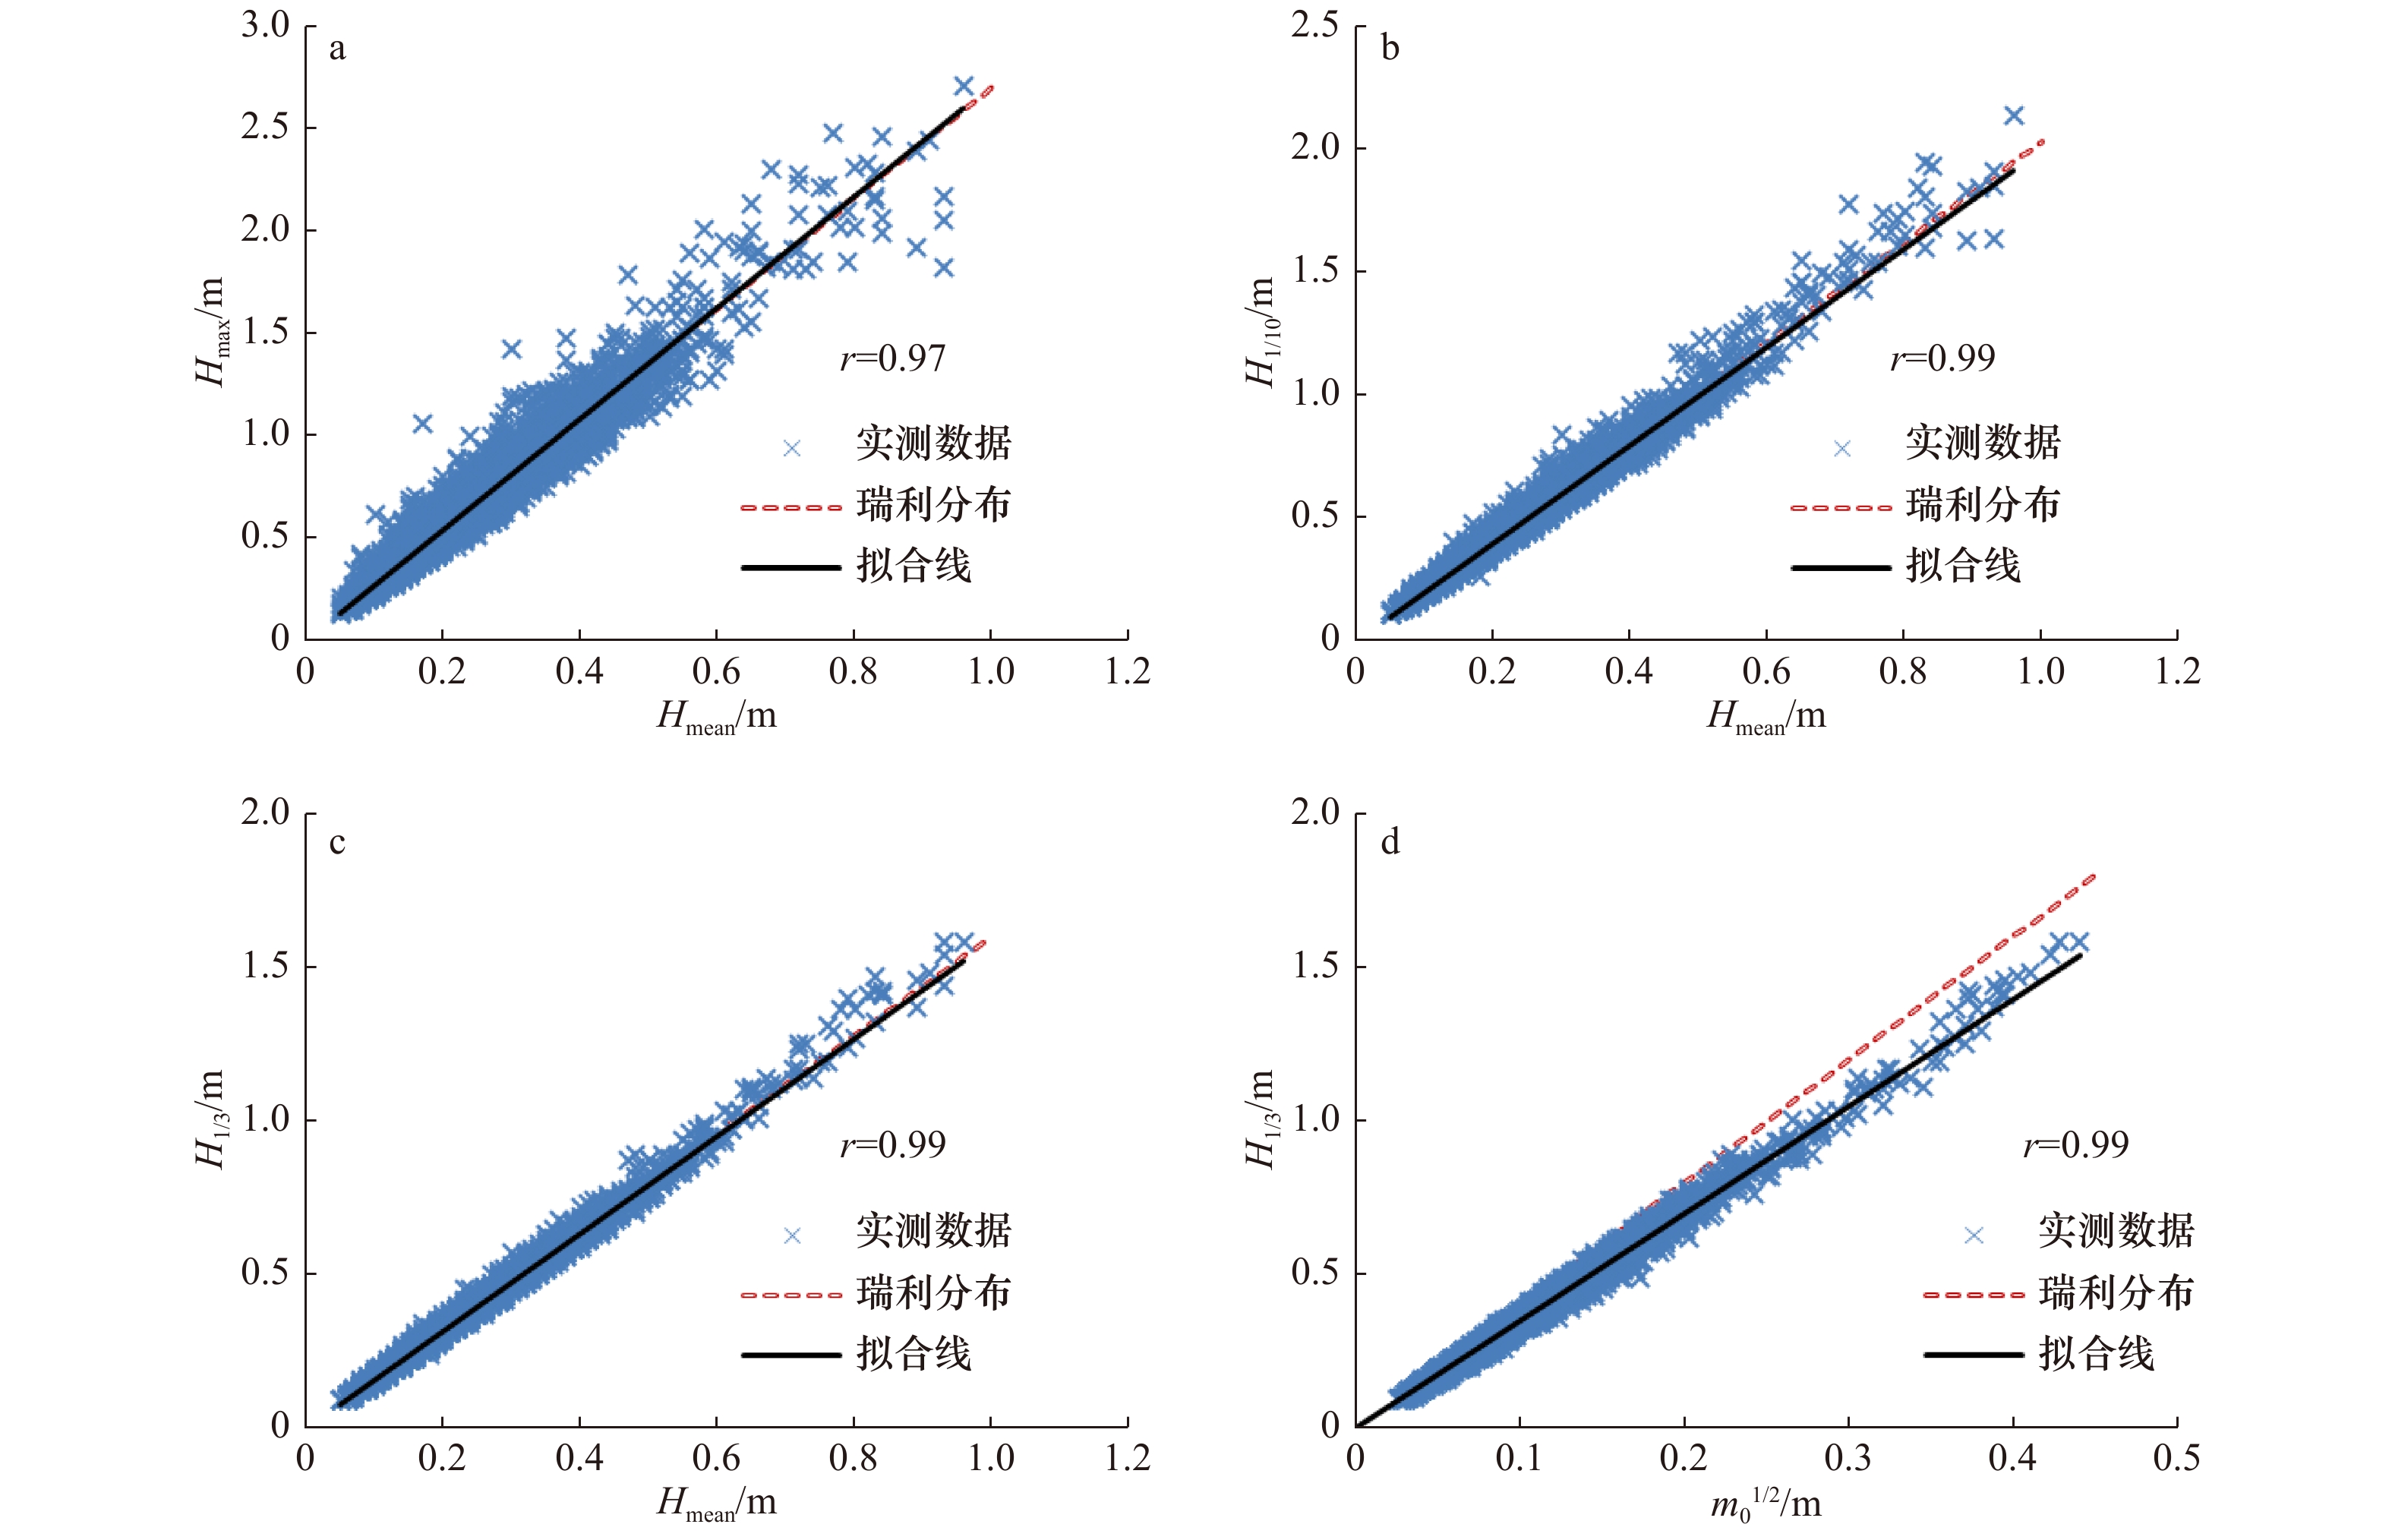
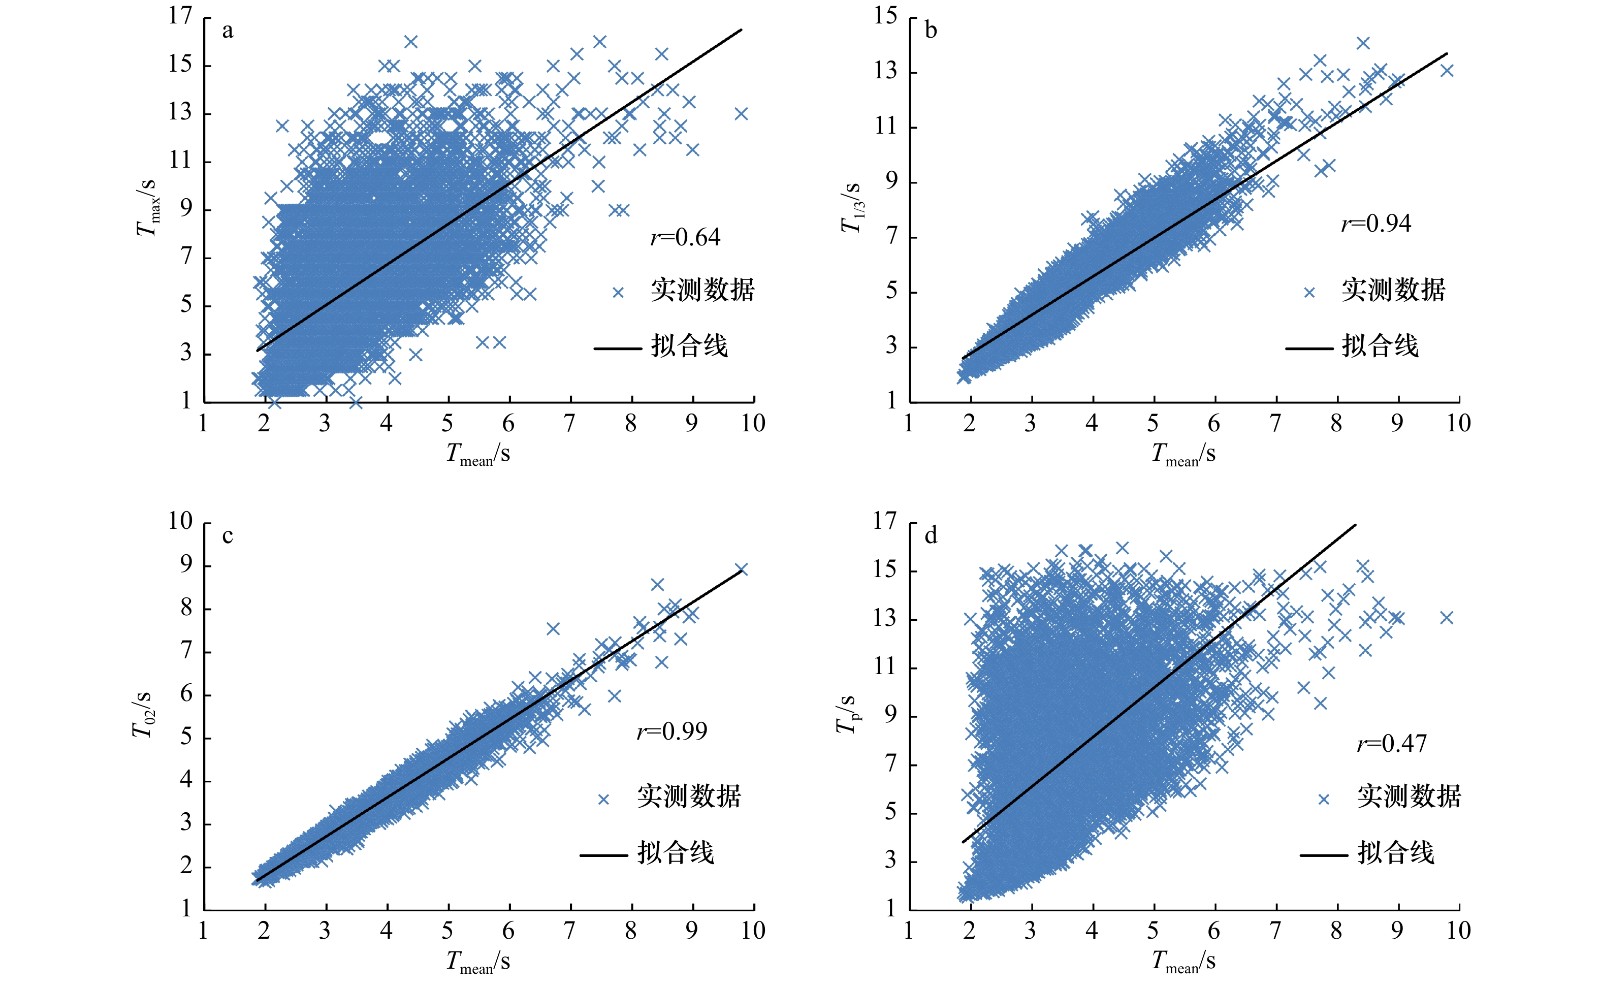
特征波高比 变化范围 线性回归系数 标准差 深水理论值 Hmax/Hmean 1.96~6.24 2.70 0.31 2.70 H1/10/Hmean 1.44~2.86 2.00 0.13 2.03 H1/3/Hmean 1.33~2.0 1.58 0.07 1.60 H1/3/$m_0^{1/2}$ 2.84~4.0 3.50 0.17 4.00 特征波周期比 变化范围 线性回归系数 标准差 深水理论值 Tmax/Tmean 0.29~5.48 1.69 0.64 1.20 T1/10/Tmean 0.97~3.14 1.58 0.31 1.20 T1/3/Tmean 1.01~1.97 1.40 0.16 1.20 T01/Tmean 0.94~1.31 1.10 0.06 1.00 T02/Tmean 0.73~1.12 0.91 0.05 <1.00 Tp/Tmean 0.74~6.67 2.04 0.94 >1.00 表 4 台风“泰利”期间各波参数比值系数
Tab. 4 Wave parameter ratio factors during Typhoon Talim
特征波高比 变化范围 线性回归系数 标准差 深水理论值 Hmax/Hmean 2.16~3.47 2.73 0.29 2.70 H1/10/Hmean 1.75~2.47 2.11 0.15 2.03 H1/3/Hmean 1.42~1.77 1.63 0.07 1.60 H1/3/$m_0^{1/2}$ 2.94~3.81 3.47 0.17 4.00 特征波周期比 变化范围 线性回归系数 标准差 深水理论值 Tmax/Tmean 0.75~4.07 2.12 0.67 1.20 T1/10/Tmean 1.09~2.68 1.94 0.33 1.20 T1/3/Tmean 1.10~1.75 1.55 0.16 1.20 T01/Tmean 1.00~1.29 1.18 0.07 1.00 T02/Tmean 0.81~1.01 0.90 0.04 <1.00 Tp/Tmean 0.90~4.60 2.48 0.80 >1.00 -
[1] 孙佳, 王燕妮, 左军成. 江浙沿海台风特征分析[J]. 河海大学学报(自然科学版), 2015, 43(3): 215−221.Sun Jia, Wang Yanni, Zuo Juncheng. Characteristic analysis of typhoon along coastal areas of Jiangsu and Zhejiang provinces[J]. Journal of Hohai University (Natural Sciences), 2015, 43(3): 215−221. [2] Kumar V S, Anoop T R. Spatial and temporal variations of wave height in shelf seas around India[J]. Natural Hazards, 2015, 78(3): 1693−1706. doi: 10.1007/s11069-015-1796-5 [3] Amrutha M M, Kumar V S, George J. Observations of long-period waves in the nearshore waters of central west coast of India during the fall inter-monsoon period[J]. Ocean Engineering, 2017, 131: 244−262. doi: 10.1016/j.oceaneng.2017.01.014 [4] Nair M A, Kumar V S, Amrutha M M. Spectral wave characteristics in the nearshore waters of northwestern Bay of Bengal[J]. Pure and Applied Geophysics, 2018, 175(8): 3111−3136. doi: 10.1007/s00024-018-1838-5 [5] Kumar V S, Anand N M, Kumar K A, et al. Multipeakedness and groupiness of shallow water waves along Indian coast[J]. Journal of Coastal Research, 2003, 19(4): 1052−1065. [6] Glejin J, Kumar V S, Singh J. Inter-annual variations in wave characteristics off Ratnagiri, Northeast Arabian Sea[J]. Aquatic Procedia, 2015, 4: 25−31. doi: 10.1016/j.aqpro.2015.02.005 [7] Kumar V S, Singh J, Pednekar P, et al. Waves in the nearshore waters of northern Arabian Sea during the summer monsoon[J]. Ocean Engineering, 2011, 38(2/3): 382−388. [8] Glejin J, Kumar V S, Amrutha M M, et al. Characteristics of long-period swells measured in the near shore regions of eastern Arabian Sea[J]. International Journal of Naval Architecture and Ocean Engineering, 2016, 8(4): 312−319. doi: 10.1016/j.ijnaoe.2016.03.008 [9] Kumar V S, Dubhashi K K, Nair T M B. Spectral wave characteristics off Gangavaram, Bay of Bengal[J]. Journal of Oceanography, 2014, 70(3): 307−321. doi: 10.1007/s10872-014-0223-y [10] Patra S K, Mishra P, Mohanty P K, et al. Cyclone and monsoonal wave characteristics of northwestern Bay of Bengal: long-term observations and modeling[J]. Natural Hazards, 2016, 82(2): 1051−1073. doi: 10.1007/s11069-016-2233-0 [11] Umesh P A, Kani S P, Bhaskaran P K. Numerical simulation of wave characteristics off Kulasekharapatnam, Southeast Coast of India[J]. Pure and Applied Geophysics, 2017, 174(10): 3979−4001. doi: 10.1007/s00024-017-1599-6 [12] Kumar P, Zhang H, Ik Kim K. Spectral density analysis for wave characteristics in Pohang New Harbor[J]. Pure and Applied Geophysics, 2014, 171(7): 1169−1185. doi: 10.1007/s00024-013-0710-x [13] Shanas P R, Aboobacker V M, Zubier K M, et al. Spectral wave characteristics along the central coast of eastern Red Sea[J]. Arabian Journal of Geosciences, 2018, 11: 90. doi: 10.1007/s12517-018-3439-0 [14] Yang Bin, Feng Weibing, Zhang Yu. Wave characteristics at the south part of the radial sand ridges of the Southern Yellow Sea[J]. China Ocean Engineering, 2014, 28(3): 317−330. doi: 10.1007/s13344-014-0026-3 [15] 杨斌, 施伟勇, 叶钦, 等. 舟山岛东北部沿海实测台风浪特性[J]. 水科学进展, 2017, 28(1): 106−115.Yang Bin, Shi Weiyong, Ye Qin, et al. Characteristics of waves in coastal waters of northeast Zhoushan Island during typhoons[J]. Advances in Water Science, 2017, 28(1): 106−115. [16] 祁祥礼, 郑向阳, 谌业良. 渤海湾中部波浪特征分析[J]. 水道港口, 2018, 39(3): 288−293. doi: 10.3969/j.issn.1005-8443.2018.03.008Qi Xiangli, Zheng Xiangyang, Shen Yeliang. Analysis of wave characteristic in the middle part of the Bohai Bay[J]. Journal of Waterway and Harbor, 2018, 39(3): 288−293. doi: 10.3969/j.issn.1005-8443.2018.03.008 [17] 宋泽坤, 施伟勇, 张峰, 等. 三门湾近期水动力特性观测研究[J]. 应用海洋学学报, 2017, 36(2): 279−285. doi: 10.3969/J.ISSN.2095-4972.2017.02.015Song Zekun, Shi Weiyong, Zhang Feng, et al. Field observation and analysis on the characteristics of tidal dynamics in Sanmen Bay[J]. Journal of Applied Oceanography, 2017, 36(2): 279−285. doi: 10.3969/J.ISSN.2095-4972.2017.02.015 [18] 李新, 周青松, 俞存根, 等. 浙江三门湾春季鱼类种类组成及多样性研究[J]. 浙江海洋学院学报(自然科学版), 2014, 33(6): 488−494.Li Xin, Zhou Qingsong, Yu Cungen, et al. Species composition and diversity of fish in spring in Sanmen Bay[J]. Journal of Zhejiang Ocean University (Natural Science), 2014, 33(6): 488−494. [19] Cartwright D E, Longuet-Higgins M S. The statistical distribution of the maxima of a random function[J]. Proceedings of the Royal Society A, Mathematical, Physical and Engineering Sciences, 1956, 237(1209): 212−232. [20] Pedersen T, Lohrmann A, Krogstad H E. Wave measurement from a subsurface platform[C]//Proceedings of the Waves 2005 Conference. Madrid, Spain, 2005: 1−10. [21] Pedersen T, Nylund S, Dolle A. Wave height measurements using acoustic surface tracking[C]//OCEANS '02 MTS/IEEE. Biloxi MI, USA: IEEEX, 2002, 3: 1747−1754. [22] 董胜, 孔令双. 海洋工程环境概论[M]. 青岛: 中国海洋大学出版社, 2005.Dong Sheng, Kong Lingshuang. An Introduction to Ocean Engineering Environment[M]. Qingdao: China Ocean University Press, 2005. [23] Goda Y. Random Seas and Design of Maritime Structures[M]. Singapore: World Scientific Publishing Co Pte Ltd, 2000: 278−280. [24] Goda Y. On wave groups[C]//Proceedings of Boss, Trondheim, Norway, 1976, 76(1): 115−128. [25] Portilla J, Ocampo-Torres F J, Monbaliu J. Spectral partitioning and identification of wind sea and swell[J]. Journal of Atmospheric and Oceanic Technology, 2009, 26(1): 107−122. doi: 10.1175/2008JTECHO609.1 -


 下载:
下载:
