

Detecting sea ice of Bohai Sea using SAR images based on a hybrid loss U-Net model
-
摘要: 渤海是我国重要的经济区,海冰灾害严重威胁着人类生产活动。合成孔径雷达具有全天候成像能力,研究渤海区域的SAR图像海冰检测具有重要意义。传统海冰检测方法受限于特征提取方法和建模方式,检测精度有待提升。深度学习具有极强的特征自学习能力,适用于图像检测问题。本文基于深度学习框架U-Net,以Sentinel-1双极化(VV和VH)合成孔径雷达图像为输入信息,设计混合损失函数优化传统U-Net模型,形成了基于混合损失U-Net的渤海海冰检测模型。将本文模型与传统海冰检测方法[脉冲耦合神经网络(PCNN)、马尔科夫随机场(MRF)和分水岭算法]和基于深度卷积神经网络(CNN)的深度学习方法进行了对比。实验结果表明:本文基于混合损失U-Net的海冰检测模型在重叠度、F1分数、精确度和召回率4项度量指标上分别达到了97.567%、98.769%、98.767%和98.771%,检测效果明显优于对比方法;双极化信息输入的检测结果比VV单极化输入的检测结果在F1分数、精确度、召回率和重叠度上分别提高了0.375%、0.111%、0.639%和0.740%;混合损失函数的检测结果比非混合损失函数的检测结果在F1分数、精确度、召回率和重叠度上分别提高了1.129%、0.947%、1.794%和2.231%;模型能对冰水沿线、冰间水道、冰间隙等细节进行有效检测;可应用于渤海区域整幅SAR图像的海冰检测,为海冰监测、海冰变化分析、海冰预报提供技术支撑。Abstract: The Bohai Sea is an important economic zone of China. Sea ice has been a significant threat to the human activities around the Bohai Sea. As the imaging capability of synthetic aperture radar (SAR) is independent of sun illumination and cloud condition, it is of great significance to detect the sea ice of the Bohai Sea from SAR images. Due to the limitation of the feature extraction mechanism, the accuracies of traditional sea ice detection methods need to be improved. Deep learning has a strong self-learning ability and is suitable for image detection. Here, we employ the well-known deep learning framework, U-Net, as the basic structure, and design a hybrid loss function to optimize the U-Net model, forming a hybrid loss U-Net model for sea ice detection in the Bohai Sea. The Sentinel-1 dual-polarization (VV and VH) SAR images are the inputs of the model. We compare the hybrid loss U-Net model with several traditional methods (Pulse Coupled Neural Network, Markov Random Field and Watershed Algorithm) and deep learning method based on CNN. Experiments show that the hybrid loss U-Net-based model achieves 97.567%, 98.769%, 98.767% and 98.771% in IoU, F1_Score, Precision and Recall respectively, outperforming the other methods. Compared with VV single-polarized input, the detection results of dual-polarized information input are 0.375%, 0.111%, 0.639% and 0.740% higher in F1_Score, Precision, Recall and IoU respectively. The detection results of the hybrid loss model are 1.129%, 0.947%, 1.794% and 2.231% higher than those of the non-hybrid loss function in F1_Score, Precision, Recall and IoU respectively. The model could effectively detect details such as ice water line, inter-ice water and ice gap. Our model is applied to detect the sea ice of a whole SAR image in the Bohai Sea, which can provide technical supports for sea ice monitoring, sea ice change analysis and sea ice prediction.
-
Key words:
- synthetic aperture radar images /
- sea ice detection /
- deep learning /
- U-Net /
- a hybrid loss function
-
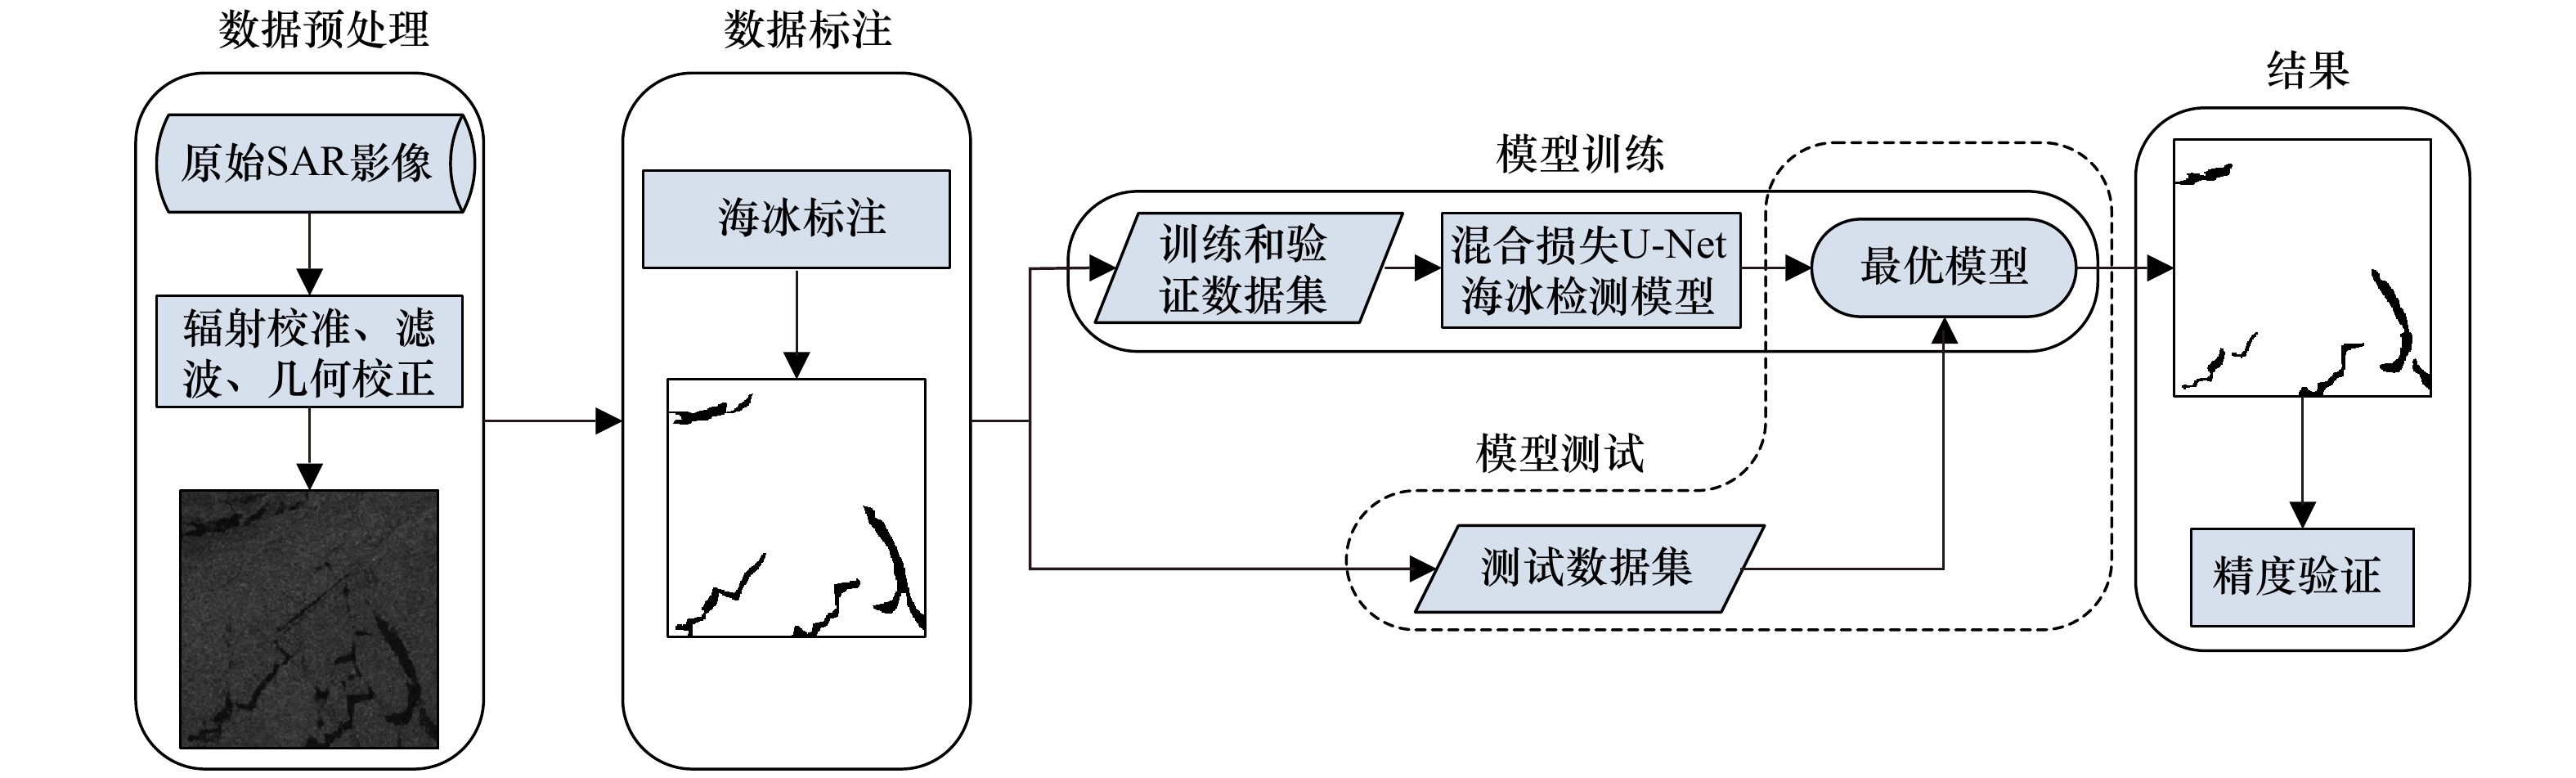
图 4 基于混合损失U-Net的海冰检测模型流程图
Fig. 4 Flow chart of sea ice detection model based on a hybrid loss U-Net model
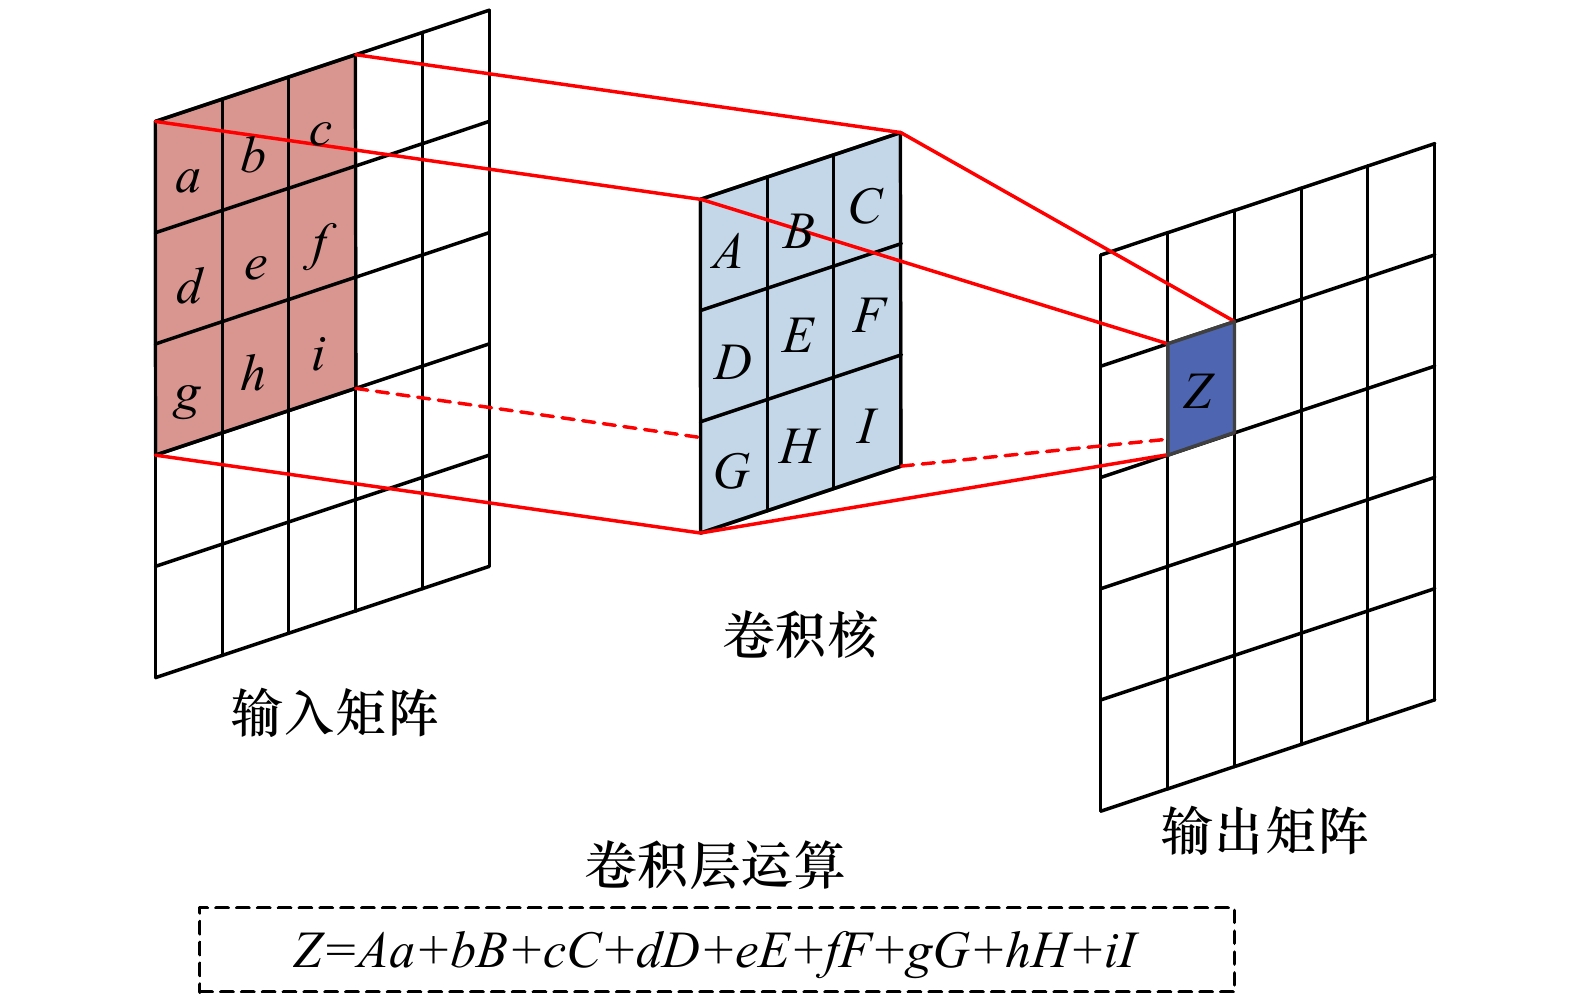
图 5 卷积运算示例
输入矩阵为5×5,卷积核为3×3,则该卷积层共有9个参数,此9个参数被整个隐藏层共享,则输出矩阵中Z的计算如图5所示
Fig. 5 An example of convolution operation
The input matrix is 5×5, the convolutional kernel is 3×3, the convolutional layer has 9 parameters, which are shared by the whole hidden layer. The calculation of Z in the output matrix is shown in Fig.5
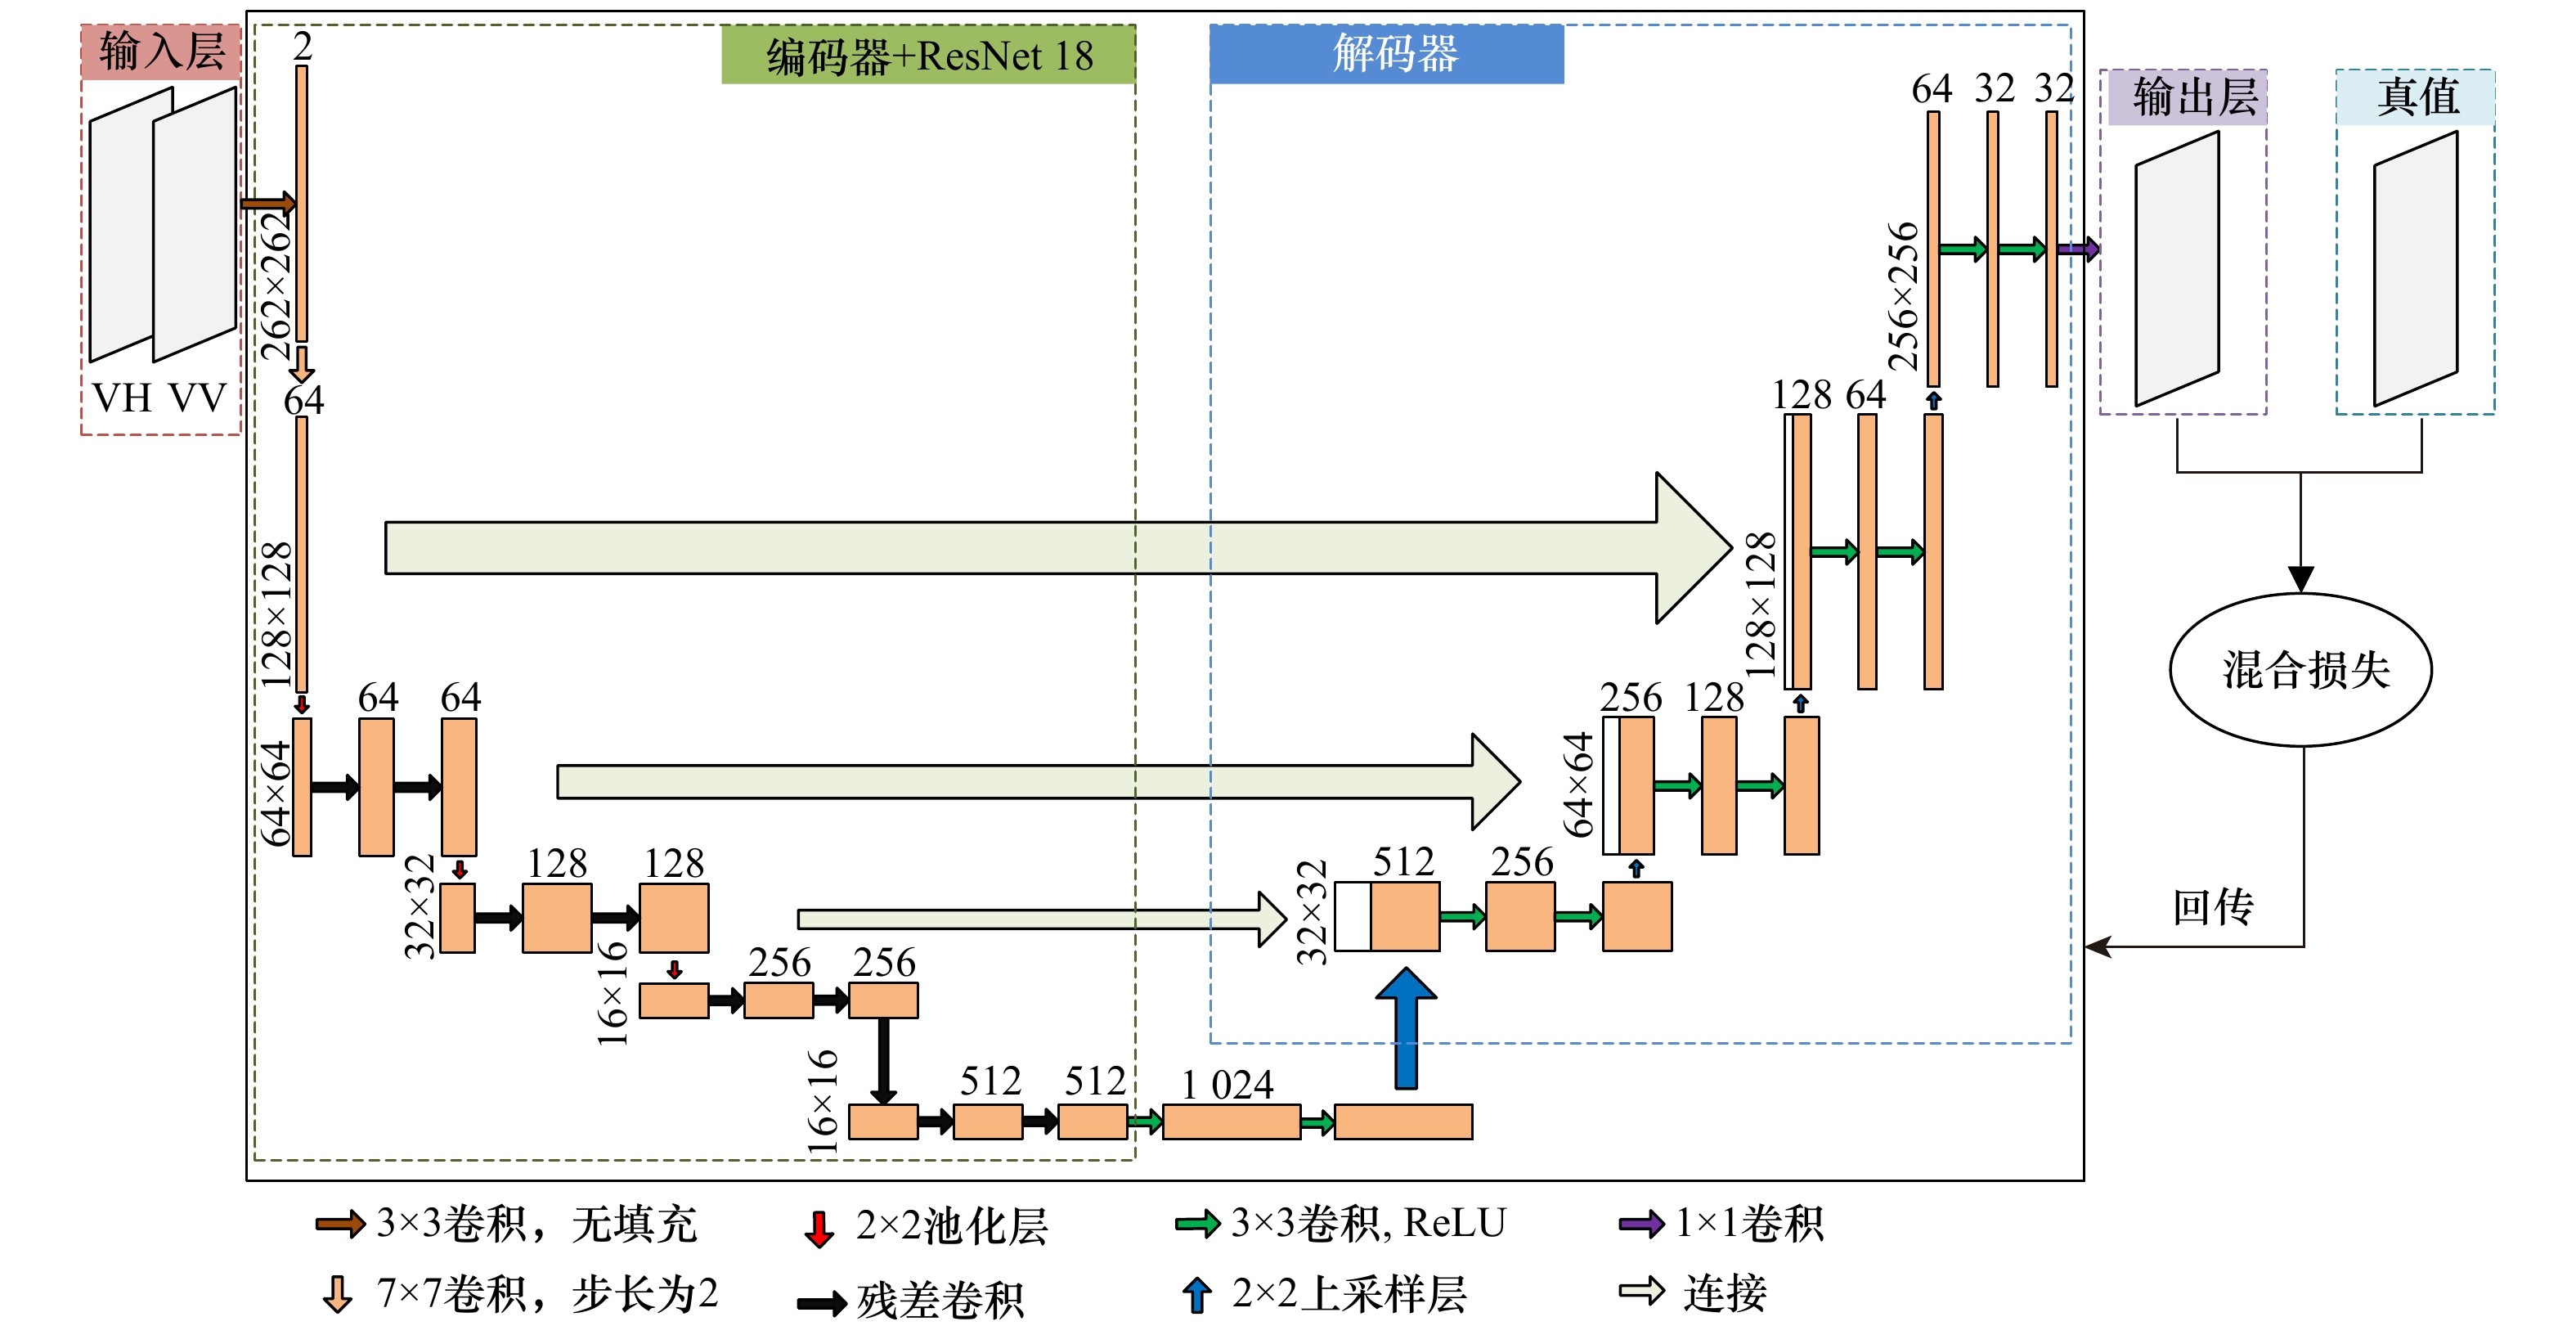
图 6 基于混合损失U-Net的海冰检测模型网络架构
Fig. 6 Network architecture of sea ice detection model based on a hybrid loss U-Net model
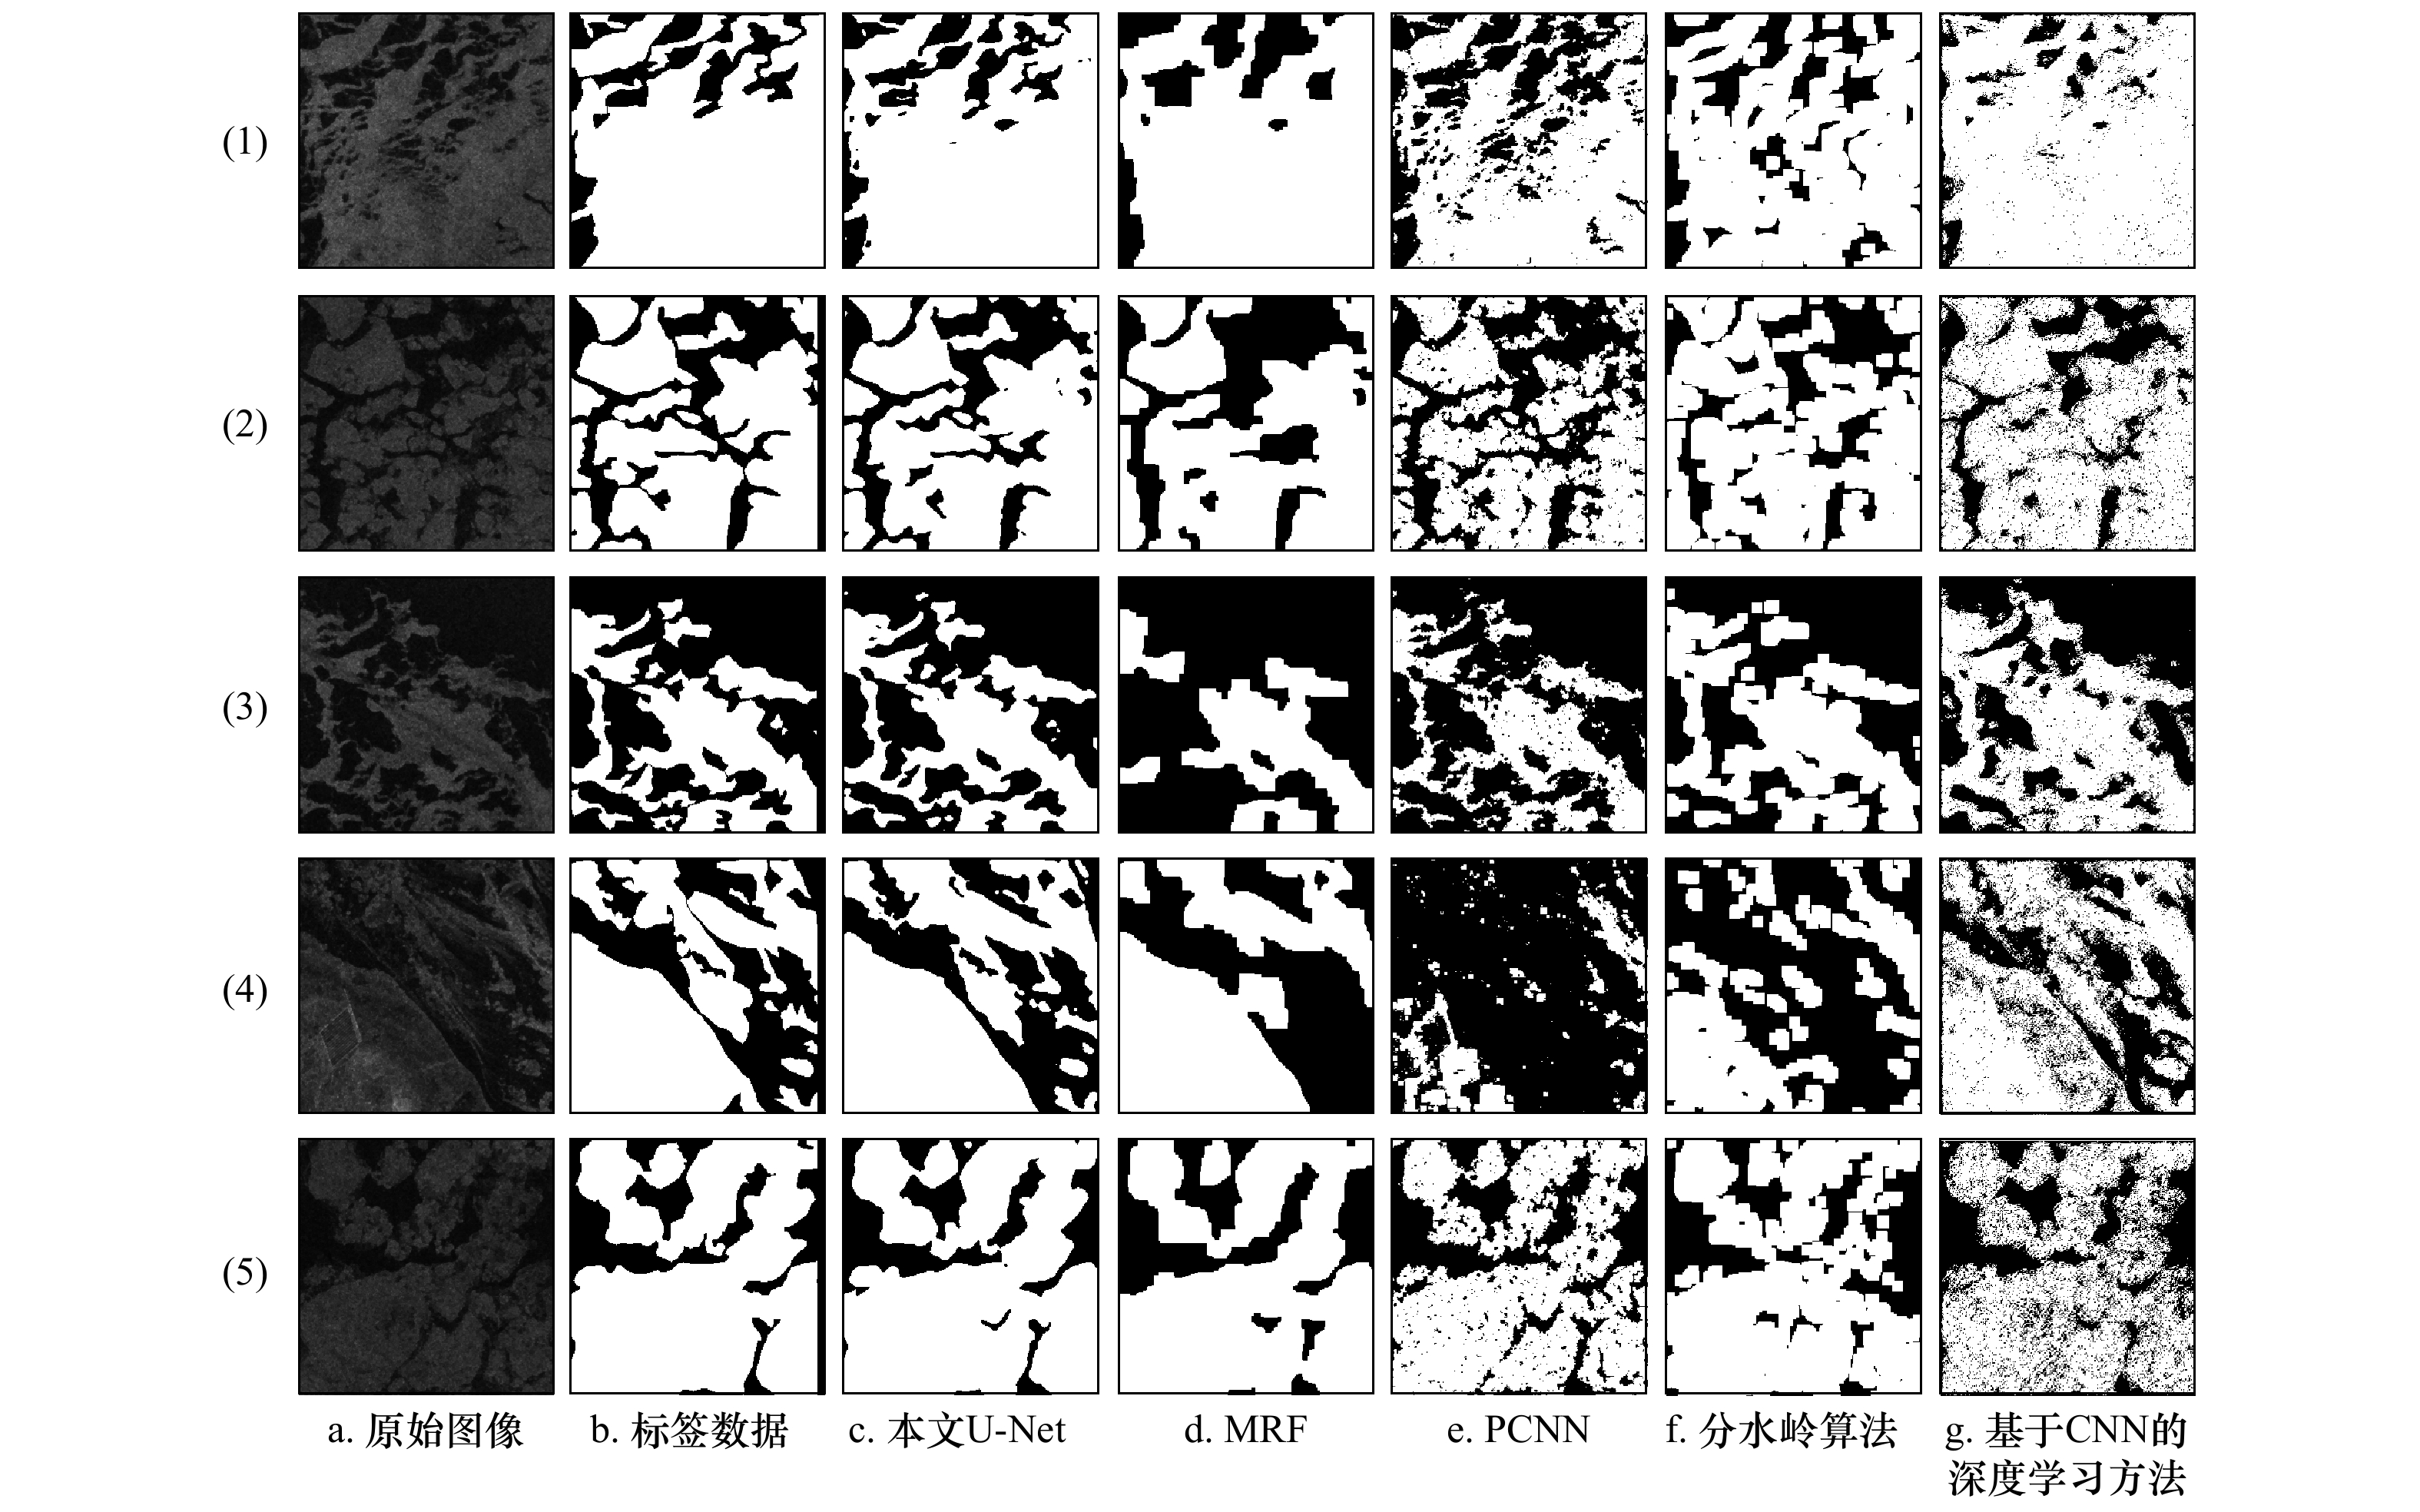
图 7 不同模型对海冰测试集的预测结果
1~5中每行表示一个测试样本,每行从a-g分别表示样本的原始SAR图像切片、标签数据、本文U-Net预测结果、MRF预测结果、PCNN预测结果、分水岭算法预测结果和基于CNN的深度学习方法预测结果,白色为海冰,黑色为背景
Fig. 7 Prediction results of different models for sea ice test sets
In 1-5, each row represents a testing sample, a-g of each row are the original SAR image slice, the label data, prediction result of U-Net, prediction result of MRF, prediction result of PCNN, prediction result of WA, and prediction result of deep learning method based on CNN; white pixels are sea ice and black pixels are water
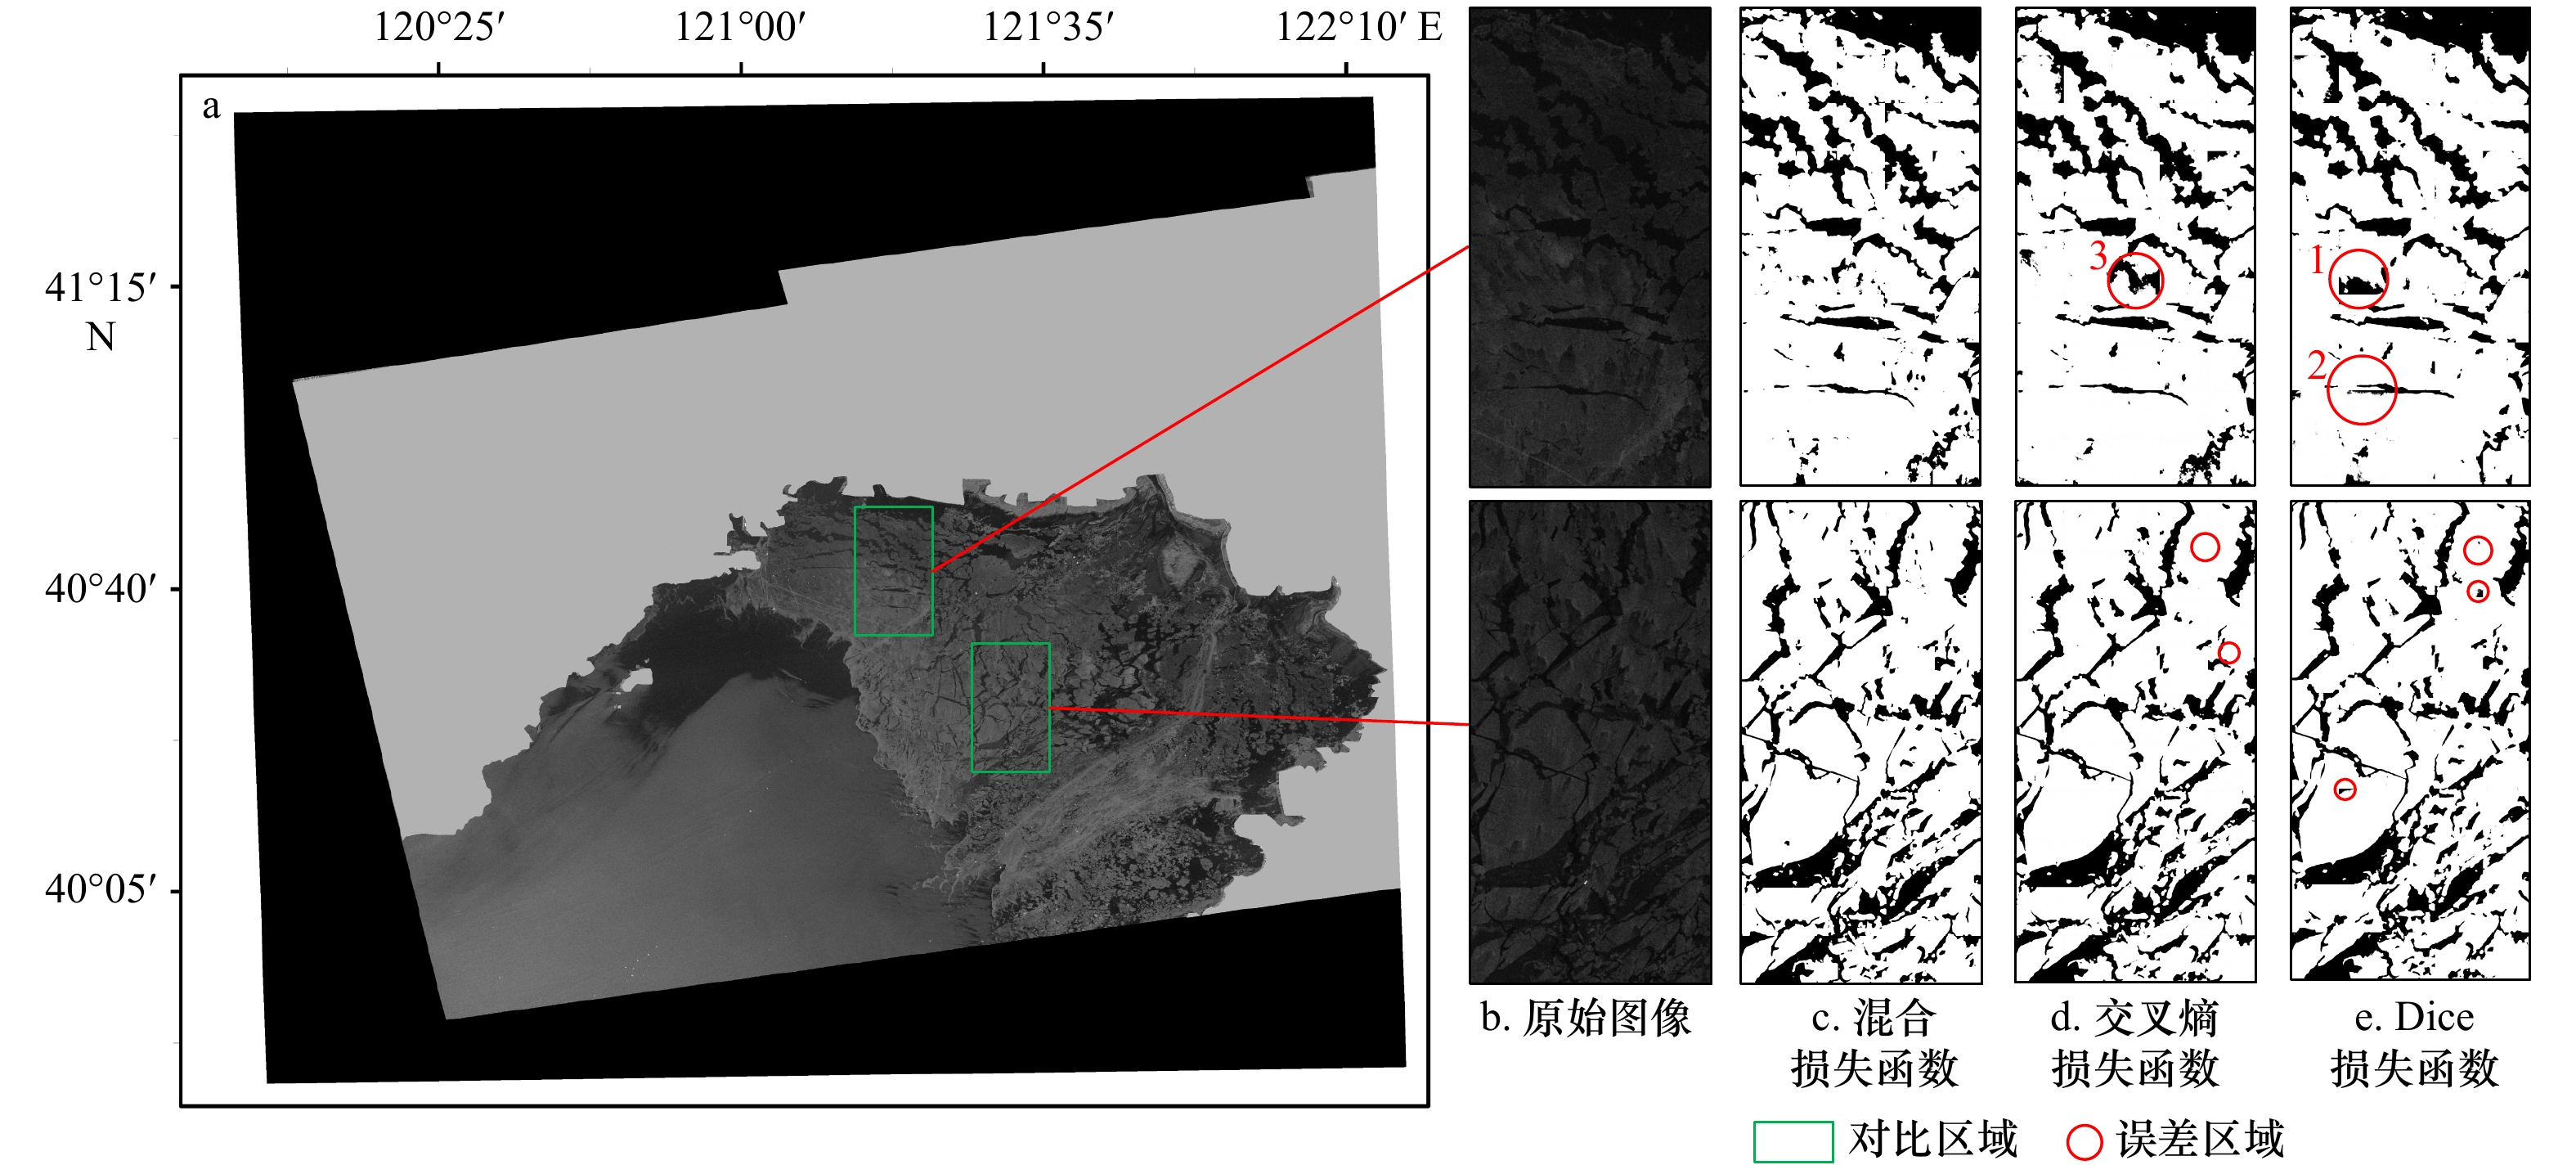
图 8 不同损失函数的海冰检测结果对比
影像成像日期为2020年2月19日;中心点坐标为40.718 3°N,121.722 8°E;d中误差区域3在e中能被正确检测,最后在c中能被正确检测,同理可见误差区域1和2
Fig. 8 Comparisons of sea ice detection results with different loss functions
The imaging date is February 19, 2020; the coordinates of the central point are 40.718 3°N, 121.722 8°E; the error area 3 in d can be correctly detected in e, and finally correctly detected in c, so are the error area 1 and 2
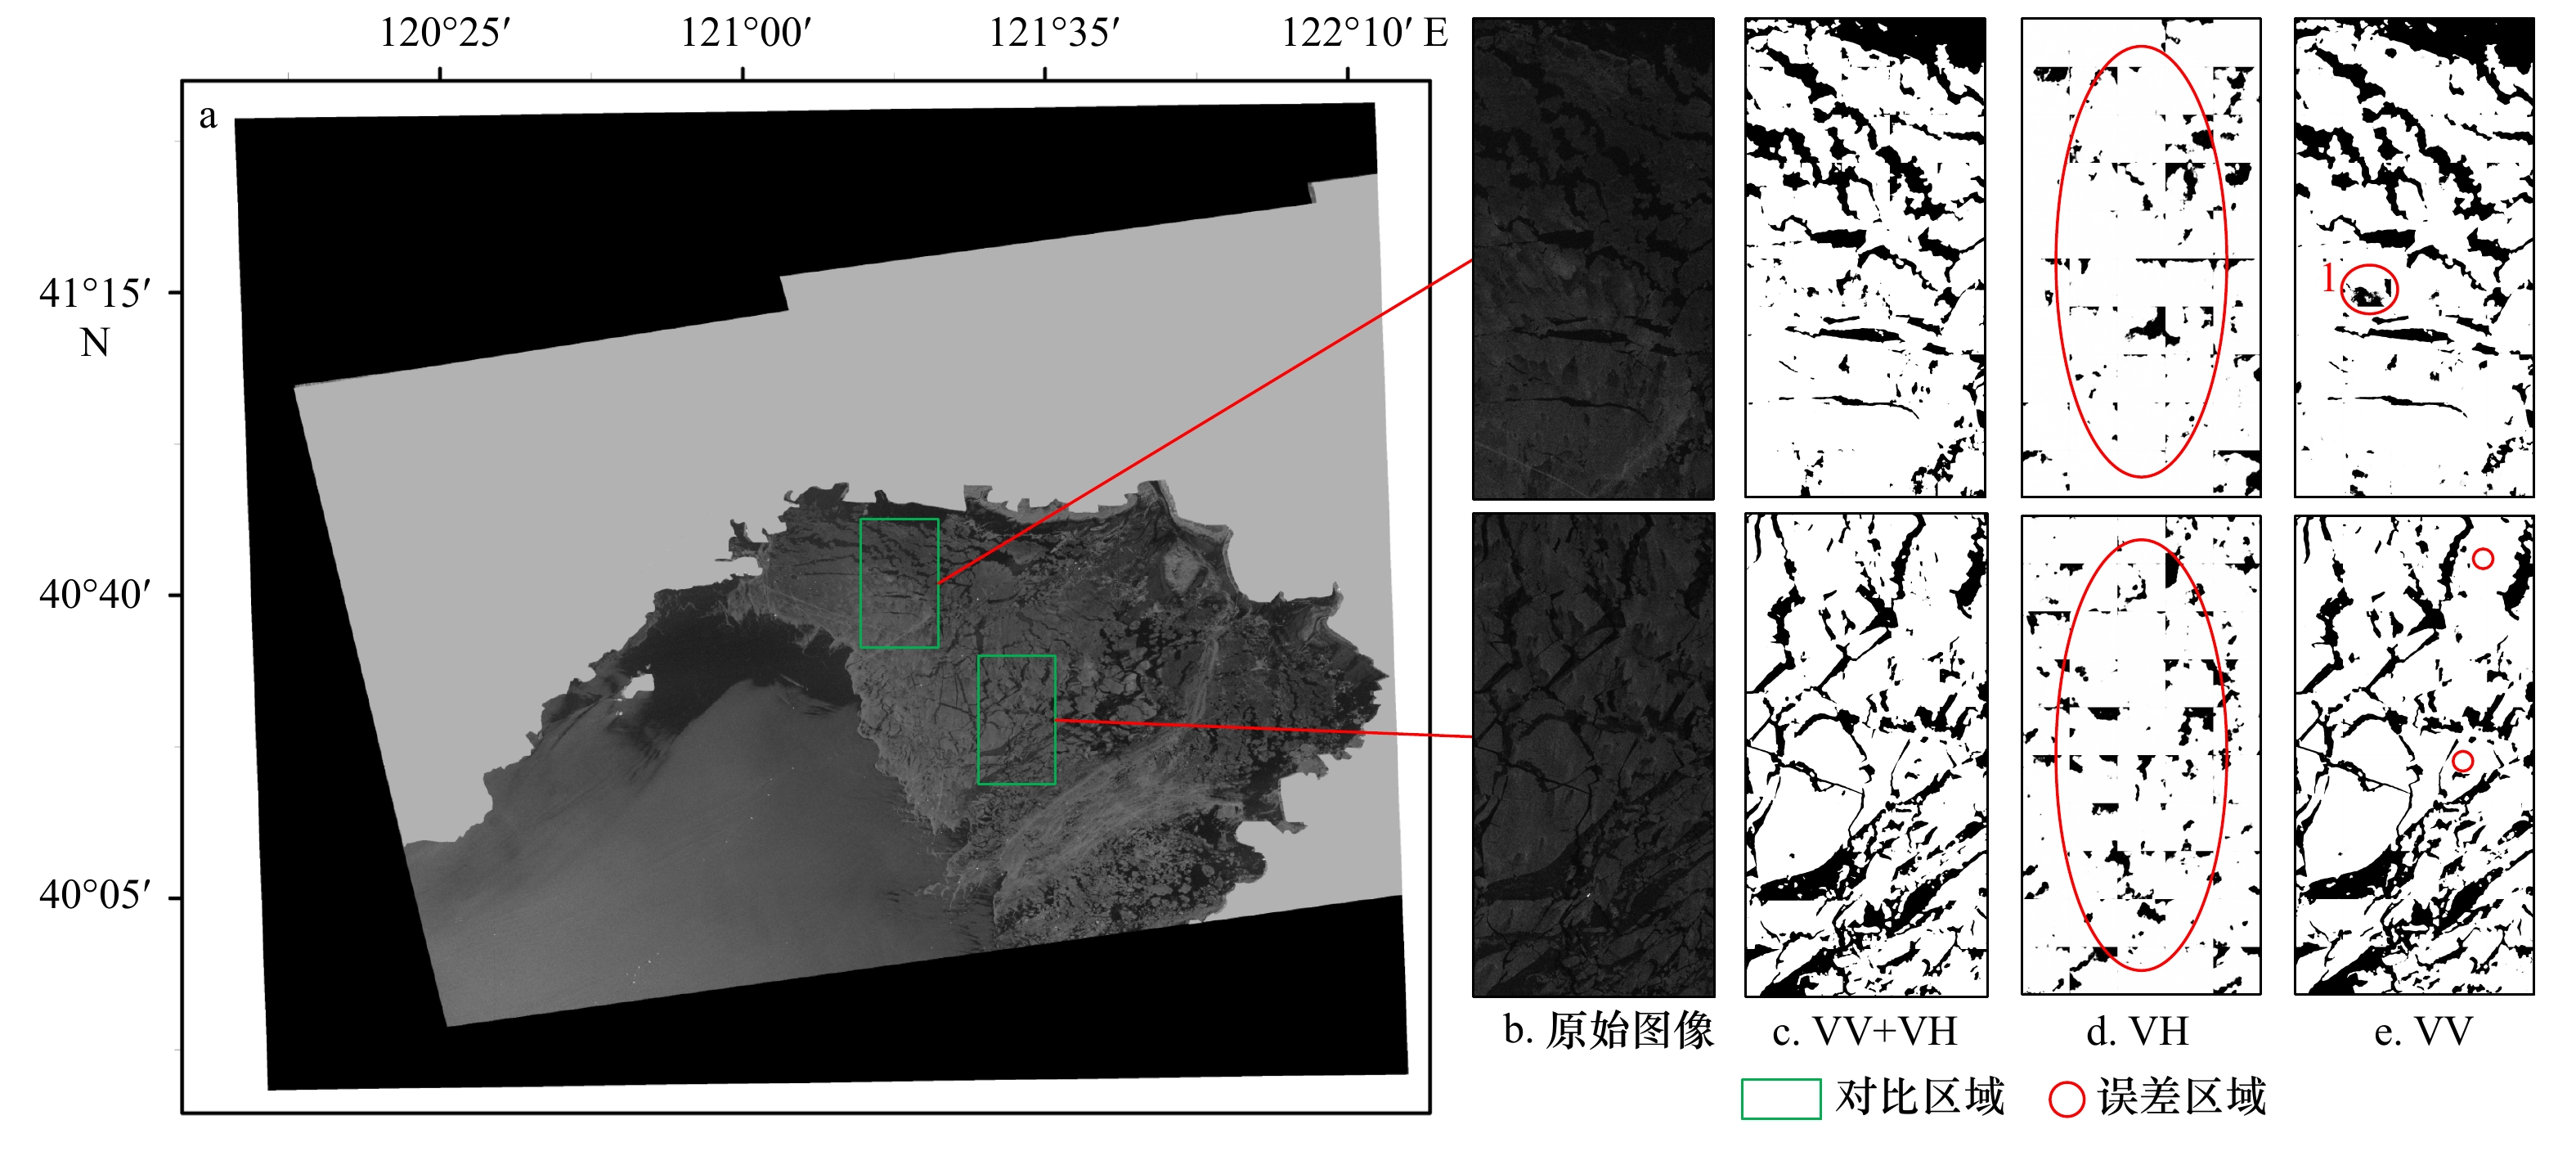
图 9 不同极化信息海冰检测结果对比
影像成像日期为2020年2月19日;中心点坐标为40.718 3°N,121.722 8°E;e中误差区域1在d中能被正确检测,最终在c中能被正确检测
Fig. 9 Comparisons of sea ice detection results with different polarization information
The imaging date is February 19, 2020; the coordinates of the central point are 40.718 3°N, 121.722 8°E; the error area 1 in e can be correctly detected in d, finally correctly detected in c
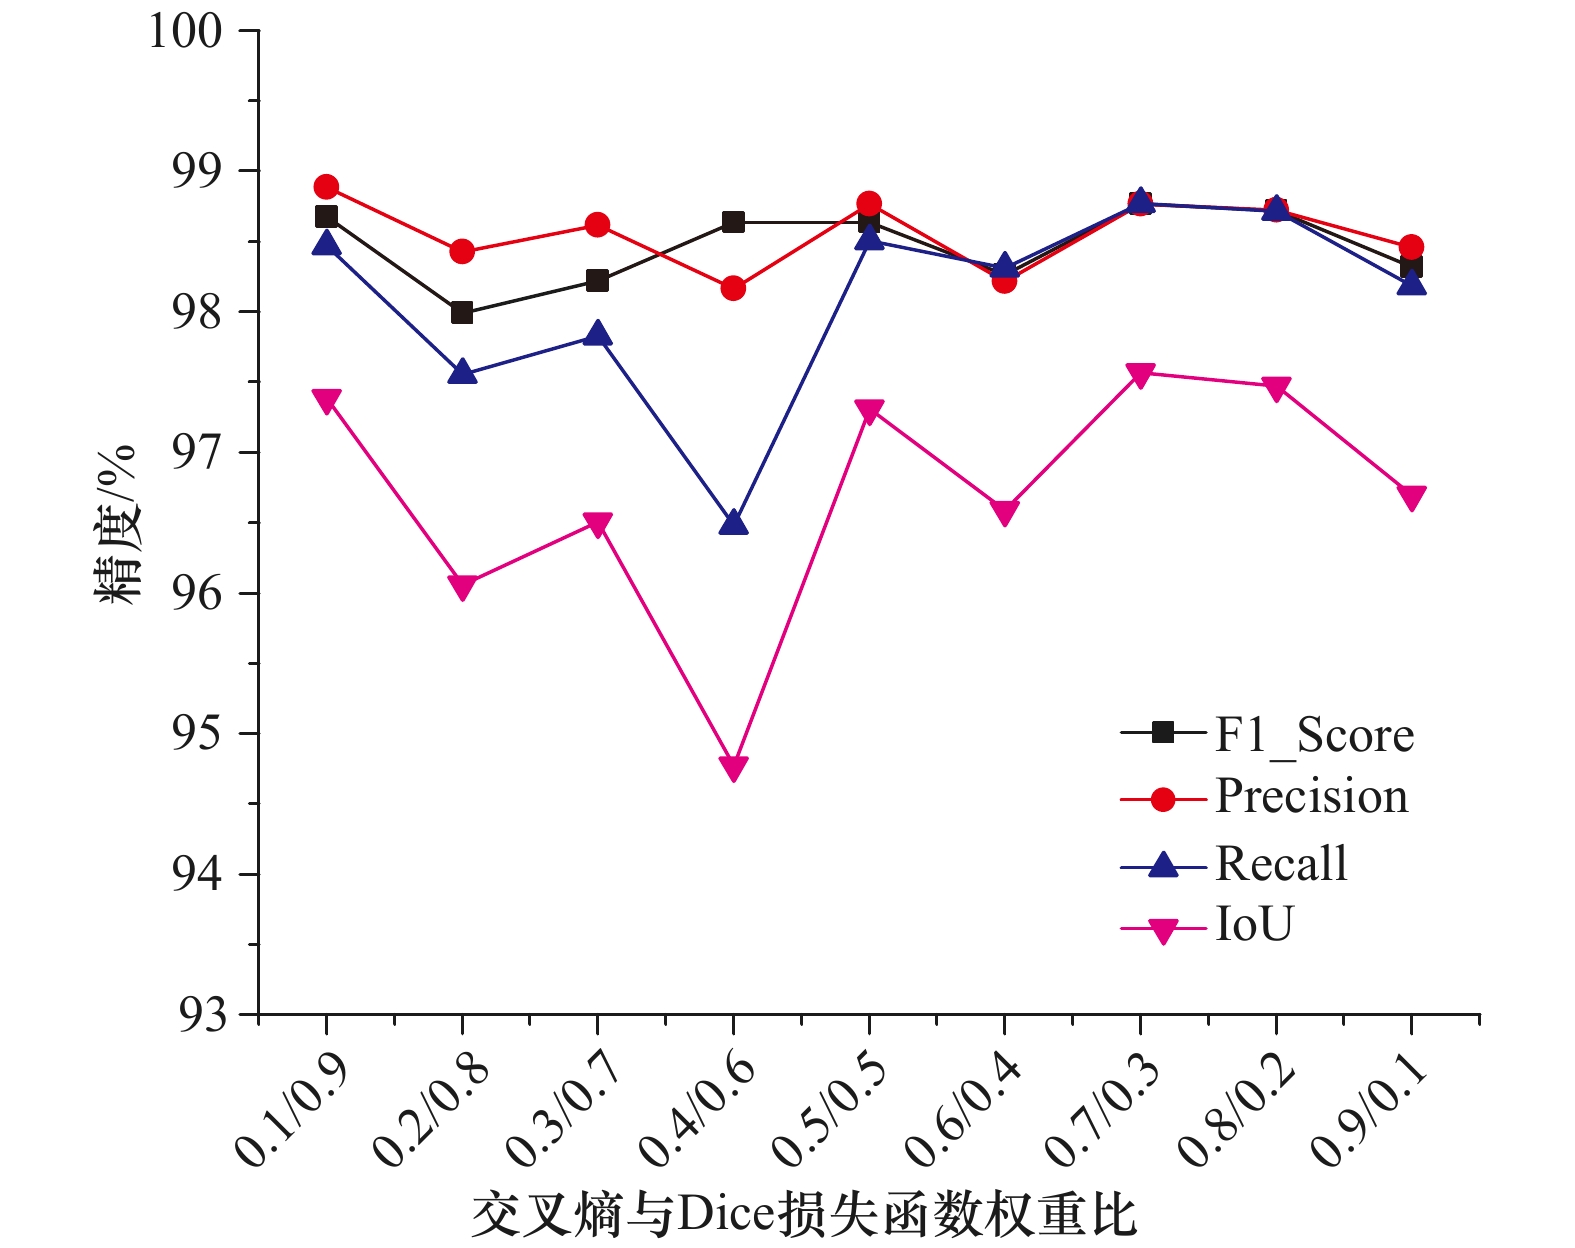
图 10 混合损失函数不同权重比实验结果
Fig. 10 Experimental results of hybrid loss functions with different weight ratios
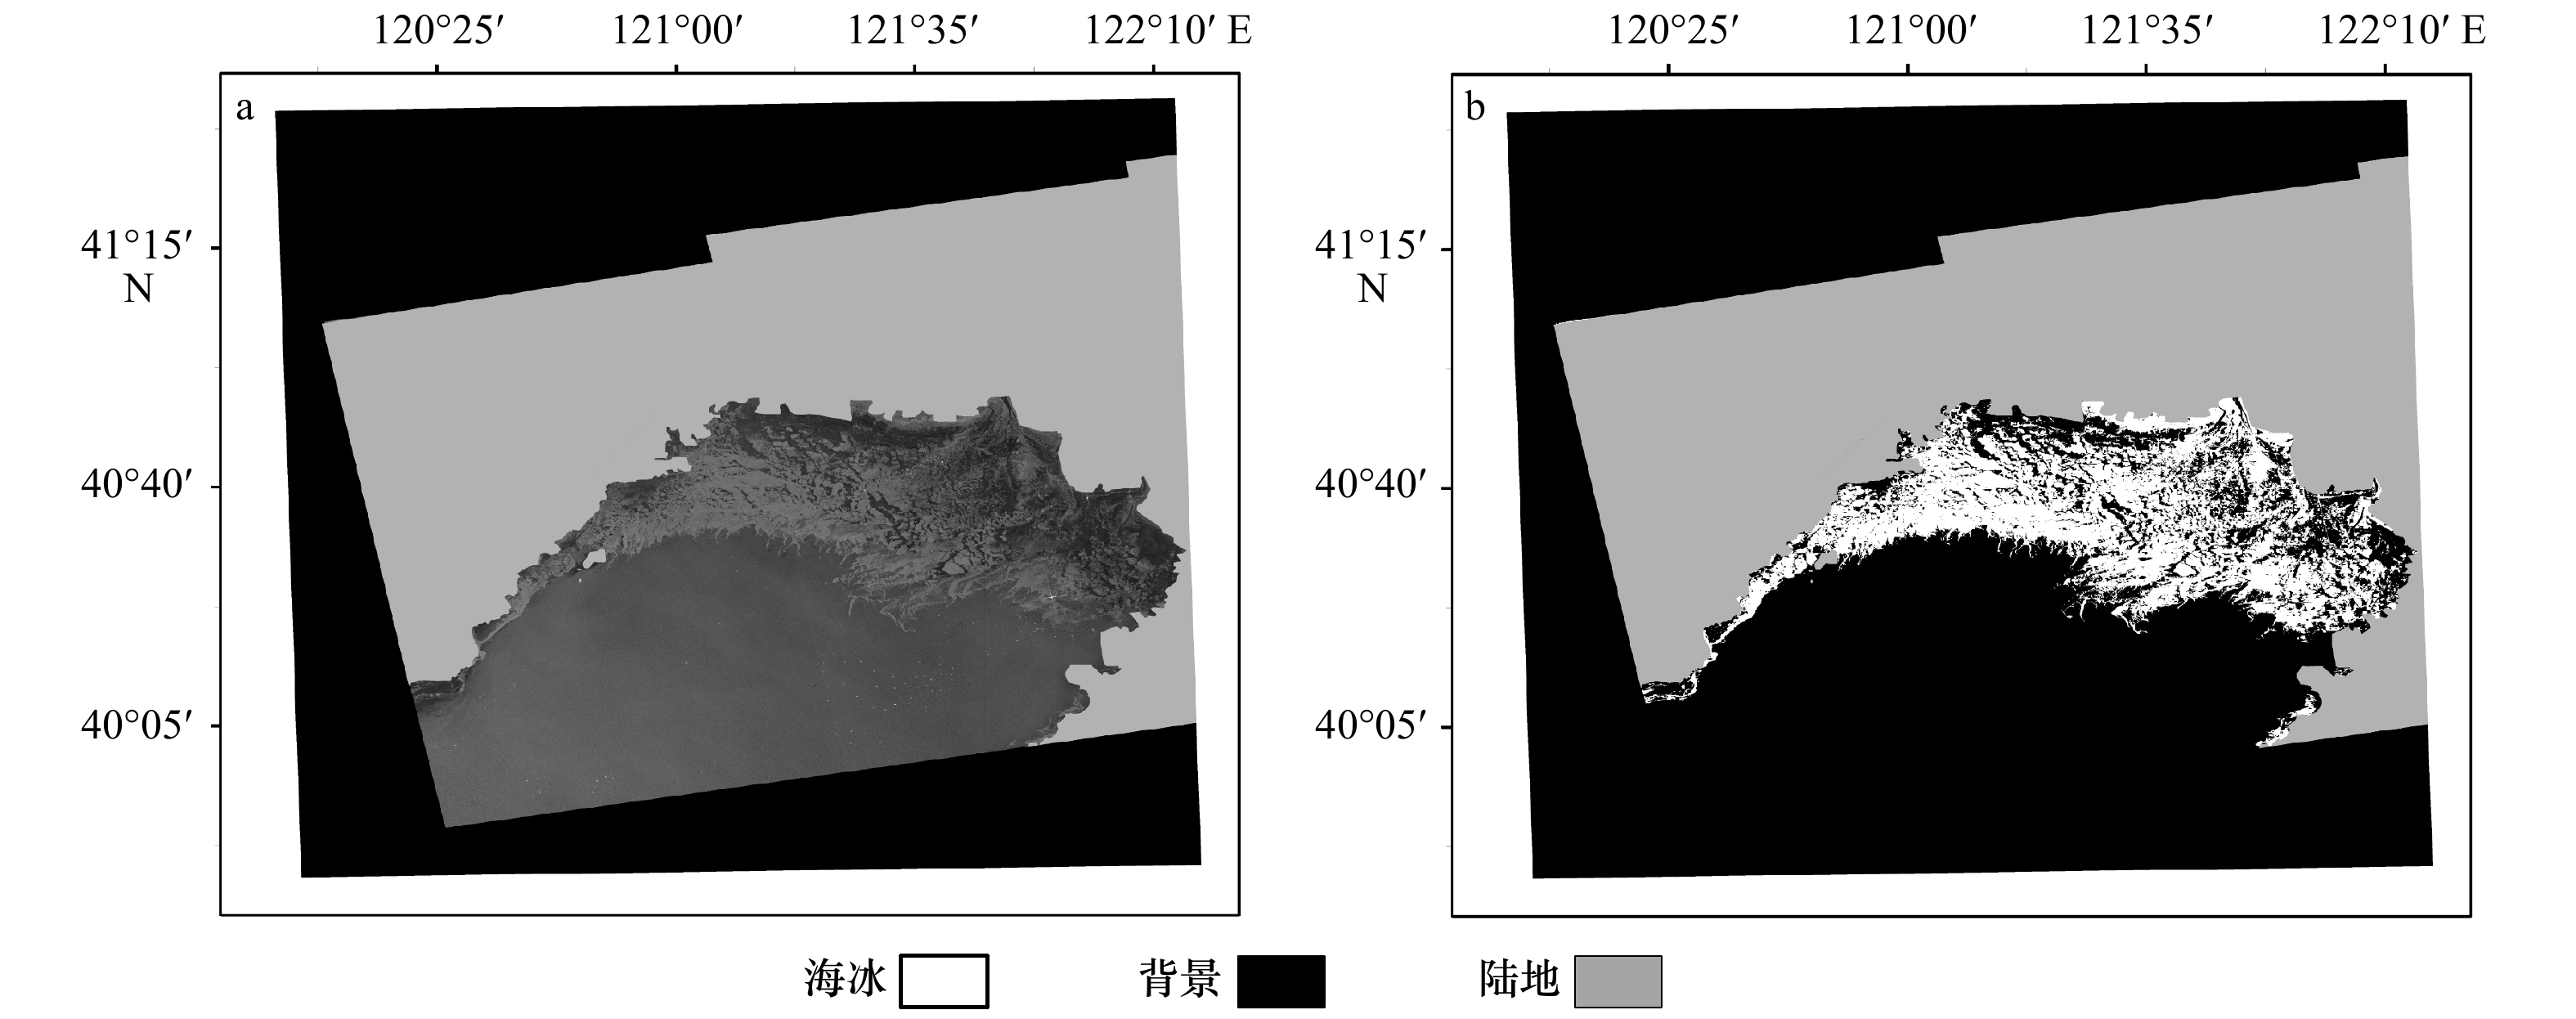
图 11 整幅SAR图像海冰检测结果
影像成像日期为2020年1月2日;中心点坐标为40.718 7°N,121.724 5°E;a是原始SAR影像;b是模型检测的海冰
Fig. 11 The sea ice detection results of the whole SAR image
The imaging date is January 2, 2020; the coordinates of the central point are 40.718 7°N, 121.724 5°E; a is the original SAR image; b is the sea ice detected by the model
表 1 SAR图像的详细信息
Tab. 1 Details of SAR images
图像集 成像时间 图像中心点坐标 极化方式 卫星 1 2016年1月28日21:55:43 40.4302°N,122.2560°E VH+VV A星 2 2017年1月9日22:03:22 40.3455°N,120.1869°E VH+VV B星 3 2017年1月21日22:03:21 40.3455°N,120.1881°E VH+VV B星 4 2017年2月2日22:03:21 40.3456°N,120.1881°E VH+VV B星 5 2017年2月9日21:55:17 39.7809°N,122.0780°E VH+VV B星 6 2018年1月24日09:49:07 40.7188°N,121.7244°E VH+VV A星 7 2019年1月19日09:49:14 40.7188°N,121.7254°E VH+VV A星 8 2020年1月2日09:49:21 40.7187°N,121.7245°E VH+VV A星 9 2020年2月7日09:49:20 40.7185°N,121.7233°E VH+VV A星 10 2020年2月19日09:49:19 40.7183°N,121.7228°E VH+VV A星  下载: 导出CSV
表 2 不同模型的度量结果
Tab. 2 Measurement results of different models
方法 度量标准 F1分数/% 精确度/% 召回率/% 重叠度/% PCNN 89.077 86.189 92.332 81.929 MRF 89.455 86.754 93.405 84.034 分水岭算法 88.977 85.733 92.476 80.142 CNN 91.333 89.060 93.726 84.049 本文U-Net 98.769 98.767 98.771 97.567
下载: 导出CSV
表 3 不同损失函数的度量结果
Tab. 3 Measurement results of different loss functions
模型 度量标准 F1分数/% 精确度/% 召回率/% 重叠度/% U-NetBCE 97.666 98.310 97.030 95.438 U-NetDice 97.875 97.840 97.910 95.839 U-NetBCED 98.769 98.767 98.771 97.567
下载: 导出CSV
表 4 不同极化方式的度量结果
Tab. 4 Measurement results of different polarization information
模型输入 度量标准 F1分数/% 精确度/% 召回率/% 重叠度/% VH 93.240 93.240 96.061 89.806 VV 98.400 98.657 98.144 96.850 VV+VH 98.769 98.767 98.771 97.567
下载: 导出CSV
-
[1] Mori M, Kosaka Y, Watanabe M, et al. A reconciled estimate of the influence of Arctic sea-ice loss on recent Eurasian cooling[J]. Nature Climate Change, 2019, 9(2): 123−129. doi: 10.1038/s41558-018-0379-3 [2] Olonscheck D, Mauritsen T, Notz D. Arctic sea-ice variability is primarily driven by atmospheric temperature fluctuations[J]. Nature Geoscience, 2019, 12(6): 430−434. doi: 10.1038/s41561-019-0363-1 [3] 自然资源部. 中国海洋灾害公报[R]. 北京: 自然资源部, 2010−2019.Ministry of Natural Resources. China’s maritime disaster communique[R]. Beijing: Ministry of Natural Resources, 2010−2019. [4] Soh L K, Tsatsoulis C. Texture analysis of SAR sea ice imagery using gray level co-occurrence matrices[J]. IEEE Transactions on Geoscience and Remote Sensing, 1999, 37(2): 780−795. doi: 10.1109/36.752194 [5] 王利亚, 何宜军, 张彪, 等. HY-2卫星扫描微波辐射计数据反演北极海冰漂移速度[J]. 海洋学报, 2017, 39(9): 110−120.Wang Liya, He Yijun, Zhang Biao, et al. Retrieval of Arctic sea ice drift using HY-2 Satellite scanning microwave radiometer data[J]. Haiyang Xuebao, 2017, 39(9): 110−120. [6] Dabboor M, Geldsetzer T. Towards sea ice classification using simulated RADARSAT constellation mission compact polarimetric SAR imagery[J]. Remote Sensing of Environment, 2014, 140: 189−195. doi: 10.1016/j.rse.2013.08.035 [7] Fetterer F, Bertoia C, Ye Jingping. Multi-year ice concentration from RADARSAT[C]//IGARSS’97.1997 IEEE International Geoscience and Remote Sensing Symposium Proceedings. Remote Sensing—A Scientific Vision for Sustainable Development. Singapore: IEEE, 1997, 1: 402−404. [8] Su Hua, Wang Yunpeng, Xiao Jie, et al. Improving MODIS sea ice detectability using gray level co-occurrence matrix texture analysis method: A case study in the Bohai Sea[J]. ISPRS Journal of Photogrammetry and Remote Sensing, 2013, 85: 13−20. doi: 10.1016/j.isprsjprs.2013.07.010 [9] Zakhvatkina N Y, Alexandrov V Y, Johannessen O M, et al. Classification of sea ice types in ENVISAT synthetic aperture radar images[J]. IEEE Transactions on Geoscience and Remote Sensing, 2012, 51(5): 2587−2600. [10] 李小娜, 张杰, 戴永寿, 等. 灰度共生矩阵纹理特征对SAR海冰漂移监测的增强性能研究[J]. 海洋科学, 2018, 42(4): 9−17.Li Xiaona, Zhang Jie, Dai Yongshou, et al. Research on the enhanced performance of texture feature for sea ice drift monitoring based on gray level co-occurrence matrices[J]. Marine Sciences, 2018, 42(4): 9−17. [11] Soh L K, Tsatsoulis C, Gineris D, et al. ARKTOS: An intelligent system for SAR sea ice image classification[J]. IEEE Transactions on Geoscience and Remote Sensing, 2004, 42(1): 229−248. doi: 10.1109/TGRS.2003.817819 [12] Ochilov S, Clausi D A. Operational SAR sea-ice image classification[J]. IEEE Transactions on Geoscience and Remote Sensing, 2012, 50(11): 4397−4408. doi: 10.1109/TGRS.2012.2192278 [13] 郑敏薇, 李晓明, 任永政. 高分3号星载合成孔径雷达极地海冰自动检测方法研究[J]. 海洋学报, 2018, 40(9): 113−124.Zheng Minwei, Li Xiaoming, Ren Yongzheng. The method study on automatic sea ice detection with GaoFen-3 synthetic aperture radar data in polar regions[J]. Haiyang Xuebao, 2018, 40(9): 113−124. [14] 张明, 吕晓琪, 张晓峰, 等. 结合纹理特征的SVM海冰分类方法研究[J]. 海洋学报, 2018, 40(11): 149−156.Zhang Ming, Lü Xiaoqi, Zhang Xiaofeng, et al. Research on SVM sea ice classification based on texture features[J]. Haiyang Xuebao, 2018, 40(11): 149−156. [15] 李晓明, 张强. 星载合成孔径雷达北极海冰覆盖观测[J]. 海洋学报, 2019, 41(4): 145−146.Li Xiaoming, Zhang Qiang. Observation of Arctic sea ice cover by spaceborne synthetic aperture radar[J]. Haiyang Xuebao, 2019, 41(4): 145−146. [16] Leigh S, Wang Zhijie, Clausi D A. Automated ice–water classification using dual polarization SAR satellite imagery[J]. IEEE Transactions on Geoscience and Remote Sensing, 2013, 52(9): 5529−5539. [17] Karvonen J A. Baltic sea ice SAR segmentation and classification using modified pulse-coupled neural networks[J]. IEEE Transactions on Geoscience and Remote Sensing, 2004, 42(7): 1566−1574. doi: 10.1109/TGRS.2004.828179 [18] Wang Chao, Zhang Hong, Wang Yuanyuan, et al. Sea ice classification with convolutional neural networks using sentinel-L ScanSAR images[C]//IGARSS 2018−2018 IEEE International Geoscience and Remote Sensing Symposium. Valencia, Spain: IEEE, 2018: 7125−7128. [19] Li Xiaofeng, Liu Bin, Zheng Gang, et al. Deep-learning-based information mining from ocean remote-sensing imagery[J]. National Science Review, 2020, 7(10): 1584−1605. doi: 10.1093/nsr/nwaa047 [20] LeCun Y, Bengio Y, Hinton G. Deep learning[J]. Nature, 2015, 521(7553): 436−444. doi: 10.1038/nature14539 [21] Krizhevsky A, Sutskever I, Hinton G E. ImageNet classification with deep convolutional neural networks[C]//Proceedings of the 25th International Conference on Neural Information Processing Systems. Red Hook, NY, United States: Curran Associates Inc., 2012: 1097−1105. [22] Simonyan K, Zisserman A. Very deep convolutional networks for large-scale image recognition[C]. San Diego, CA: International Conference on Learning Representations, 2015. [23] He Kaiming, Zhang Xiangyu, Ren Shaoqing, et al. Deep residual learning for image recognition[C]//Proceedings of the IEEE Conference on Computer Vision and Pattern Recognition. Las Vegas, NV, USA: IEEE, 2016: 770−778. [24] Ren Yibin, Chen Huanfa, Han Yong, et al. A hybrid integrated deep learning model for the prediction of citywide spatio-temporal flow volumes[J]. International Journal of Geographical Information Science, 2020, 34(4): 802−823. doi: 10.1080/13658816.2019.1652303 [25] Zhang Xudong, Li Xiaofeng. Combination of satellite observations and machine learning method for internal wave forecast in the Sulu and Celebes seas[J]. IEEE Transactions on Geoscience and Remote Sensing, 2020: 1−11. [26] Zheng Gang, Li Xiaofeng, Zhang Ronghua, et al. Purely satellite data–driven deep learning forecast of complicated tropical instability waves[J]. Science Advances, 2020, 6(29): eaba1482. doi: 10.1126/sciadv.aba1482 [27] Li Jinxin, Wang Chao, Wang Shigang, et al. Gaofen-3 sea ice detection based on deep learning[C]//2017 Progress in Electromagnetics Research Symposium-Fall (PIERS-FALL). Singapore, Singapore: IEEE, 2017: 933−939. [28] Xu Yan, Scott K A. Sea ice and open water classification of SAR imagery using CNN-based transfer learning[C]//2017 IEEE International Geoscience and Remote Sensing Symposium (IGARSS). Fort Worth, TX, USA: IEEE, 2017: 3262−3265. [29] 黄冬梅, 李明慧, 宋巍, 等. 卷积神经网络和深度置信网络在SAR影像冰水分类的性能评估[J]. 中国图象图形学报, 2018, 23(11): 1720−1732.Huang Dongmei, Li Minghui, Song Wei, et al. Performance of convolutional neural network and deep belief network in sea ice-water classification using SAR imagery[J]. Journal of Image and Graphics, 2018, 23(11): 1720−1732. [30] Dierking W. Mapping of different sea ice regimes using images from Sentinel-1 and ALOS Synthetic Aperture Radar[J]. IEEE Transactions on Geoscience and Remote Sensing, 2009, 48(3): 1045−1058. [31] Geldsetzer T, Yackel J J. Sea ice type and open water discrimination using dual co-polarized C-band SAR[J]. Canadian Journal of Remote Sensing, 2009, 35(1): 73−84. doi: 10.5589/m08-075 [32] Fabijańska A. Segmentation of corneal endothelium images using a U-Net-based convolutional neural network[J]. Artificial Intelligence in Medicine, 2018, 88: 1−13. doi: 10.1016/j.artmed.2018.04.004 [33] Lian Sheng, Luo Zhiming, Zhong Zhun, et al. Attention guided U-Net for accurate iris segmentation[J]. Journal of Visual Communication and Image Representation, 2018, 56: 296−304. doi: 10.1016/j.jvcir.2018.10.001 [34] Liu Bin, Li Xiaofeng, Zheng Gang. Coastal inundation mapping from bitemporal and dual-polarization SAR imagery based on deep convolutional neural networks[J]. Journal of Geophysical Research: Oceans, 2019, 124(12): 9101−9113. doi: 10.1029/2019JC015577 [35] Shen Dongliang, Liu Bin, Li Xiaofeng. Sea surface wind retrieval from synthetic aperture radar data by deep convolutional neural networks[C]//IGARSS 2019−2019 IEEE International Geoscience and Remote Sensing Symposium. Japan, Yokohama, IEEE, 2019: 8035−8038. [36] Foumelis M. ESA sentinel-1 toolbox generation of SAR backscattering mosaics[DB/OL].[2020-06-28]. http://step.esa.int/main/doc/tutorials/. 2015. [37] Russell B C, Torralba A, Murphy K P, et al. LabelMe: a database and web-based tool for image annotation[J]. International Journal of Computer Vision, 2008, 77(1/3): 157−173. [38] Ronneberger O, Fischer P, Brox T. U-net: Convolutional networks for biomedical image segmentation[C]//International Conference on Medical Image Computing and Computer-Assisted Intervention. Munich, Germany: Springer, 2015: 234−241. [39] Deepan P, Sudha L R. Object classification of remote sensing image using deep convolutional neural network[M]//Peter D, Alavi A H, Javadi B, et al. The Cognitive Approach in Cloud Computing and Internet of Things Technologies for Surveillance Tracking Systems. London: Academic Press, 2020: 107−120. [40] Wang Mingchang, Zhang Xinyue, Niu Xuefeng, et al. Scene classification of high-resolution remotely sensed image based on ResNet[J]. Journal of Geovisualization and Spatial Analysis, 2019, 3(2): 16. doi: 10.1007/s41651-019-0039-9 [41] Gao Ligang, Chen Paiyu, Yu Shimeng. Demonstration of convolution kernel operation on resistive cross-point array[J]. IEEE Electron Device Letters, 2016, 37(7): 870−873. doi: 10.1109/LED.2016.2573140 [42] 袁非牛, 章琳, 史劲亭, 等. 自编码神经网络理论及应用综述[J]. 计算机学报, 2019, 42(1): 203−230.Yuan Feiniu, Zhang Lin, Shi Jinting, et al. Theories and applications of auto-encoder neural networks: a literature survey[J]. Chinese Journal of Computers, 2019, 42(1): 203−230. [43] Kingma D, Ba J. Adam: A method for stochastic optimization[C]. San Diego, CA: International Conference on Learning Representations, 2015. -


计量
- 文章访问数: 1325
- HTML全文浏览量: 303
- PDF下载量: 128
- 被引次数: 0
