

Spatial-temporal characteristic of tropical cyclone disasters in China during 1984−2017
-
摘要: 本文基于1984−2017年热带气旋灾情资料和中国气象局上海台风研究所整编的热带气旋最佳路径资料,分析了中国热带气旋灾害的时空特征,比较了不同盛行路径下热带气旋灾害的差异,探讨了盛行路径下热带气旋陆上持续时间变化及灾害潜在风险。结果表明:(1)1984−2017年,直接经济损失呈现上升趋势,但该损失在国民生产总值中占比和死亡人数则呈下降趋势。(2)3类盛行路径热带气旋直接经济损失具有区域性差别。近海转向热带气旋登陆中国的数目少、灾害轻,西行和西北行的热带气旋登陆中国的数目多、范围广、灾害重。其中西行热带气旋主要影响广东、广西和海南,西北行热带气旋主要影响广东、福建和浙江。(3)台风潜在风险影响因子—热带气旋陆上平均持续时间,近几十年来增加趋势显著,但不同盛行路径陆上平均持续时间增加原因不一。近海转向的热带气旋陆上平均持续时间增加与陆上平均移速减小有关,西行和西北行的热带气旋陆上平均持续时间增加主要由陆上平均移动距离增加所致。Abstract: Based on tropical cyclone (TC) disaster data and the best-track database from Shanghai Typhoon Institute of China Meteorological Administration (CMA-STI) during 1984 to 2017, this study analyzed the spatial-temporal characteristics of TC disaster in China and their differences for the three prevailing tracks, along with the discussion of the overland duration and its potential risk. Main results of this study were summarized as follows: (1) There was a significant upward trend with direct TC-associated economic losses, while the proportion of losses to Gross Domestic Product (GDP) and the deaths showed a downward trend. (2) TC-associated economic losses accompanied with the three prevailing TC tracks showed a substantial difference. The recurving TCs tended to be less and lower impact, while westward and west-northward TCs appeared to be more and higher impact in China. Particularly, more frequent TCs with westward movement affected the Guangdong, Guangxi and Hainan provinces. TCs tending to west-northward tracks mainly caused a serious TC-associated disaster in Guangdong, Fujian, and Zhejiang provinces. (3) The average overland duration, as a potential index for TC-associated disaster, showed an upward trend. Note that the reasons on the changes of TC overland duration for the three prevailing tracks appeared to be different. The increased average overland duration for recurving TCs were likely to relate to the decreased in TC average overland translation speed. In contrast, the increased average overland duration of westward and west-northward moving TCs were possibly due to the increased average distance that TCs traveled over land.
-

图 1 1984−2017年因TC导致的死亡人数(a)、直接经济损失(b)和原始直接经济损失在GDP中百分比(c)
直线表示线性趋势,“Z”为M-K检验统计量,*表示趋势线通过95%显著性检验
Fig. 1 Time series of deaths (a), direct economic losses (b) and original direct economic losses proportion to GDP (c) caused by affecting TCs during 1984−2017
The straight line indicates the linear trend, Z is M-K trend test score, the Z-value with symbol “*” indicates the linear trend is significant at a 95% significance test
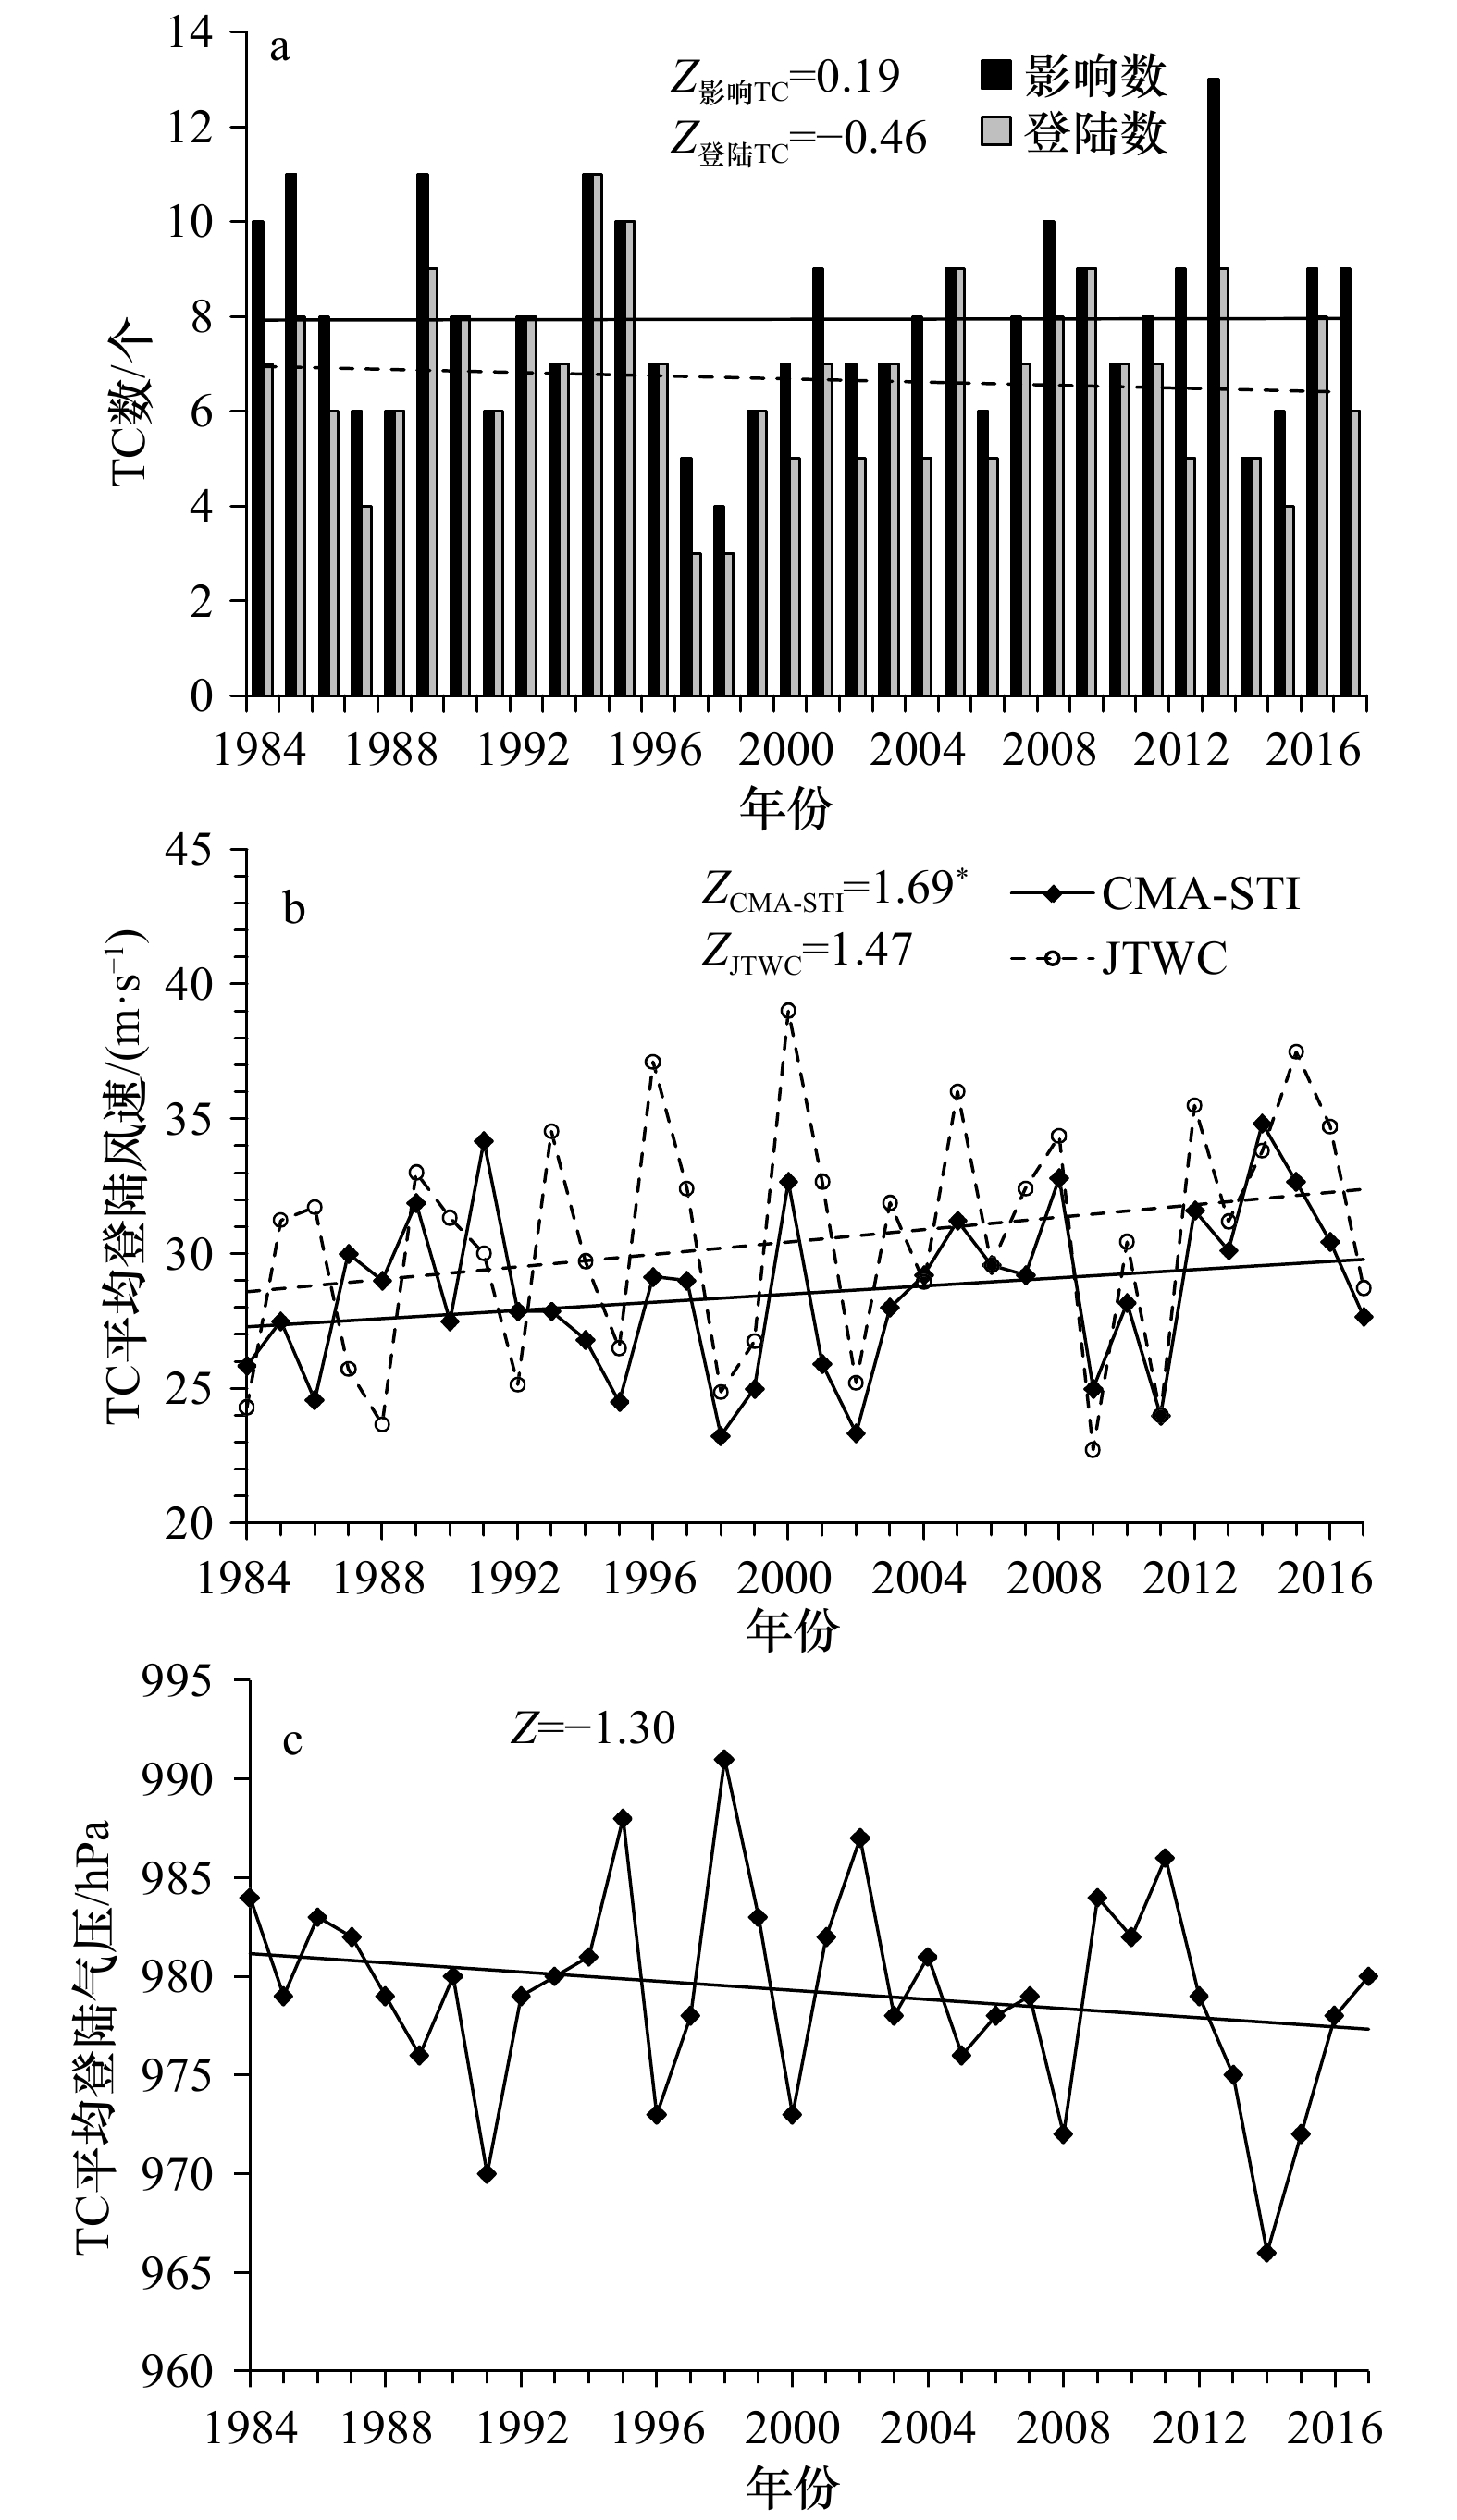
图 2 1984−2017年影响和登陆中国的TC数目(a)、TC平均登陆风速(b)和TC平均登陆气压(c)
a中实线和虚线分别代表影响和登陆TC的线性趋势;b和c中直线表示相应序列线性趋势;“Z”为M-K检验统计量;*表示趋势线通过95%显著性检验
Fig. 2 The number of affecting and landfalling TCs (a), average landing wind speed (b) and landing pressure (c) of landfalling TCs from 1984 to 2017
The solid dotted line in a represent the linear trend of affecting and landfalling TCs, respectively; the lines in b and c indicate the linear trend of the corresponding sequences Z is M-K trend test score; the Z-value with symbol “*” indicates the linear trend is significant at a 95% significance test

图 3 1984−2017年中国各省(自治区、直辖市)累计登陆TC数(a)和影响TC数(b)
统计结果不包含港澳台
Fig. 3 Distribution of total landfalling (a) and affecting (b) TC numbers in China during 1984−2017
The statistical results do not include the data of Hong Kong, Macao and Taiwan

图 4 1984−2017年中国各省(自治区、直辖市)因TC造成的年均直接经济损失(a)、CPI标准化年均经济损失(2017 RMB)(b)和年均死亡人数(c)
统计结果不包含港澳台
Fig. 4 Distribution of annual mean direct economic losses (a), CPI normalized economic losses (2017 RMB) (b) and deaths (c) caused by TCs in China during 1984−2017
The statistical results do not include the data of Hong Kong, Macao and Taiwan

图 5 1984−2017年影响TC年平均出现频数分布(a−d)和TC生成位置(e−h)
e−h中黑色点表示所有影响TC的生成位置,曲线表示生成位置的25%、50%和75%概率密度分布,三角形表示TC平均生成位置
Fig. 5 Distribution of annual mean frequency (a−d) and genesis locations (e−h) of the affecting TCs during 1984−2017
The affecting TC genesis points are shown in black dots and its kernel density estimation in 25%, 50%, and 75% contours along with the averaged genesis location of these affecting TCs in triangle in e−h
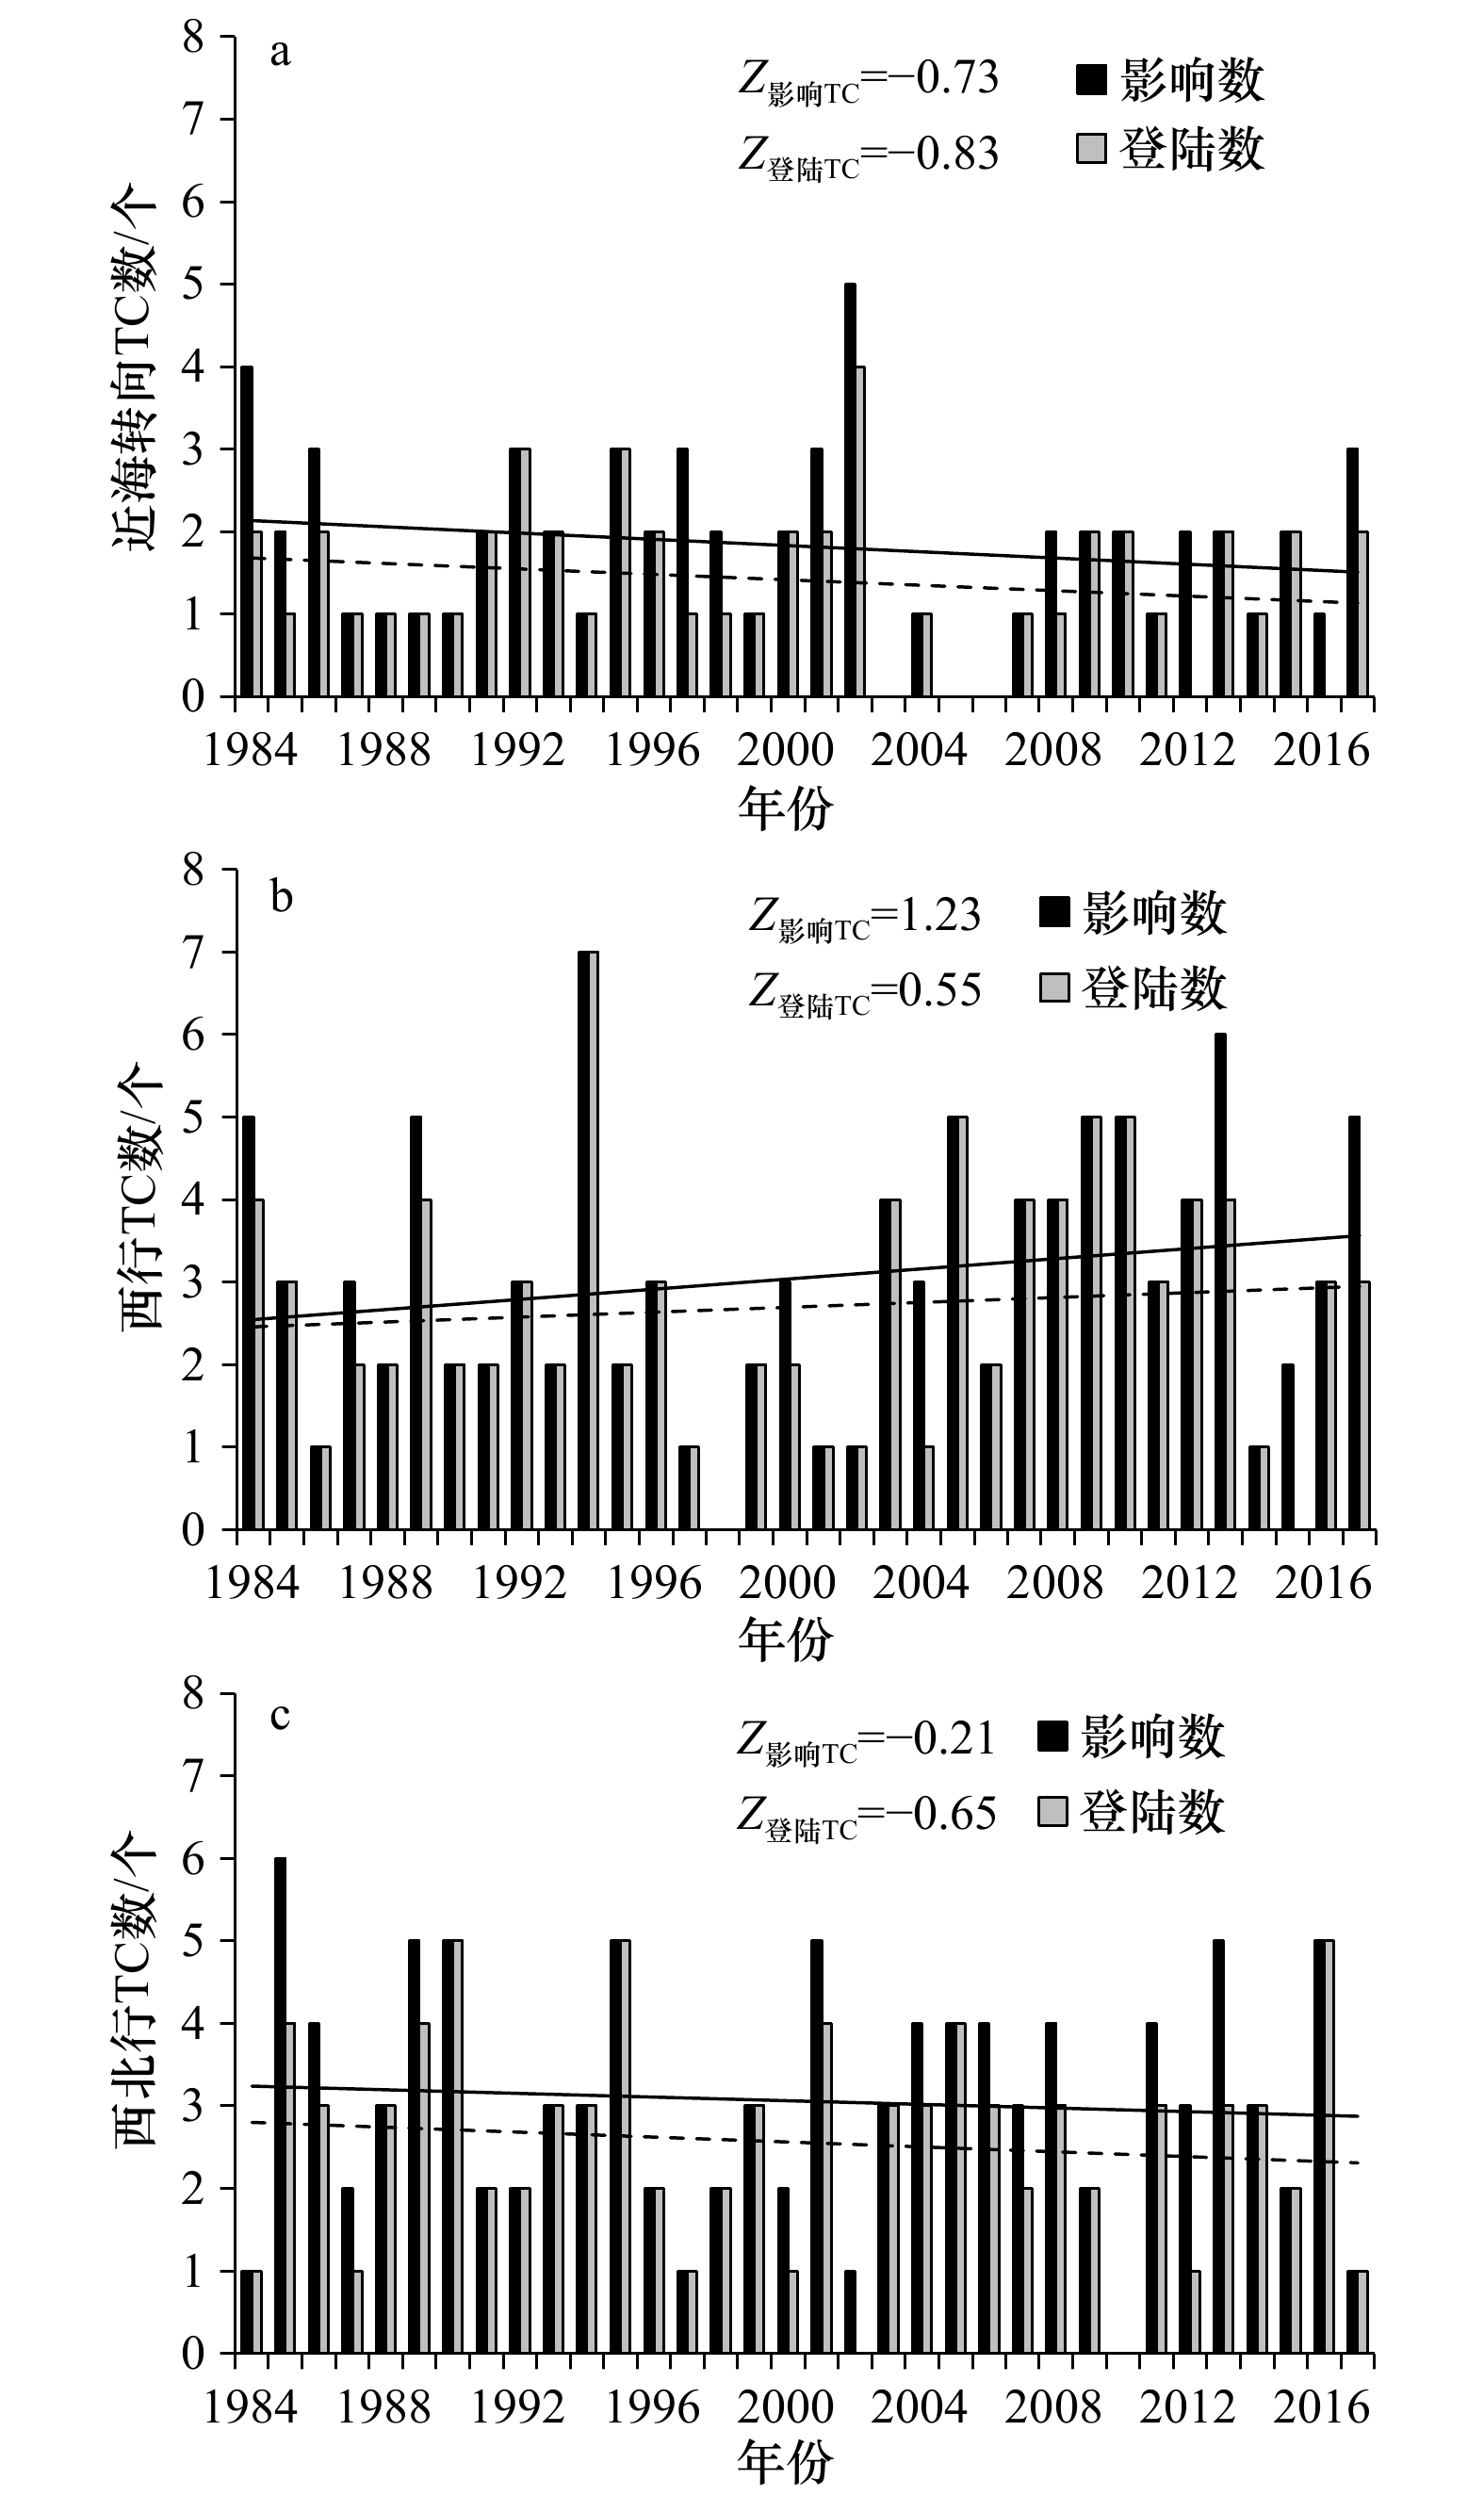
图 6 1984−2017年影响和登陆中国的近海转向(a)、西行(b)和西北行(c)TC个数
实线表示影响TC的线性趋势,虚线表示登陆TC线性趋势,“Z”为M-K检验统计量,趋势线均未通过95%显著性检验
Fig. 6 The number of affecting and landing TCs in China on the tracks of recurve (a), westward (b) and northwestward (c) during 1984−2017
The solid/dotted line represents the linear trend of affecting/landfalling TCs, Z is the M-K trend test score, the Z-value with the symbol “*” indicates the linear trend is significant at a 95% significance test
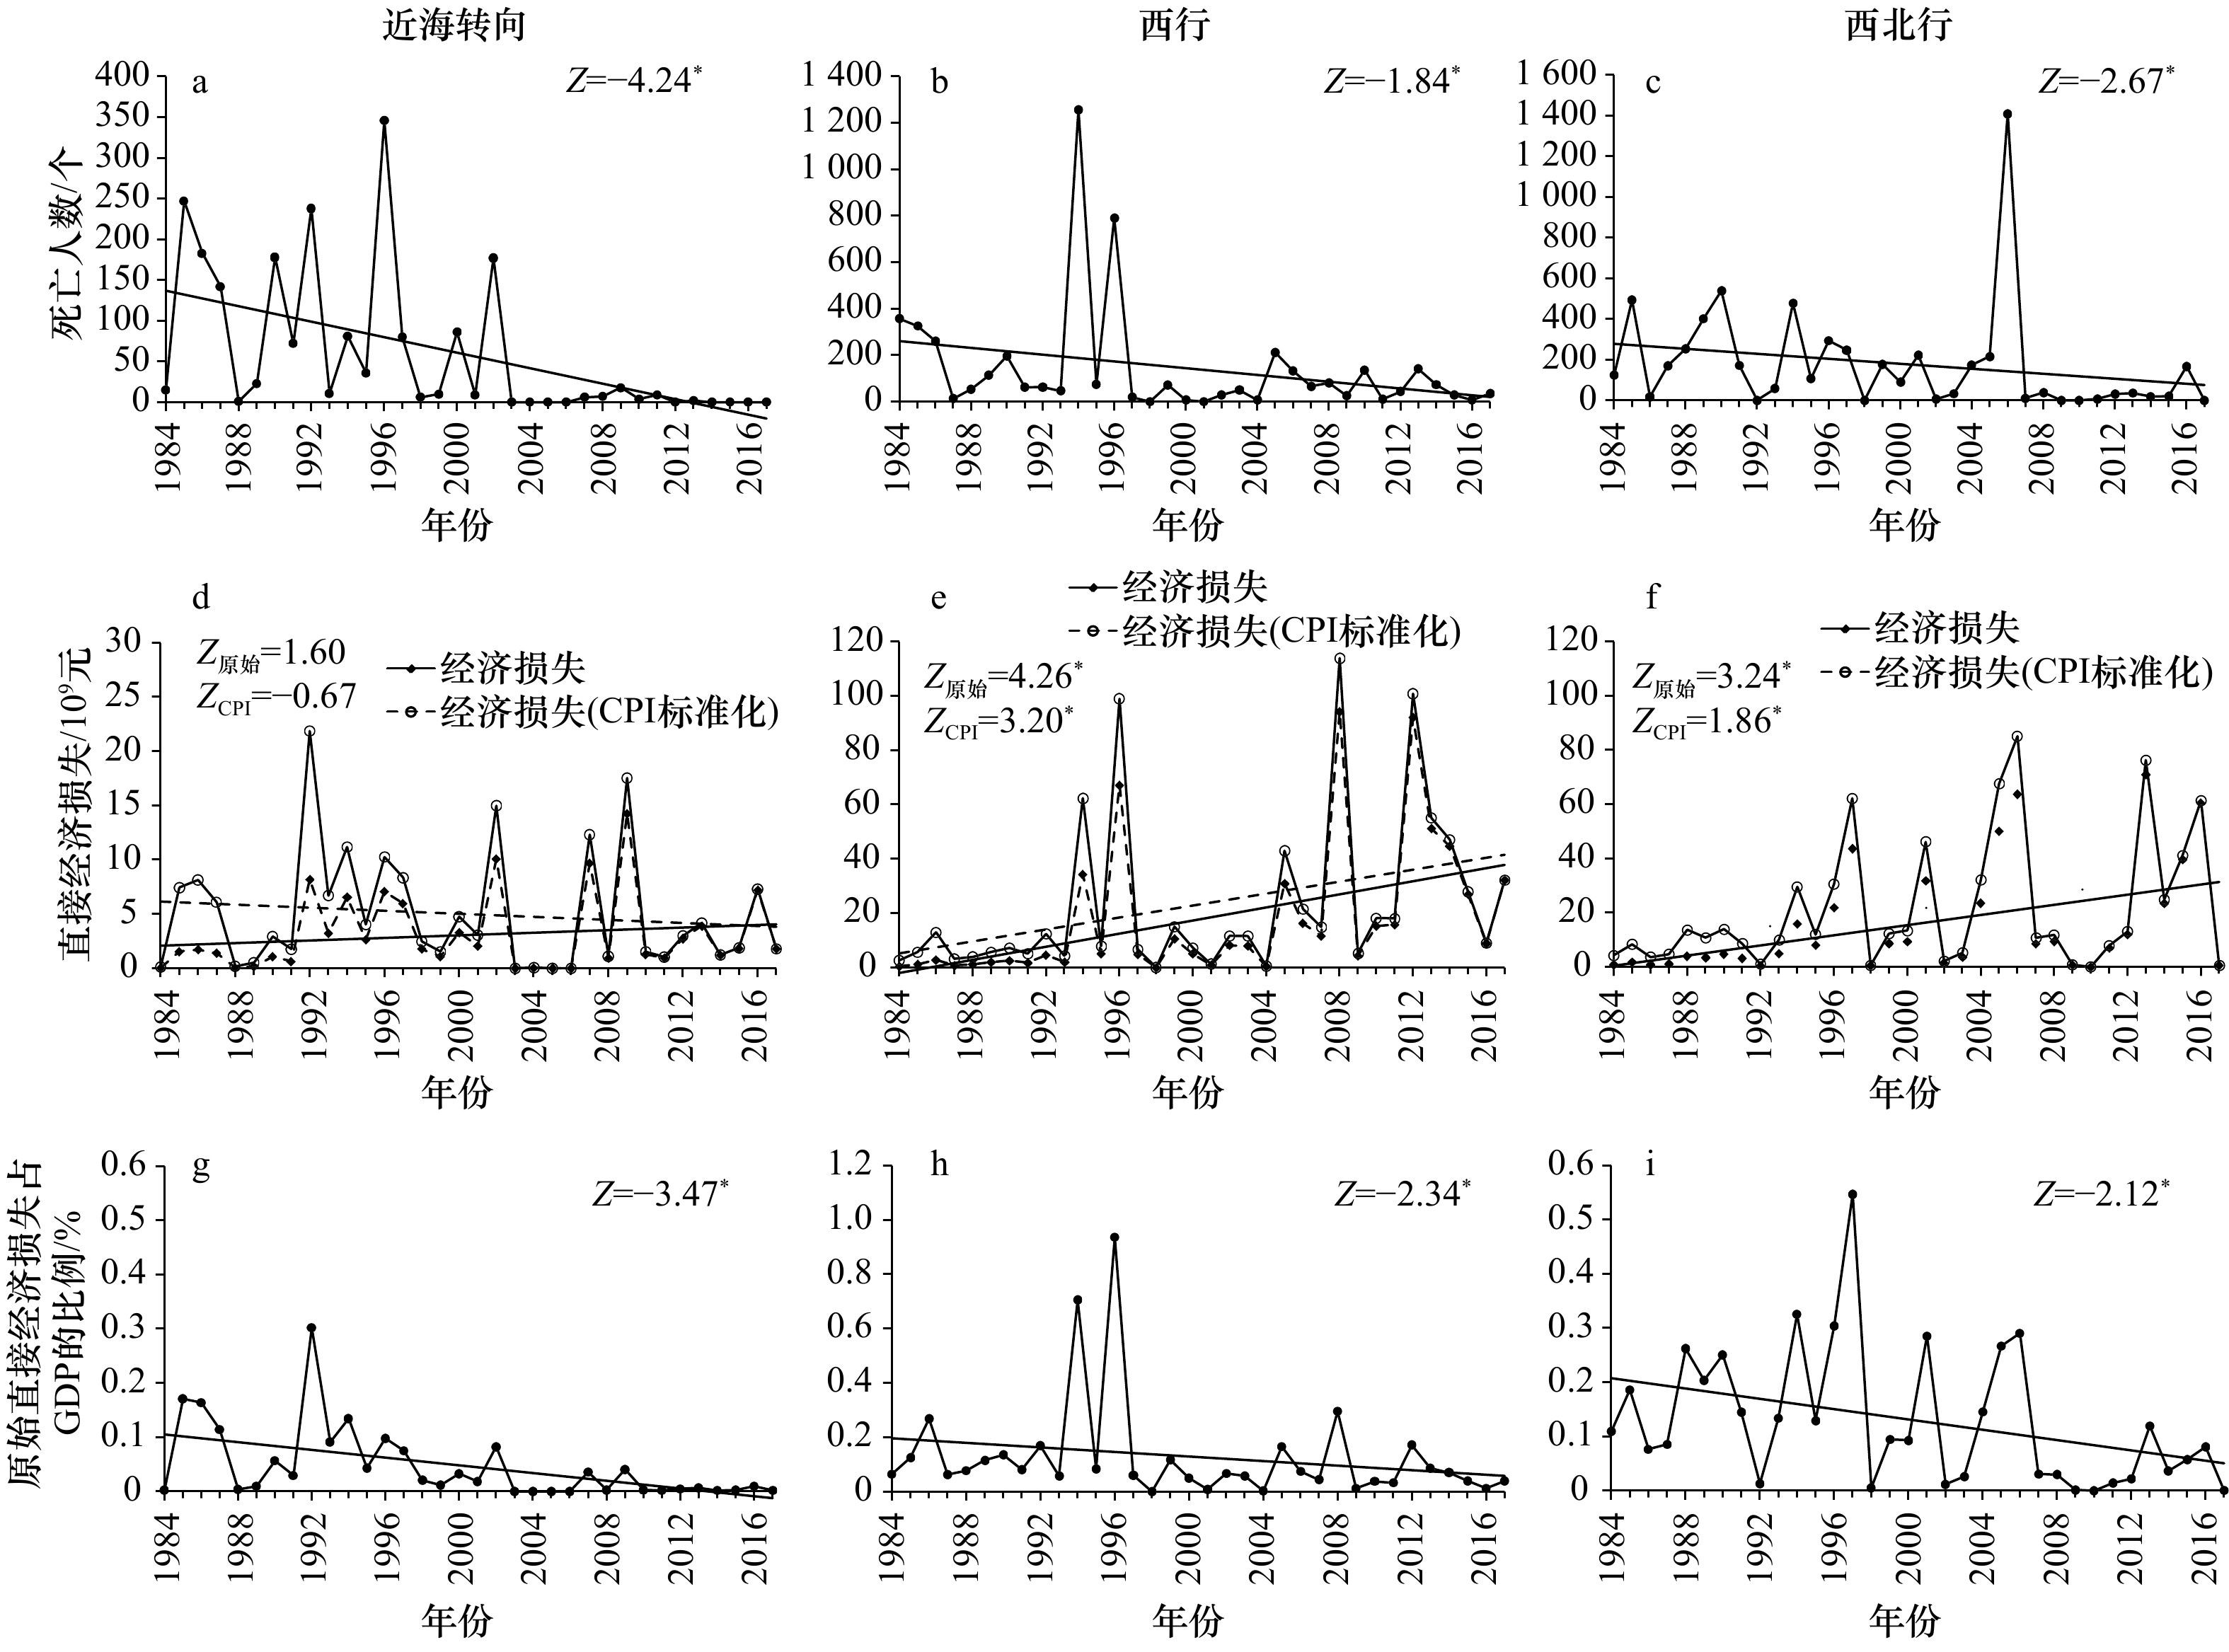
图 7 1984−2017年3类盛行路径下因TC导致的死亡人数(a−c)、直接经济损失(d−f)和原始直接经济损失在GDP中百分比(g−i)
直线表示相应序列的线性趋势,“Z”为M-K检验统计量,*表示趋势线通过95%显著性检验
Fig. 7 Time series of deaths (a−c), direct economic losses (d−f) and original direct economic losses proportion to GDP (g−i) caused by affecting TCs for the three prevailing tracks during 1984−2017
The straight line indicates the linear trend, Z is the M-K trend test score, the Z-value with the symbol “*” indicates the linear trend is significant at a 95% significance test
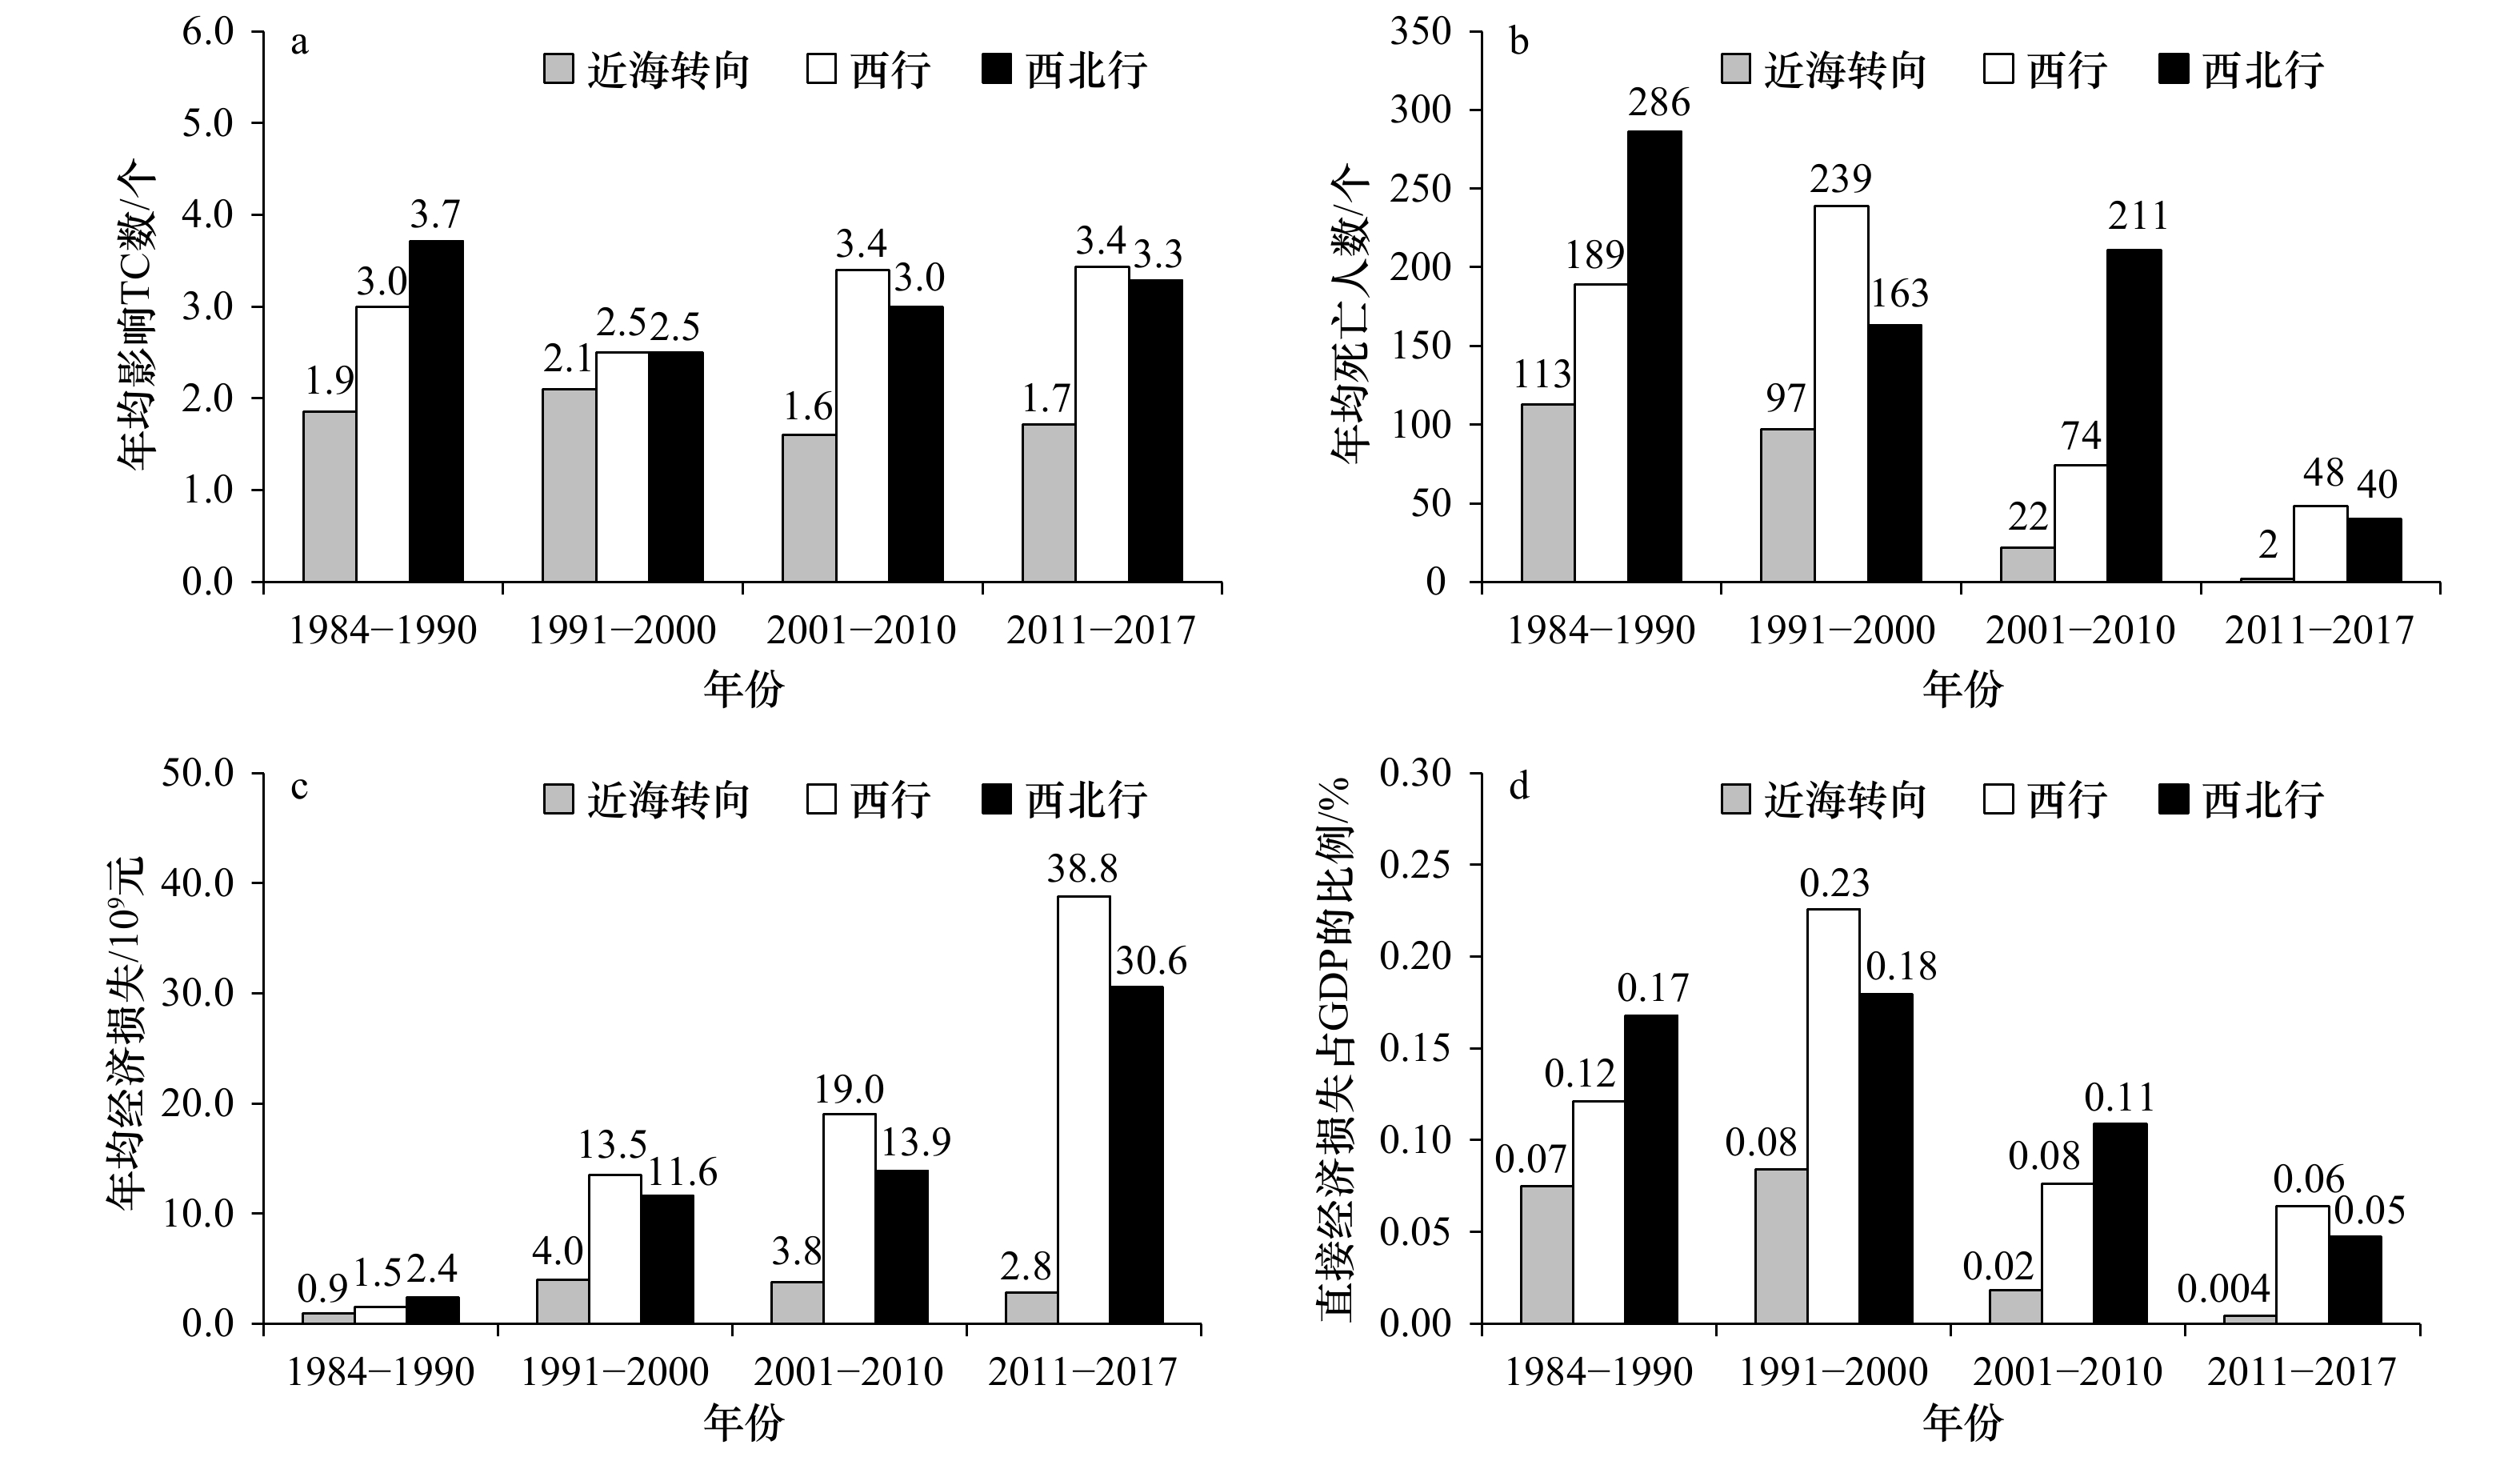
图 8 1984−2017年3类盛行路径下各年代平均的影响TC频数(a)、死亡人数(b)、直接经济损失(c)和直接经济损失在GDP中百分比(d)
Fig. 8 Decadal changes in the mean of affecting TC numbers (a), deaths (b), direct economic losses (c) and the percentage of direct economic losses to GDP (d) for the three prevailing tracks during 1984−2017
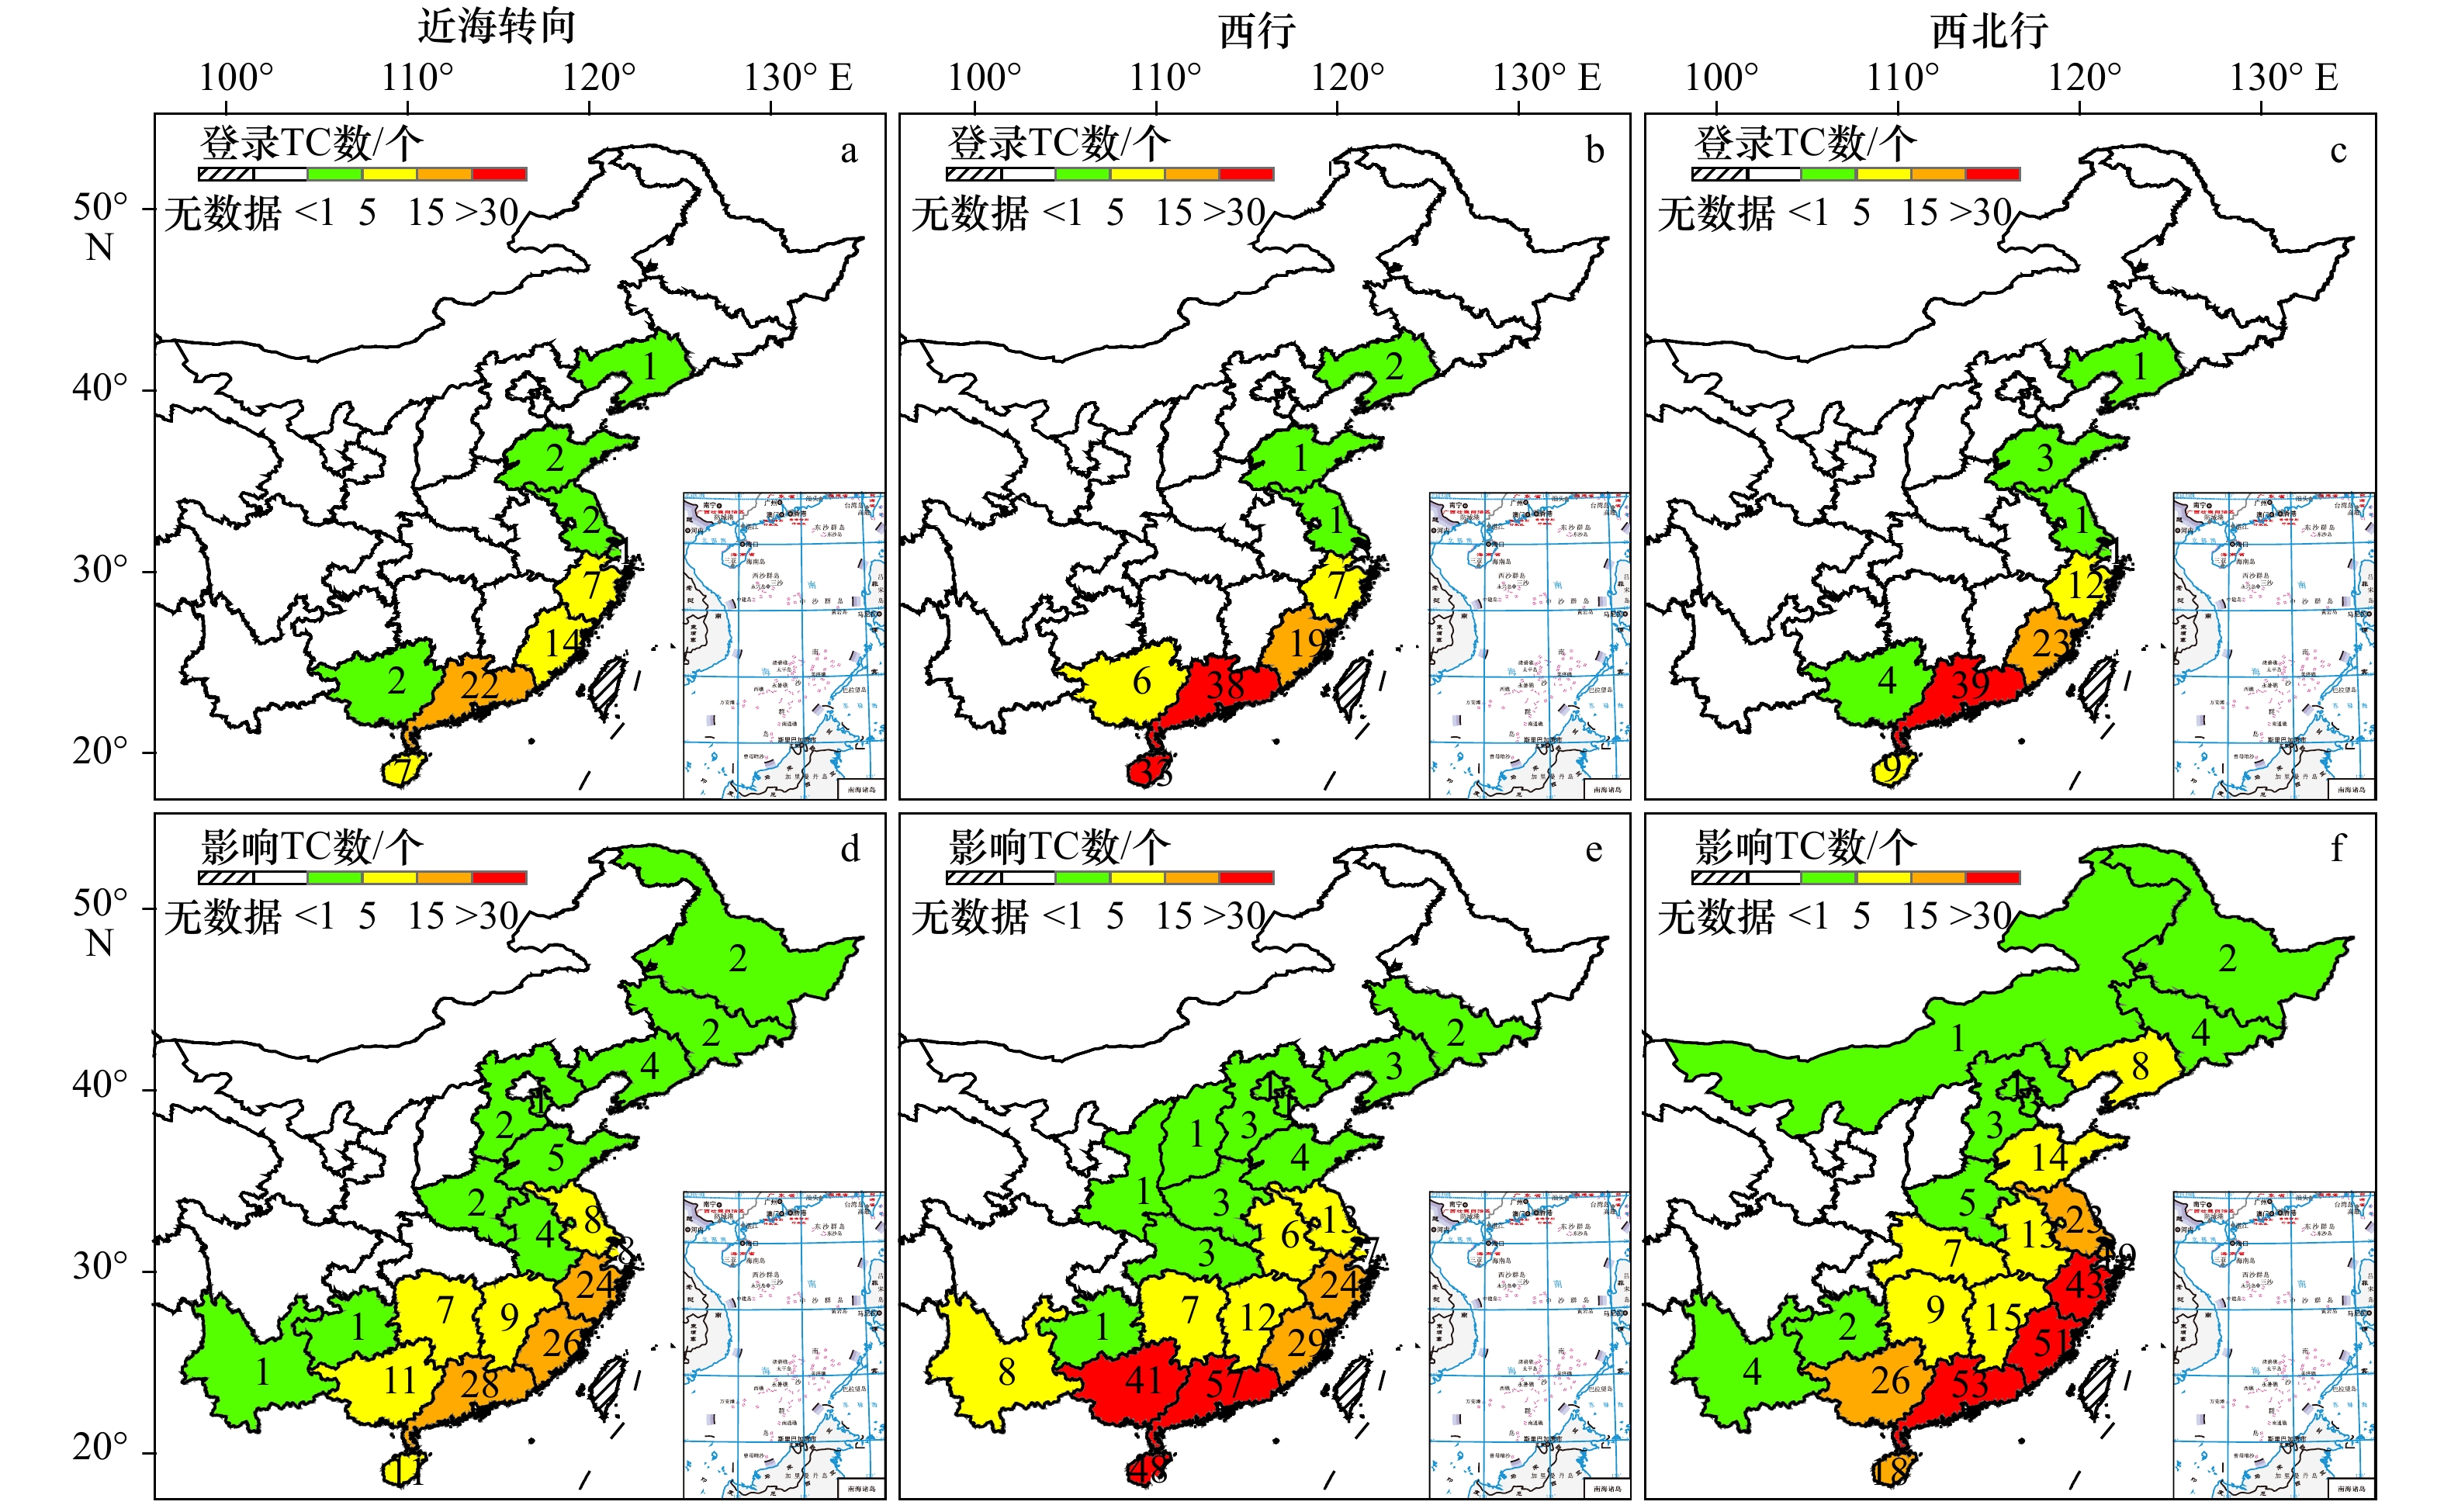
图 9 1984−2017年3类路径下中国各省(自治区、直辖市)累计登陆TC数(a−c)和影响TC数(d−f)
统计结果不包含港澳台
Fig. 9 Distribution of landfalling (a−c) and affecting (d−f) TC numbers in China for the three prevailing tracks during 1984−2017
The statistical results do not include the data of Hong Kong, Macao and Taiwan

图 10 1984−2017年3类路径下中国各省(自治区、直辖市)因TC造成的年均直接经济损失(a−c)、CPI标准化年均经济损失(2017人民币水平)(d−f)和年均死亡人数(g−i)
统计结果不包含港澳台
Fig. 10 Distribution of annual mean direct economic losses (a−c), CPI normalized economic losses (2017 RMB) (d−f) and deaths (g−i) caused by TCs in China for the three prevailing tracks during 1984−2017
The statistical results do not include the data of Hong Kong, Macao and Taiwan
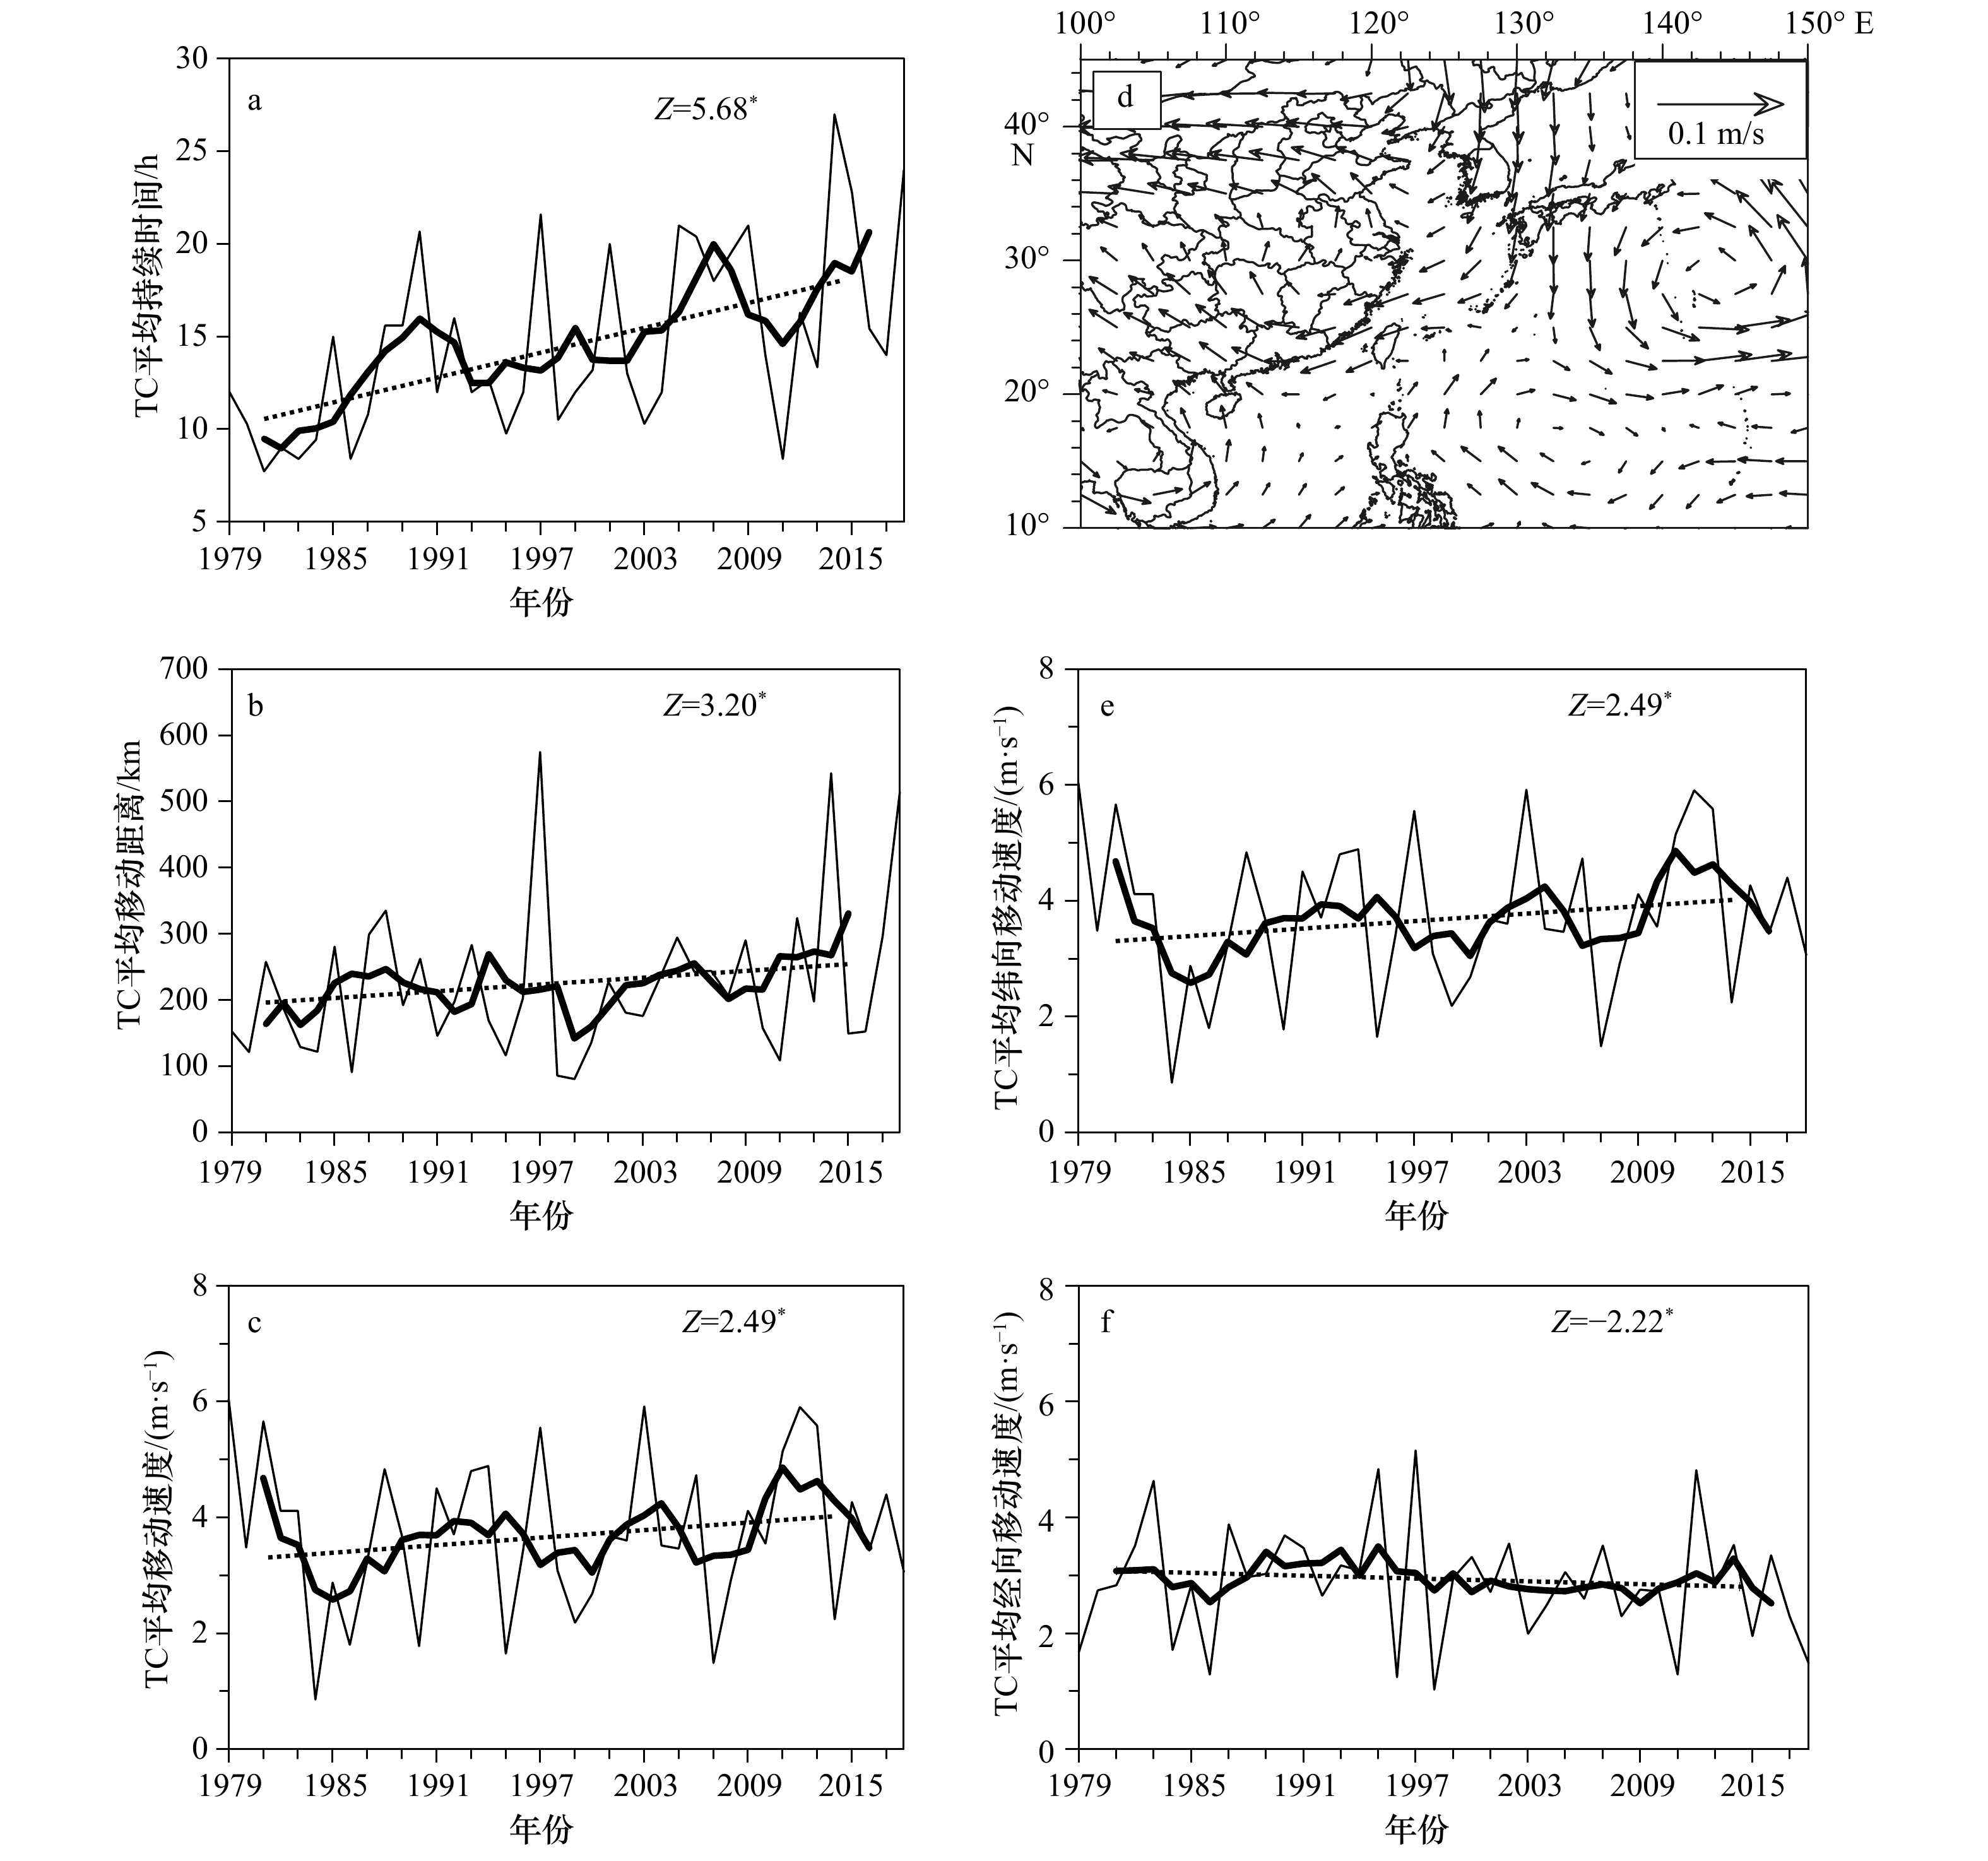
图 11 1979−2018年在中国陆上的TC平均持续时间(a)、平均移动距离(b)、平均移动速度(c)、引导气流线性变化趋势(d)、TC平均纬向移动速度(e)和平均经向移动速度(f)
粗线表示5年滑动平均,虚线表示滑动平均序列的线性趋势,“Z”为M-K检验统计量,*表示趋势线通过95%显著性检验
Fig. 11 Time series of annual mean overland duration (a), distance (b) and translation speed (c) of TCs in China, the trends in large scale steering flows (d), and the zonal (e) and meridional (f) TC translation speed during 1979−2018
Thick lines are the 5-years running average along its linear trend in dashed lines. Z is the M-K trend test score, the Z-value with the symbol “*” indicates the linear trend is significant at a 95% significance test
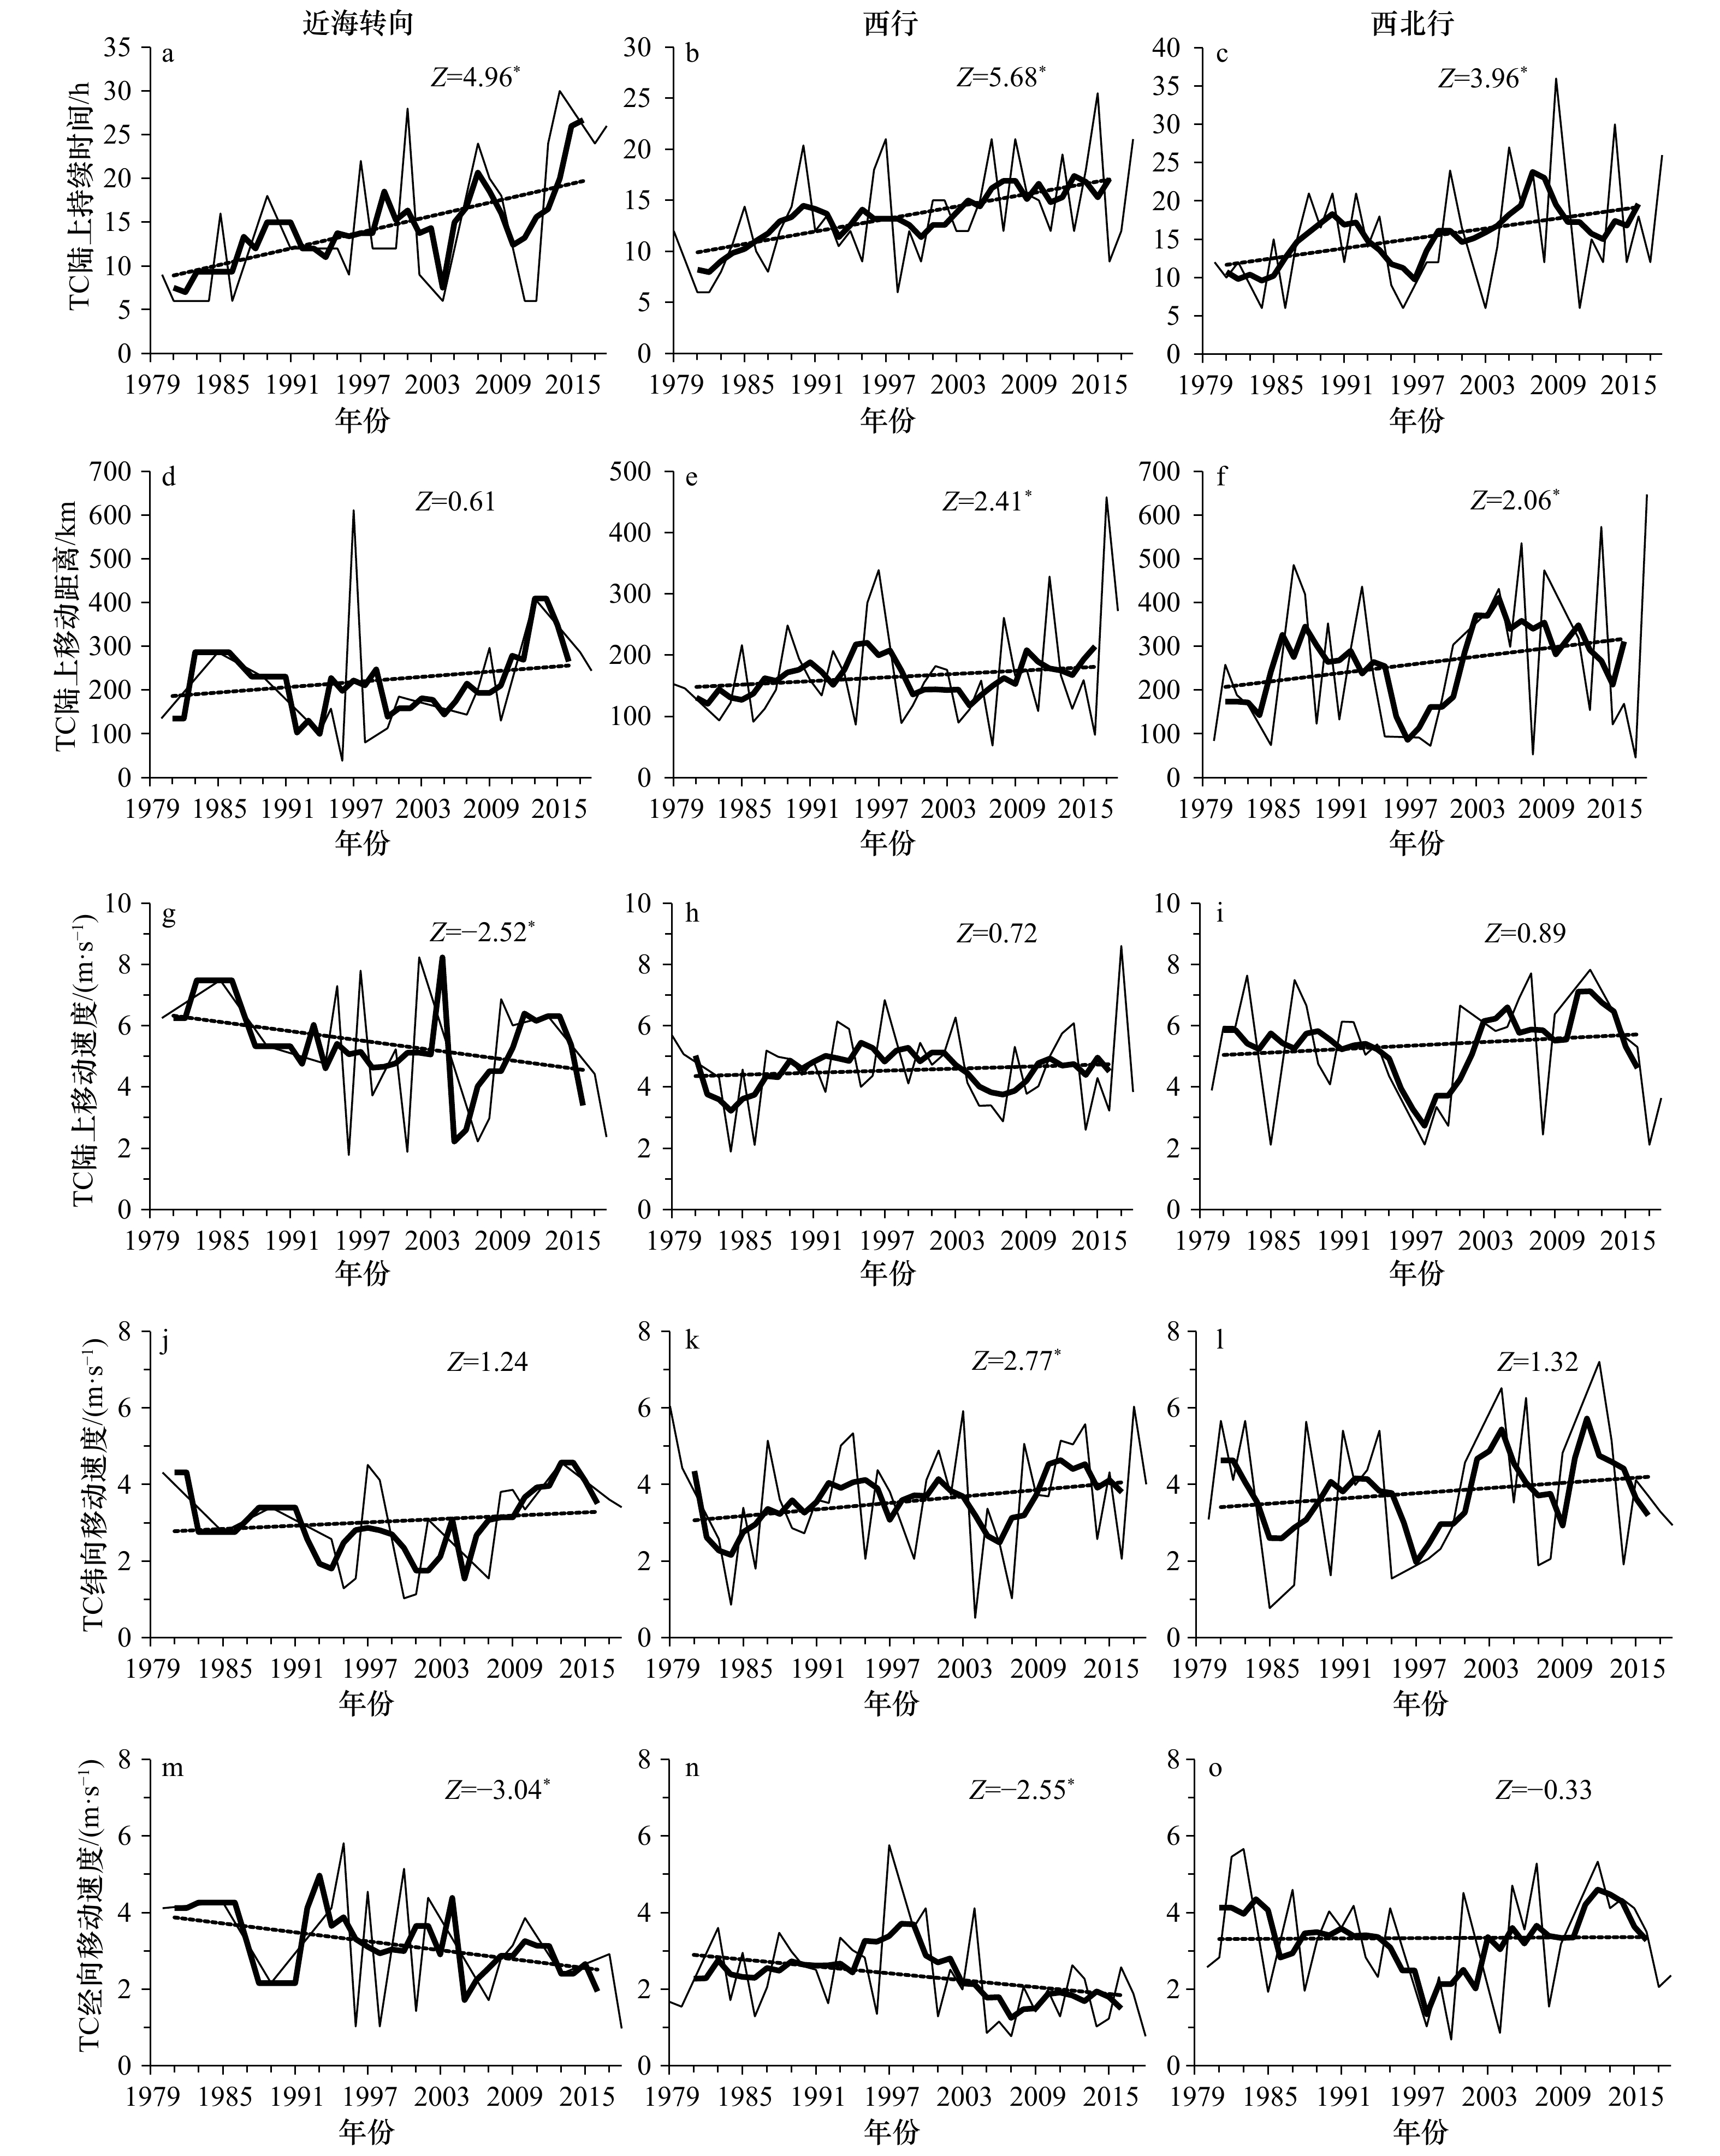
图 12 1979−2018年3类移动路径下平均每个TC在中国陆上的持续时间(a−c)、移动距离(d−f)、移动速度(g−i)、纬向移动速度(j−l)和经向移动速度(m−o)
粗线表示5年滑动平均,虚线表示滑动平均序列的线性趋势,“Z”为M-K检验统计量,*表示趋势线通过95%显著性检验
Fig. 12 Time series of annual mean overland duration (a−c), distance (d−f), translation speed (g−i), and the zonal (j−l) and meridional (m−o) TC translation speed in China for the three prevailing tracks during 1979−2018
Thick lines are the 5-years running average, the straight line indicates the linear trend, Z is the M-K trend test score, the Z-value with the symbol “*” indicates that the linear trend is significant at a 95% significance test
表 1 1984−2017年影响和登陆中国的TC数目与灾害的年代变化
Tab. 1 Decadal change in mean of TC numbers and the associated disaster in China from 1984 to 2017
时间 TC影响平均数/(个·a−1) TC登陆平均数/(个·a−1) 死亡人数
/(个·a−1)直接经济
损失/(亿元·a−1)平均CPI标准化经济
损失/(亿元·a−1)原始直接经济损失占
GDP的比例/%1984−1990年 8.6 6.9 588 47.6 197.9 0.36 1991−2000年 7.1 6.6 498 292.0 472.8 0.49 2001−2010年 8.0 6.9 301 420.6 553.9 0.20 2011−2017年 8.4 6.3 90 721.7 765.7 0.12  下载: 导出CSV
表 2 1984−2017年盛行路径下影响TC活动特征
Tab. 2 Characteristics of all affecting TCs and of affecting TCs for three prevailing tracks during 1984−2017
盛行路径 总路径 近海转向 西行 西北行 TC影响数/个 270 62 104 104 TC登陆数/个 227 49 93 85 平均最大风速/(m·s−1) 39.9 35.8 43.3 40.3 平均登陆风速/(m·s−1) 28.6 26.7 30.3 28 平均持续时间/h 120.3 123 136.7 108.1 陆上平均持续时间/h 15 14.8 14.5 15.7
下载: 导出CSV
表 3 1984−2017年造成中国直接经济损失最大的10个TC
Tab. 3 Top 10 TCs with the greatest direct economic losses in China during 1984−2017
年份 编号 命名 盛行路径 登陆风速/
(m·s−1)陆上持续
时间/h经济损失/
亿元单个TC经济损失占
总TC经济损失的比例 /%死亡人数 2008 0814 黑格比(Hagupit) 西行 48 18 801.7 76.7 35 1996 9608 赫伯(Herb) 西行 40 30 652.7 67.9 779 2013 1323 菲特(Fitow) 西北行 42 12 631.4 50.1 11 2012 1210 达维(Damrey) 西行 35 18 455.6 42.8 20 2014 1409 威马逊(Rammasun) 西行 60 36 446.5 64.4 73 1997 9711 温妮(Winnie) 西北行 40 66 436.3 80.1 248 2006 0604 碧利斯(Bilis) 西北行 30 24 383.1 47.9 863 2012 1211 海葵(Haikui) 西行 42 36 375.9 35.3 6 2016 1614 莫兰蒂(Meranti) 西北行 50 18 316.4 41.3 38 2015 1522 彩虹(Mujiae) 西北行 52 24 300.1 43.9 20
下载: 导出CSV
-
[1] 杨桂山. 中国沿海风暴潮灾害的历史变化及未来趋向[J]. 自然灾害学报, 2000, 9(3): 23−30.Yang Guishan. Historical change and future trends of storm surge disaster in China’s coastal area[J]. Journal of Natural Disasters, 2000, 9(3): 23−30. [2] 王星, 鲁胜力, 周乐群. 滑坡泥石流灾害及其防治策略探讨[J]. 水土保持研究, 2005, 12(5): 138−145.Wang Xing, Lu Shengli, Zhou Lequn. The preliminary research of slope-slide and mud-rock flow disaster and its control strategy[J]. Research of Soil and Water Conservation, 2005, 12(5): 138−145. [3] 梁必骐, 梁经萍, 温之平. 中国台风灾害及其影响的研究[J]. 自然灾害学报, 1995, 4(1): 84−91.Liang Biqi, Liang Jingping, Wen Zhiping. Study of typhoon disasters and its affects in China[J]. Journal of Natural Disasters, 1995, 4(1): 84−91. [4] 温姗姗, 翟建青, Fischer T, 等. 1984−2014年影响中国热带气旋的经济损失标准化及其变化特征[J]. 热带气象学报, 2017, 33(4): 478−487.Wen Shanshan, Zhai Jianqing, Fischer T, et al. Variation of normalized economic losses from influential tropical cyclones in China for 1984−2014[J]. Journal of Tropical Meteorology, 2017, 33(4): 478−487. [5] Wang Hong, Xu Min, Onyejuruwa A, et al. Tropical cyclone damages in Mainland China over 2005−2016: losses analysis and implications[J]. Environment, Development and Sustainability, 2019, 21(6): 3077−3092. doi: 10.1007/s10668-019-00481-7 [6] Zhang Qiang, Wu Liguang, Liu Qiufeng. Tropical cyclone damages in China 1983−2006[J]. Bulletin of the American Meteorological Society, 2009, 90(4): 489−496. doi: 10.1175/2008BAMS2631.1 [7] 丁燕, 史培军. 台风灾害的模糊风险评估模型[J]. 自然灾害学报, 2002, 11(1): 34−43.Ding Yan, Shi Peijun. Fuzzy risk assessment model of typhoon hazard[J]. Journal of Natural Disasters, 2002, 11(1): 34−43. [8] 陈香. 福建省台风灾害风险评估与区划[J]. 生态学杂志, 2007, 26(6): 961−966.Chen Xiang. Risk assessment and zonation of typhoon disasters in Fujian Province[J]. Chinese Journal of Ecology, 2007, 26(6): 961−966. [9] 顾小丽, 陈有利, 钱燕珍, 等. 宁波市台风灾情评估和基于层次分析法的风险评估[J]. 热带气象学报, 2018, 34(4): 489−498.Gu Xiaoli, Chen Youli, Qian Yanzhen, et al. Evaluation of typhoon disaster in Ningbo and risk assessment based on analytical hierarchy process[J]. Journal of Tropical Meteorology, 2018, 34(4): 489−498. [10] 陈佩燕, 杨玉华, 雷小途, 等. 我国台风灾害成因分析及灾情预估[J]. 自然灾害学报, 2009, 18(1): 64−73.Chen Peiyan, Yang Yuhua, Lei Xiaotu, et al. Cause analysis and preliminary hazard estimate of typhoon disaster in China[J]. Journal of Natural Disasters, 2009, 18(1): 64−73. [11] 林江豪, 阳爱民. 基于BP神经网络和VSM的台风灾害经济损失评估[J]. 灾害学, 2019, 34(1): 22−26.Lin Jianghao, Yang Aimin. Economic loss assessment of typhoon based on BP neural network and VSM[J]. Journal of Catastrophology, 2019, 34(1): 22−26. [12] 冯涛, 黄荣辉, 陈光华, 等. 近年来关于西北太平洋热带气旋和台风活动的气候学研究进展[J]. 大气科学, 2013, 37(2): 364−382.Feng Tao, Huang Ronghui, Chen Guanghua, et al. Progress in recent climatological research on tropical cyclone activity over the Western North Pacific[J]. Chinese Journal of Atmospheric Sciences, 2013, 37(2): 364−382. [13] 陆晓婕, 董昌明, 李刚. 1951−2015年进入东海的台风频数及登陆点的变化[J]. 大气科学学报, 2018, 41(4): 433−440.Lu Xiaojie, Dong Changming, Li Gang. Variations of typhoon frequency and landfall position in East China Sea from 1951 to 2015[J]. Transactions of Atmospheric Sciences, 2018, 41(4): 433−440. [14] 黄荣辉, 王磊. 台风在我国登陆地点的年际变化及其与夏季东亚/太平洋型遥相关的关系[J]. 大气科学, 2010, 34(5): 853−864.Huang Ronghui, Wang Lei. Interannual variation of the landfalling locations of typhoons in China and its association with the summer East Asia/Pacific pattern teleconnection[J]. Chinese Journal of Atmospheric Sciences, 2010, 34(5): 853−864. [15] Wu Liguang, Wang Bin, Geng Shuqin. Growing typhoon influence on East Asia[J]. Geophysical Research Letters, 2005, 32(18): L18703. [16] 沈永平, 王国亚. IPCC第一工作组第五次评估报告对全球气候变化认知的最新科学要点[J]. 冰川冻土, 2013, 35(5): 1068−1076.Shen Yongping, Wang Guoya. Key findings and assessment results of IPCC WGI fifth assessment report[J]. Journal of Glaciology and Geocryology, 2013, 35(5): 1068−1076. [17] 雷小途, 徐明, 任福民. 全球变暖对台风活动影响的研究进展[J]. 气象学报, 2009, 67(5): 679−688.Lei Xiaotu, Xu Ming, Ren Fumin. A review on the impacts of global warming on tropical cyclone activities[J]. Acta Meteorologica Sinica, 2009, 67(5): 679−688. [18] Yamaguchi M, Chan J C L, Moon I J, et al. Global warming changes tropical cyclone translation speed[J]. Nature Communications, 2020, 11(1): 47. doi: 10.1038/s41467-019-13902-y [19] Mendelsohn R, Emanuel K, Chonabayashi S, et al. The impact of climate change on global tropical cyclone damage[J]. Nature Climate Change, 2012, 2(3): 205−209. doi: 10.1038/nclimate1357 [20] Webster P, Holland G J, Curry J A, et al. Changes in tropical cyclone number, duration, and intensity in a warming environment[J]. Science, 2005, 309(5742): 1844−1846. doi: 10.1126/science.1116448 [21] 张娇艳, 吴立广, 张强. 全球变暖背景下我国热带气旋灾害趋势分析[J]. 热带气象学报, 2011, 27(4): 442−454.Zhang Jiaoyan, Wu Liguang, Zhang Qiang. Tropical cyclone damages in China under the background of global warming[J]. Journal of Tropical Meteorology, 2011, 27(4): 442−454. [22] 杨玉华, 应明, 陈葆德. 近58年来登陆中国热带气旋气候变化特征[J]. 气象学报, 2009, 67(5): 689−696.Yang Yuhua, Ying Ming, Chen Baode. The climatic changes of landfall tropical cyclones in China over the past 58 years[J]. Acta Meteorologica Sinica, 2009, 67(5): 689−696. [23] 余晖, 胡春梅, 蒋乐贻. 热带气旋强度资料的差异性分析[J]. 气象学报, 2006, 64(3): 357−363.Yu Hui, Hu Chunmei, Jiang Leyi. Comparison of three tropical cyclone strength datasets[J]. Acta Meteorologica Sinica, 2006, 64(3): 357−363. [24] Pielke R A Jr, Gratz J, Landsea C W, et al. Normalized hurricane damage in the United States: 1900–2005[J]. Natural Hazards Review, 2008, 9(1): 29−42. doi: 10.1061/(ASCE)1527-6988(2008)9:1(29) [25] Gaffney S J. Probabilistic curve-aligned clustering and prediction with regression mixture models[D]. Irvine: University of California, 2004. [26] 王桂新, 陈冠春. 中国人口变动与经济增长[J]. 人口学刊, 2010(3): 3−9.Wang Guixin, Chen Guanchun. China’s population changes and economic growth[J]. Population Journal, 2010(3): 3−9. [27] 许映龙, 张玲, 高拴柱. 我国台风预报业务的现状及思考[J]. 气象, 2010, 36(7): 43−49.Xu Yinglong, Zhang Ling, Gao Shuanzhu. The advances and discussions on china operational typhoon forecasting[J]. Meteorological Monthly, 2010, 36(7): 43−49. [28] 雷小途. 中国台风科研业务百年发展历程概述[J]. 中国科学: 地球科学, 2020, 63(3): 362−383. doi: 10.1007/s11430-018-9379-8Lei Xiaotu. Overview of the development history of China’s typhoon research and operational work in the past century[J]. Science China (Terrae), 2020, 63(3): 362−383. doi: 10.1007/s11430-018-9379-8 [29] Wu Liguang, Wang Bin. Assessing impacts of global warming on tropical cyclone tracks[J]. Journal of Climate, 2004, 17(8): 1686−1698. doi: 10.1175/1520-0442(2004)017<1686:AIOGWO>2.0.CO;2 [30] 汉京超, 俞士静, 陈秀成. 沿海平原河网城市排水防涝典型问题及对策分析[J]. 中国给水排水, 2020, 36(4): 30−34.Han Jingchao, Yu Shijing, Chen Xiucheng. Analysis of typical problems and countermeasures of drainage and waterlogging prevention in coastal plain river network city[J]. China Water and Wastewater, 2020, 36(4): 30−34. [31] 帅嘉冰, 徐伟, 史培军. 长三角地区台风灾害链特征分析[J]. 自然灾害学报, 2012, 21(3): 36−42.Shuai Jiabing, Xu Wei, Shi Peijun. Characteristic analysis of typhoon disaster chains in the Yangtze River Delta region of China[J]. Journal of Natural Disasters, 2012, 21(3): 36−42. [32] Chen Xiaoyu, Wu Liguang, Zhang Jiaoyan. Increasing duration of tropical cyclones over China[J]. Geophysical Research Letters, 2011, 38(2): L02708. [33] Kumar A, Yang Fanglin, Goddard L, et al. Differing trends in the tropical surface temperatures and precipitation over land and oceans[J]. Journal of Climate, 2004, 17(3): 653−664. doi: 10.1175/1520-0442(2004)017<0653:DTITTS>2.0.CO;2 [34] 袁金南, 黄燕燕, 刘春霞, 等. 陆地摩擦对登陆热带气旋路径和强度影响的模拟研究[J]. 热带气象学报, 2007, 23(6): 531−537.Yuan Jinnan, Huang Yanyan, Liu Chunxia, et al. A simulation study of the influence of land friction on landfall tropical cyclone track and intensity[J]. Journal of Tropical Meteorology, 2007, 23(6): 531−537. [35] Holland G J. Tropical cyclone motion: environmental interaction plus a beta effect[J]. Journal of the Atmospheric Sciences, 1983, 40(2): 328−342. doi: 10.1175/1520-0469(1983)040<0328:TCMEIP>2.0.CO;2 [36] Knutson T R, Tuleya R E. Impact of CO2-induced warming on simulated hurricane intensity and precipitation: sensitivity to the choice of climate model and convective parameterization[J]. Journal of Climate, 2004, 17(18): 3477−3495. doi: 10.1175/1520-0442(2004)017<3477:IOCWOS>2.0.CO;2 [37] 倪钟萍, 吴立广, 张玲. 2005−2010年台风突变路径的预报误差及其环流背景[J]. 气象, 2013, 39(6): 719−727.Ni Zhongping, Wu Liguang, Zhang Ling. Analysis on forecasting errors and associated circulations of sudden typhoon track changes during 2005−2010[J]. Meteorological Monthly, 2013, 39(6): 719−727. -

计量
- 文章访问数: 1254
- HTML全文浏览量: 371
- PDF下载量: 167
- 被引次数: 0
