

Study on characteristics of marine heatwave in the China offshore in 2019
-
摘要: 海洋热浪是指在一定海域内发生的海表温度异常偏高的现象,海洋热浪的发生会对海洋生态系统的功能与服务产生重大影响。近年来,中国近海海洋热浪频发,引起越来越多的关注。本文利用逐日海表温度观测资料对2019年中国近海海洋热浪特征进行研究分析,结果显示:2019年,在中国近海海南岛周边海域、长江口附近海域、渤海海域和江苏外海海域海洋热浪高发,频次为7~12次;北部湾附近海域海洋热浪发生时间最长,超过150 d。在此基础上,以北部湾海域2−4月经历的一次持续时间长达数月的海洋热浪事件为例,分析了事件期间对应的气温场、气压场以及风场的异常,并进一步分析了北部湾不同季节海洋热浪事件与各气象背景场的对应关系。总体而言,2019年北部湾海域2−4月海洋热浪期间,气温偏高,副热带高压面积偏大、位置偏西偏北,冬季风偏弱,是此海洋热浪发生与维持的重要原因。Abstract: Marine heatwave, considered as events with prolonged anomalously high sea surface temperature in certain sea areas. The occurrence of marine heatwave could impact the function and service of marine ecosystem. In recent years, the marine heatwave in the China offshore become more frequent, and attract considerable attention. Used a range of ocean temperature data including daily satellite observations and daily in situ measurements, we analysised the characteristics of marine heatwave in the China offshore in 2019. Results show that in 2019, the frequency of marine heatwave is higher in the sea areas around Hainan Island, the Changjiang River Estuary, the Bohai Sea and the sea areas off Jiangsu Province, with the frequency of 7−12 times. The marine heatwave duration in the Beibu Gulf lasts the longest, more than 150 days. In addition, took the classical marine heatwave that last from February to April in Beibu Gulf as an example, anomaly characteristics of air temperature, sea level pressure and wind during the event period were investigated specifically and the corresponding relationships between the marine heatwave and meteorological background fields in different seasons in Beibu Gulf was further studied. On the whole, the higher air temperature, weaker East Asian winter monsoon, larger area and the northward and westward extension of subtropical high are the important factors for the occurrence and maintenance of the marine heatwave in the Beibu Gulf in the early 2019.
-
Key words:
- marine heatwave /
- climate change /
- China offshore /
- sea surface temperature
-

图 2 2019年中国近海海洋热浪事件特征
a. 发生频次;b. 发生天数;c. 平均强度;d. 最大强度
Fig. 2 Marine heatwave (MHW) events properties in the China offshore in 2019
a. MHW frequency; b. days of MHW; c. MHW mean intensity; d. MHW maximum intensity

图 3 2019年中国近海海洋热浪事件发生天数的四季变化
a. 春季;b. 夏季;c. 秋季;d. 冬季
Fig. 3 Days of marine heatwave events at all seasons in the China offshore in 2019
a. Spring; b. summer; c. autumn; d. winter
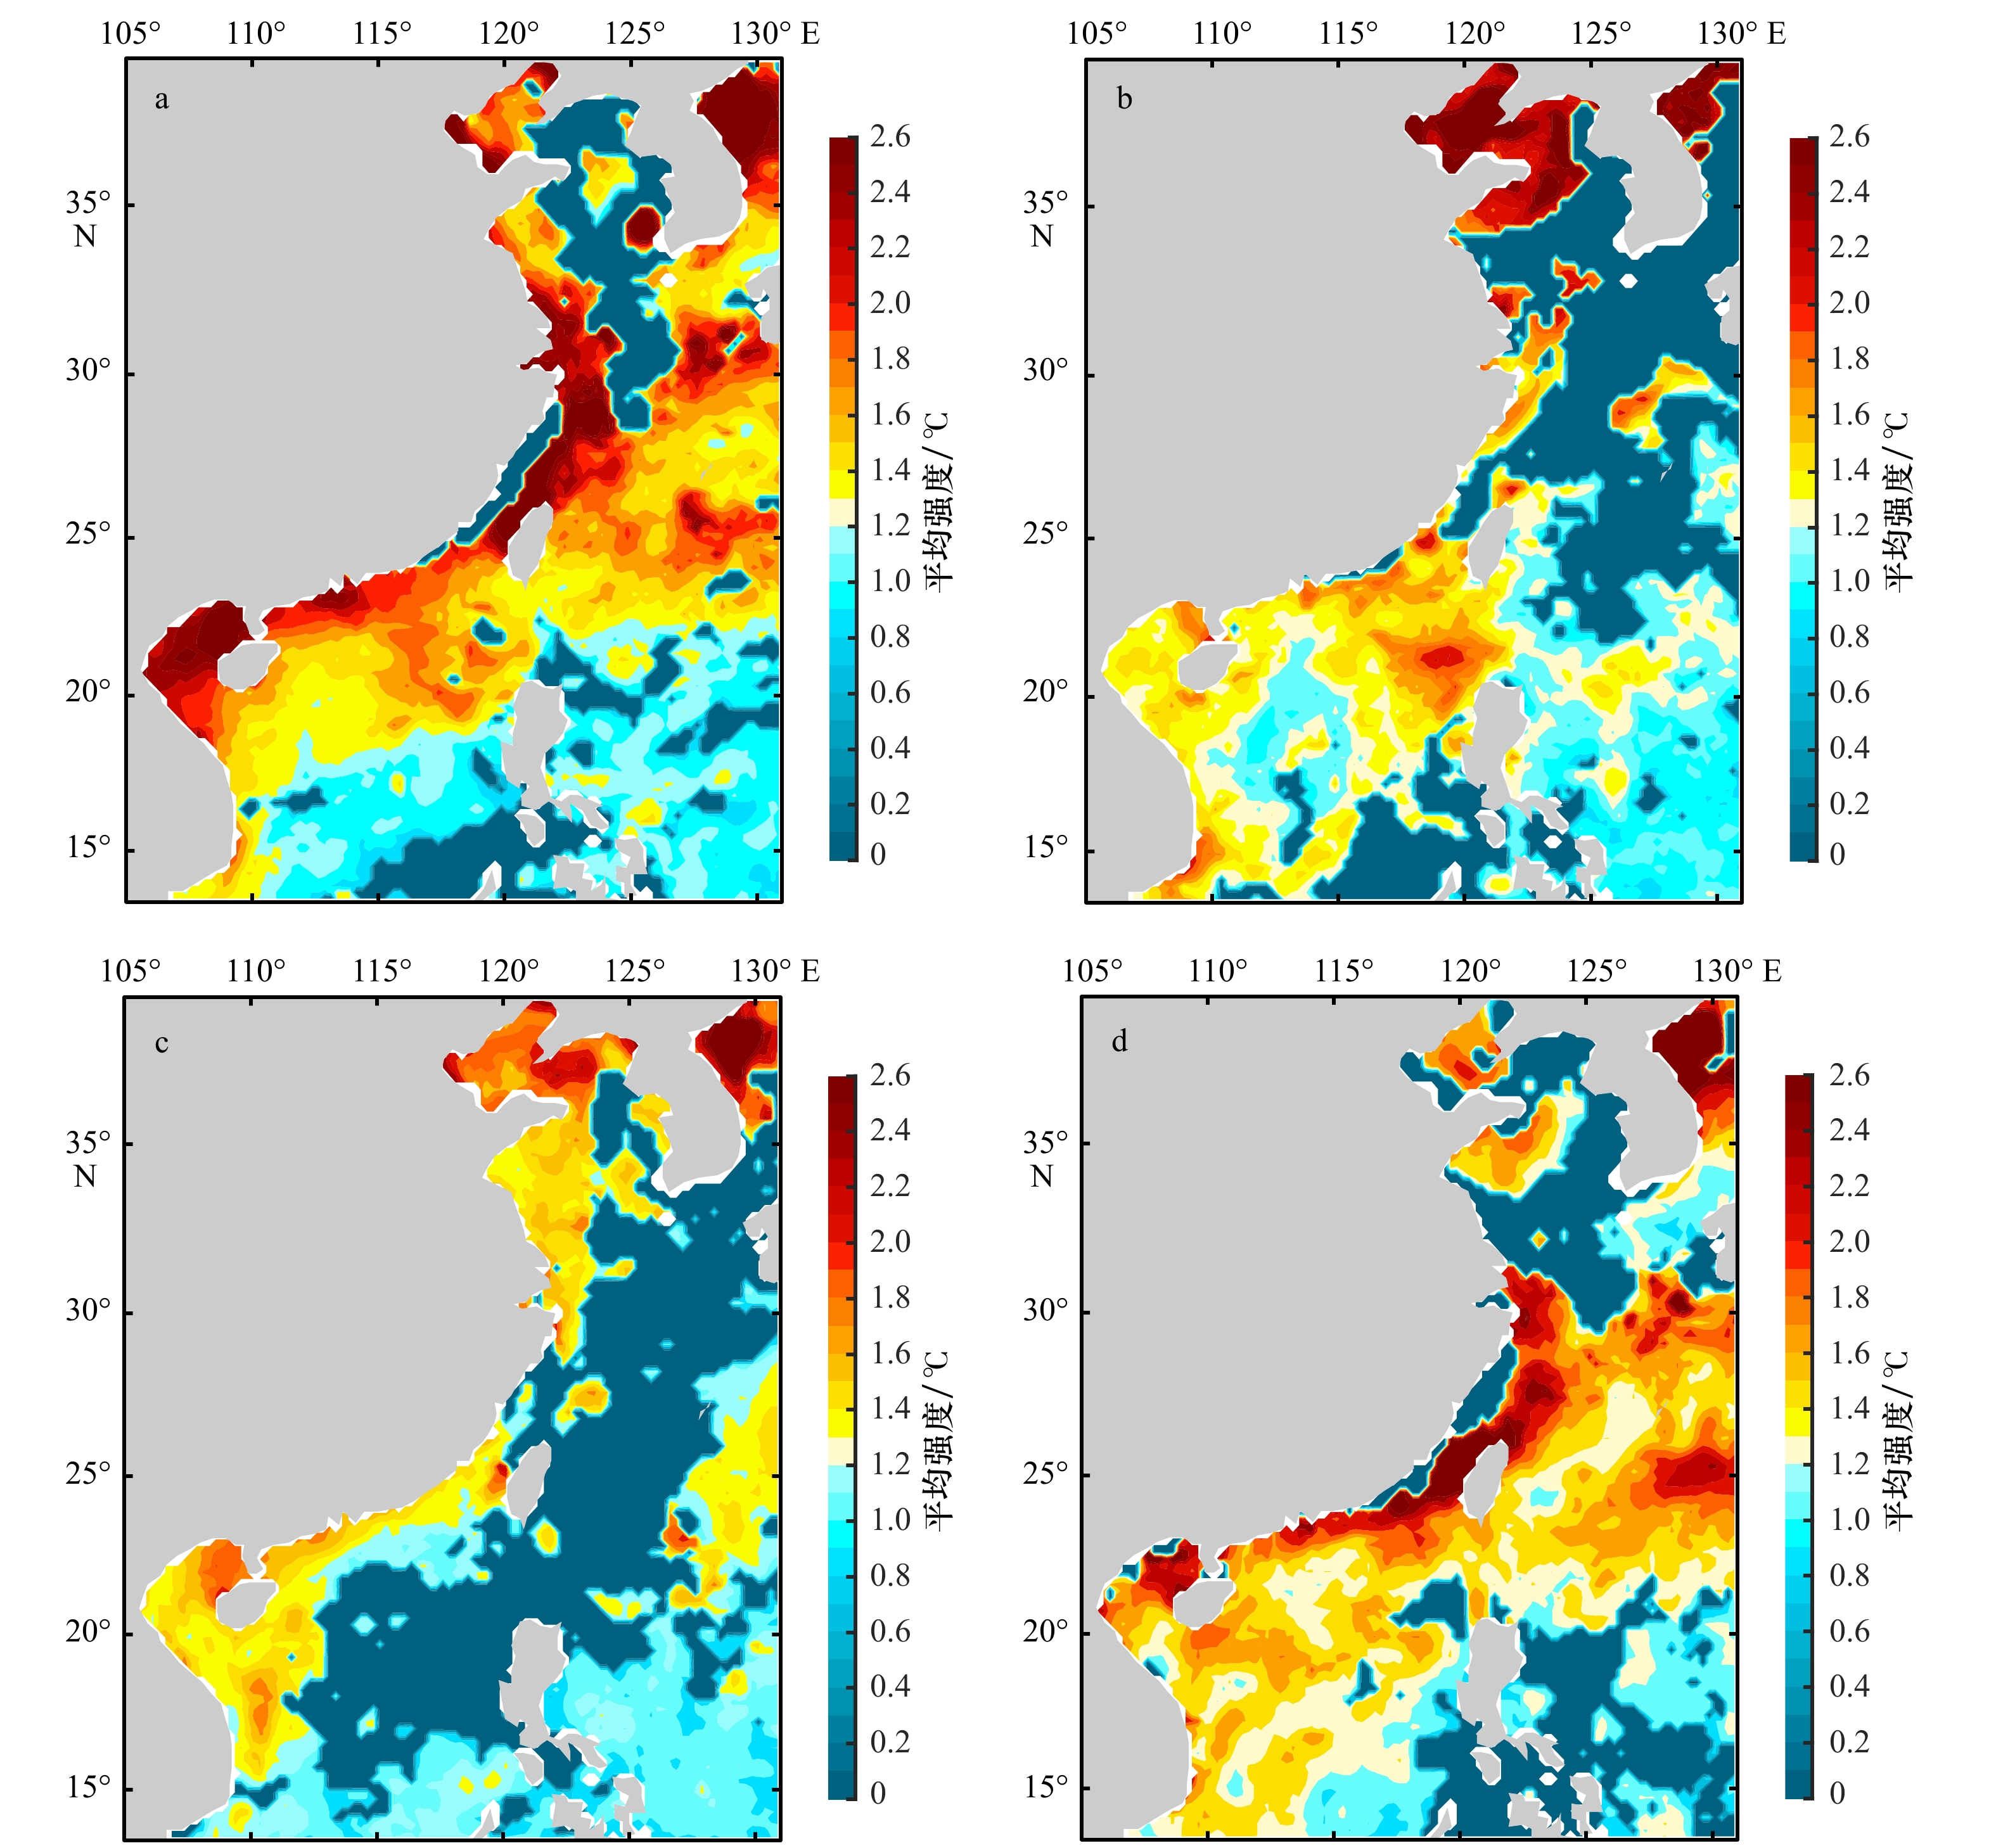
图 4 2019年中国近海海洋热浪事件平均强度四季变化
a. 春季;b. 夏季;c. 秋季;d. 冬季
Fig. 4 Marine heatwave events mean intensity at all seasons in the China offshore in 2019
a. Spring; b. summer; c. autumn; d. winter

图 5 2019年北部湾海洋热浪事件
东方海洋站(a)及其临近海域(c)OISST V2数据格点;涠洲海洋站(b)及其临近海域(d)OISST V2数据格点
Fig. 5 Marine heatwave events reported along the Beibu Gulf in 2019
Dongfang marine station (a) and the nearest ocean (c) pixel of the OISST V2; Weizhou marine station (b) and the nearest ocean (d) pixel of the OISST V2
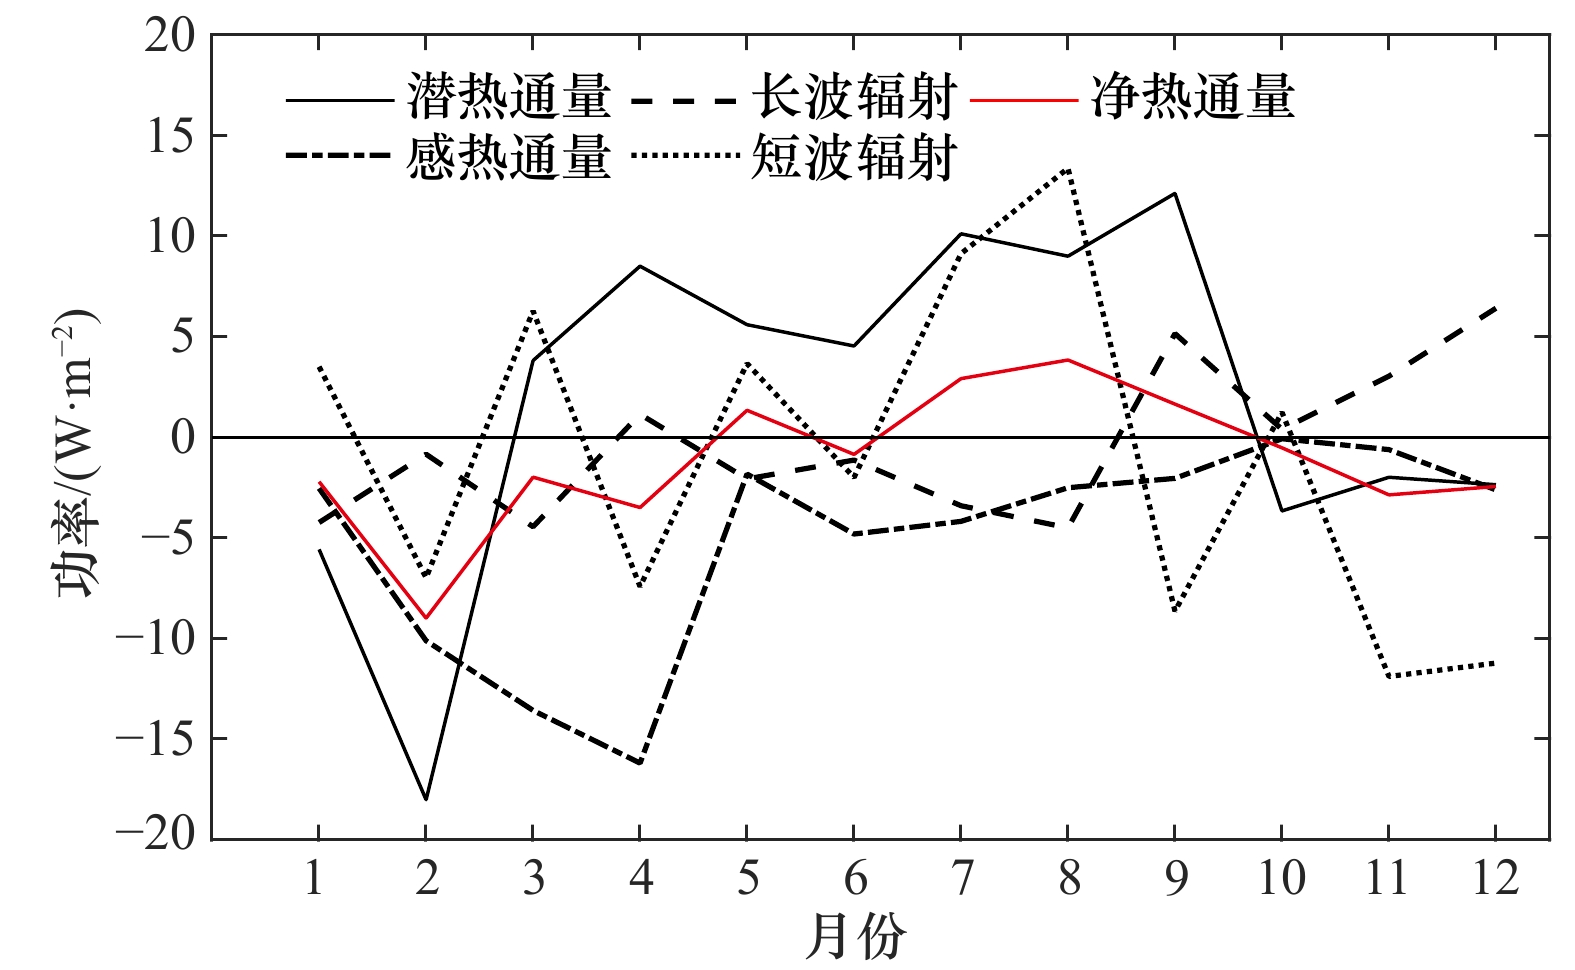
图 6 2019年北部湾净热通量异常变化(向上为正)
Fig. 6 Anomalous net heat flux at the Beibu Gulf in 2019 (upward is positive)
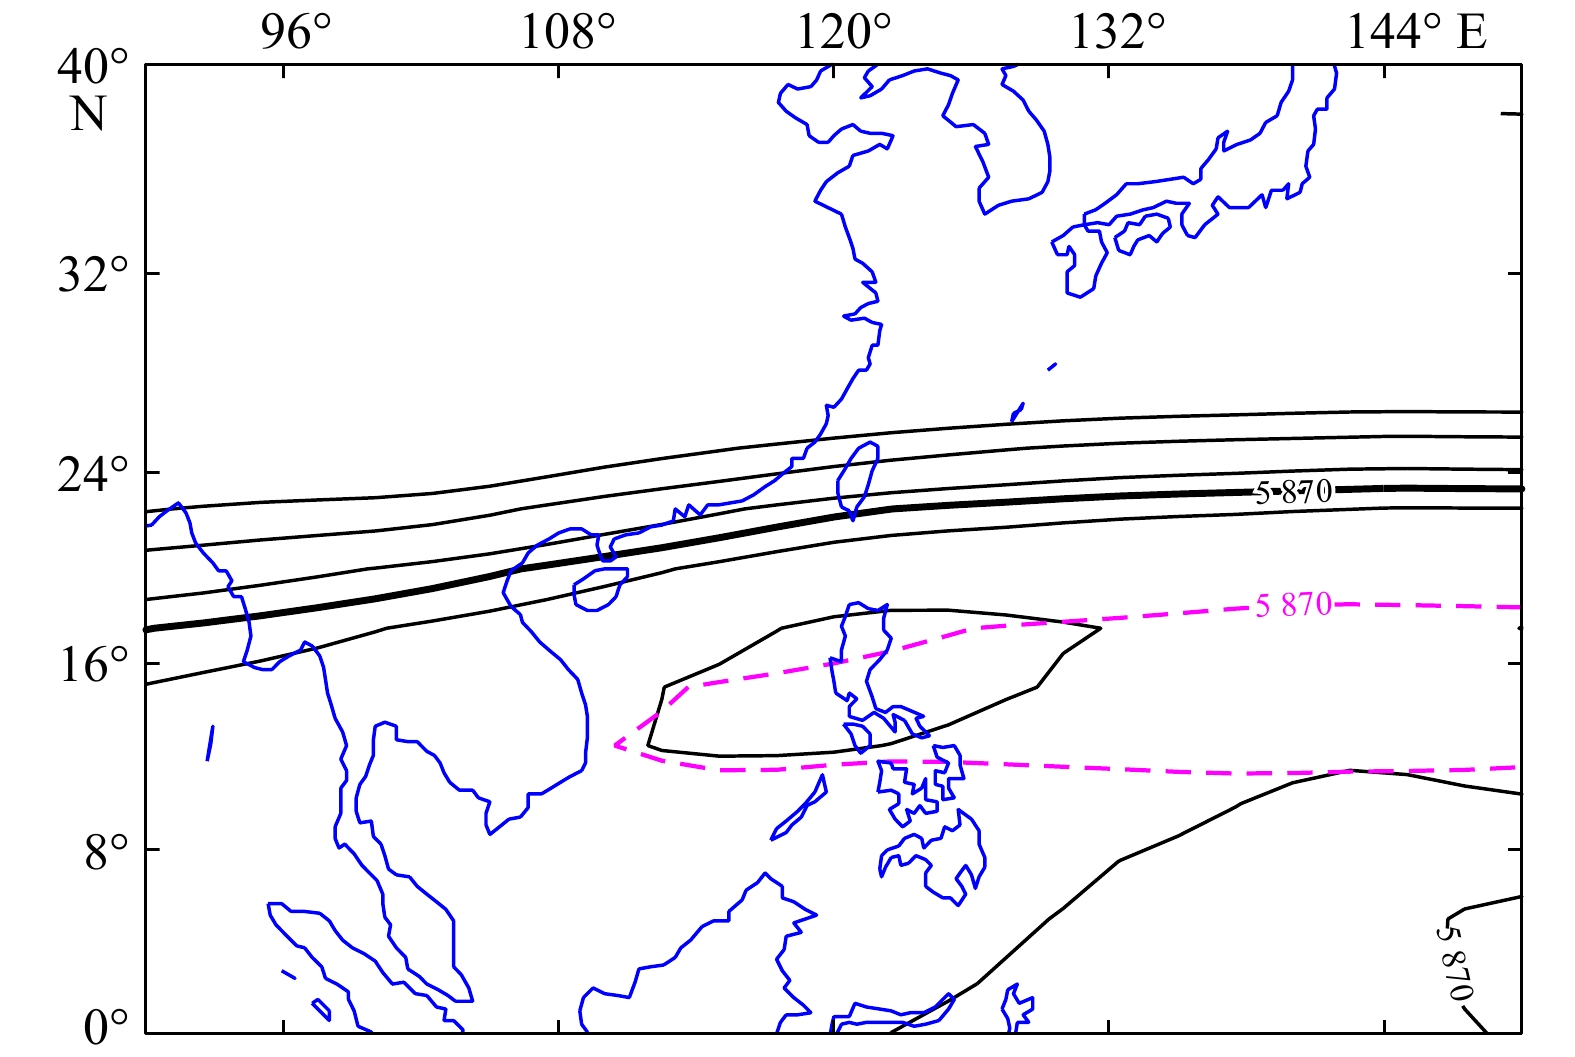
图 7 2019年2月西太平洋副高500 hPa位势高度
黑粗线为2019年5 870 位势米等值线;红虚线为1981–2010年气候态5 870 位势米等值线
Fig. 7 The 500 hPa potential height of Western Pacific subtropical high in February 2019
The black solid line indicates the isolines of 5 870 geopotential metre in 2019; the red dashed line indicates the climatic average isolines of 5 870 geopotential metre from 1981 to 2010
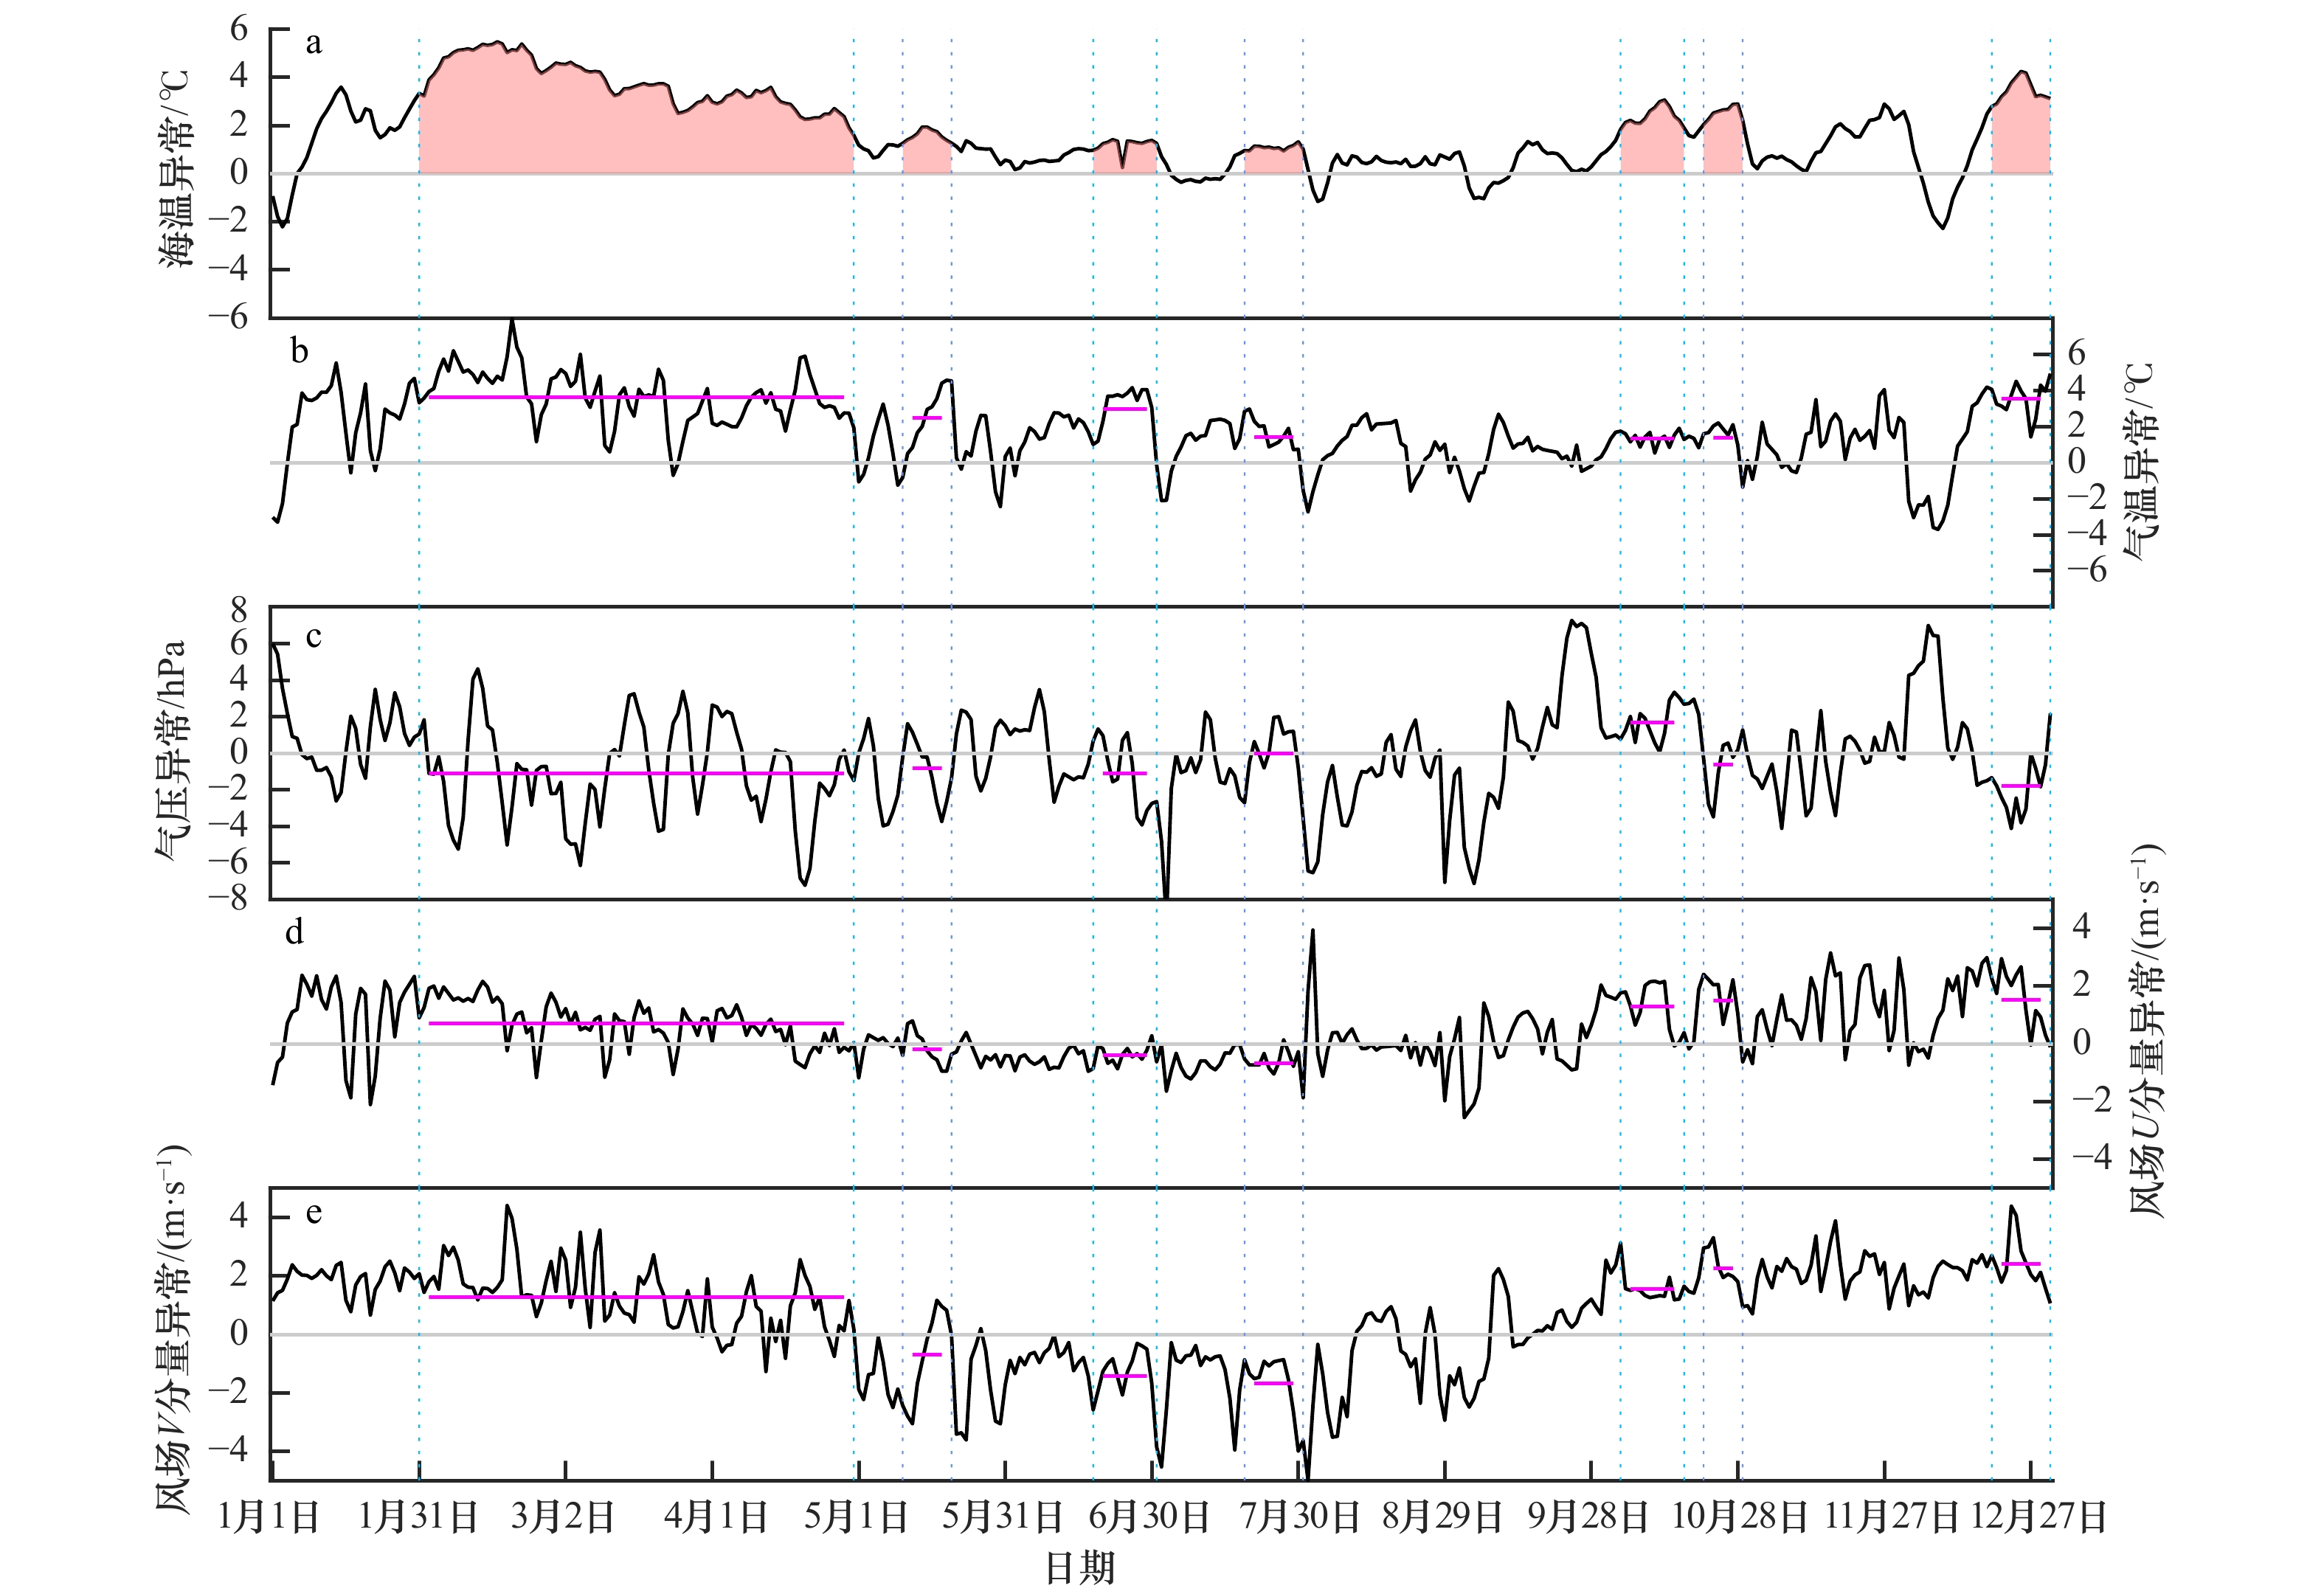
图 8 2019年海洋热浪事件发生时东方海洋站海洋气象要素变化
红色填充为识别的海洋热浪;蓝色虚线为海洋热浪起止时间;紫色实线为海洋热浪发生时相应要素异常的平均值
Fig. 8 Properties of ocean meteorological elements observed at Dongfang marine station during marine heatwave (MHW) events in 2019
The red area indicates MHW indentified; blue dashed lines show start and end of MHW; purple lines show mean elements anomaly during the MHW
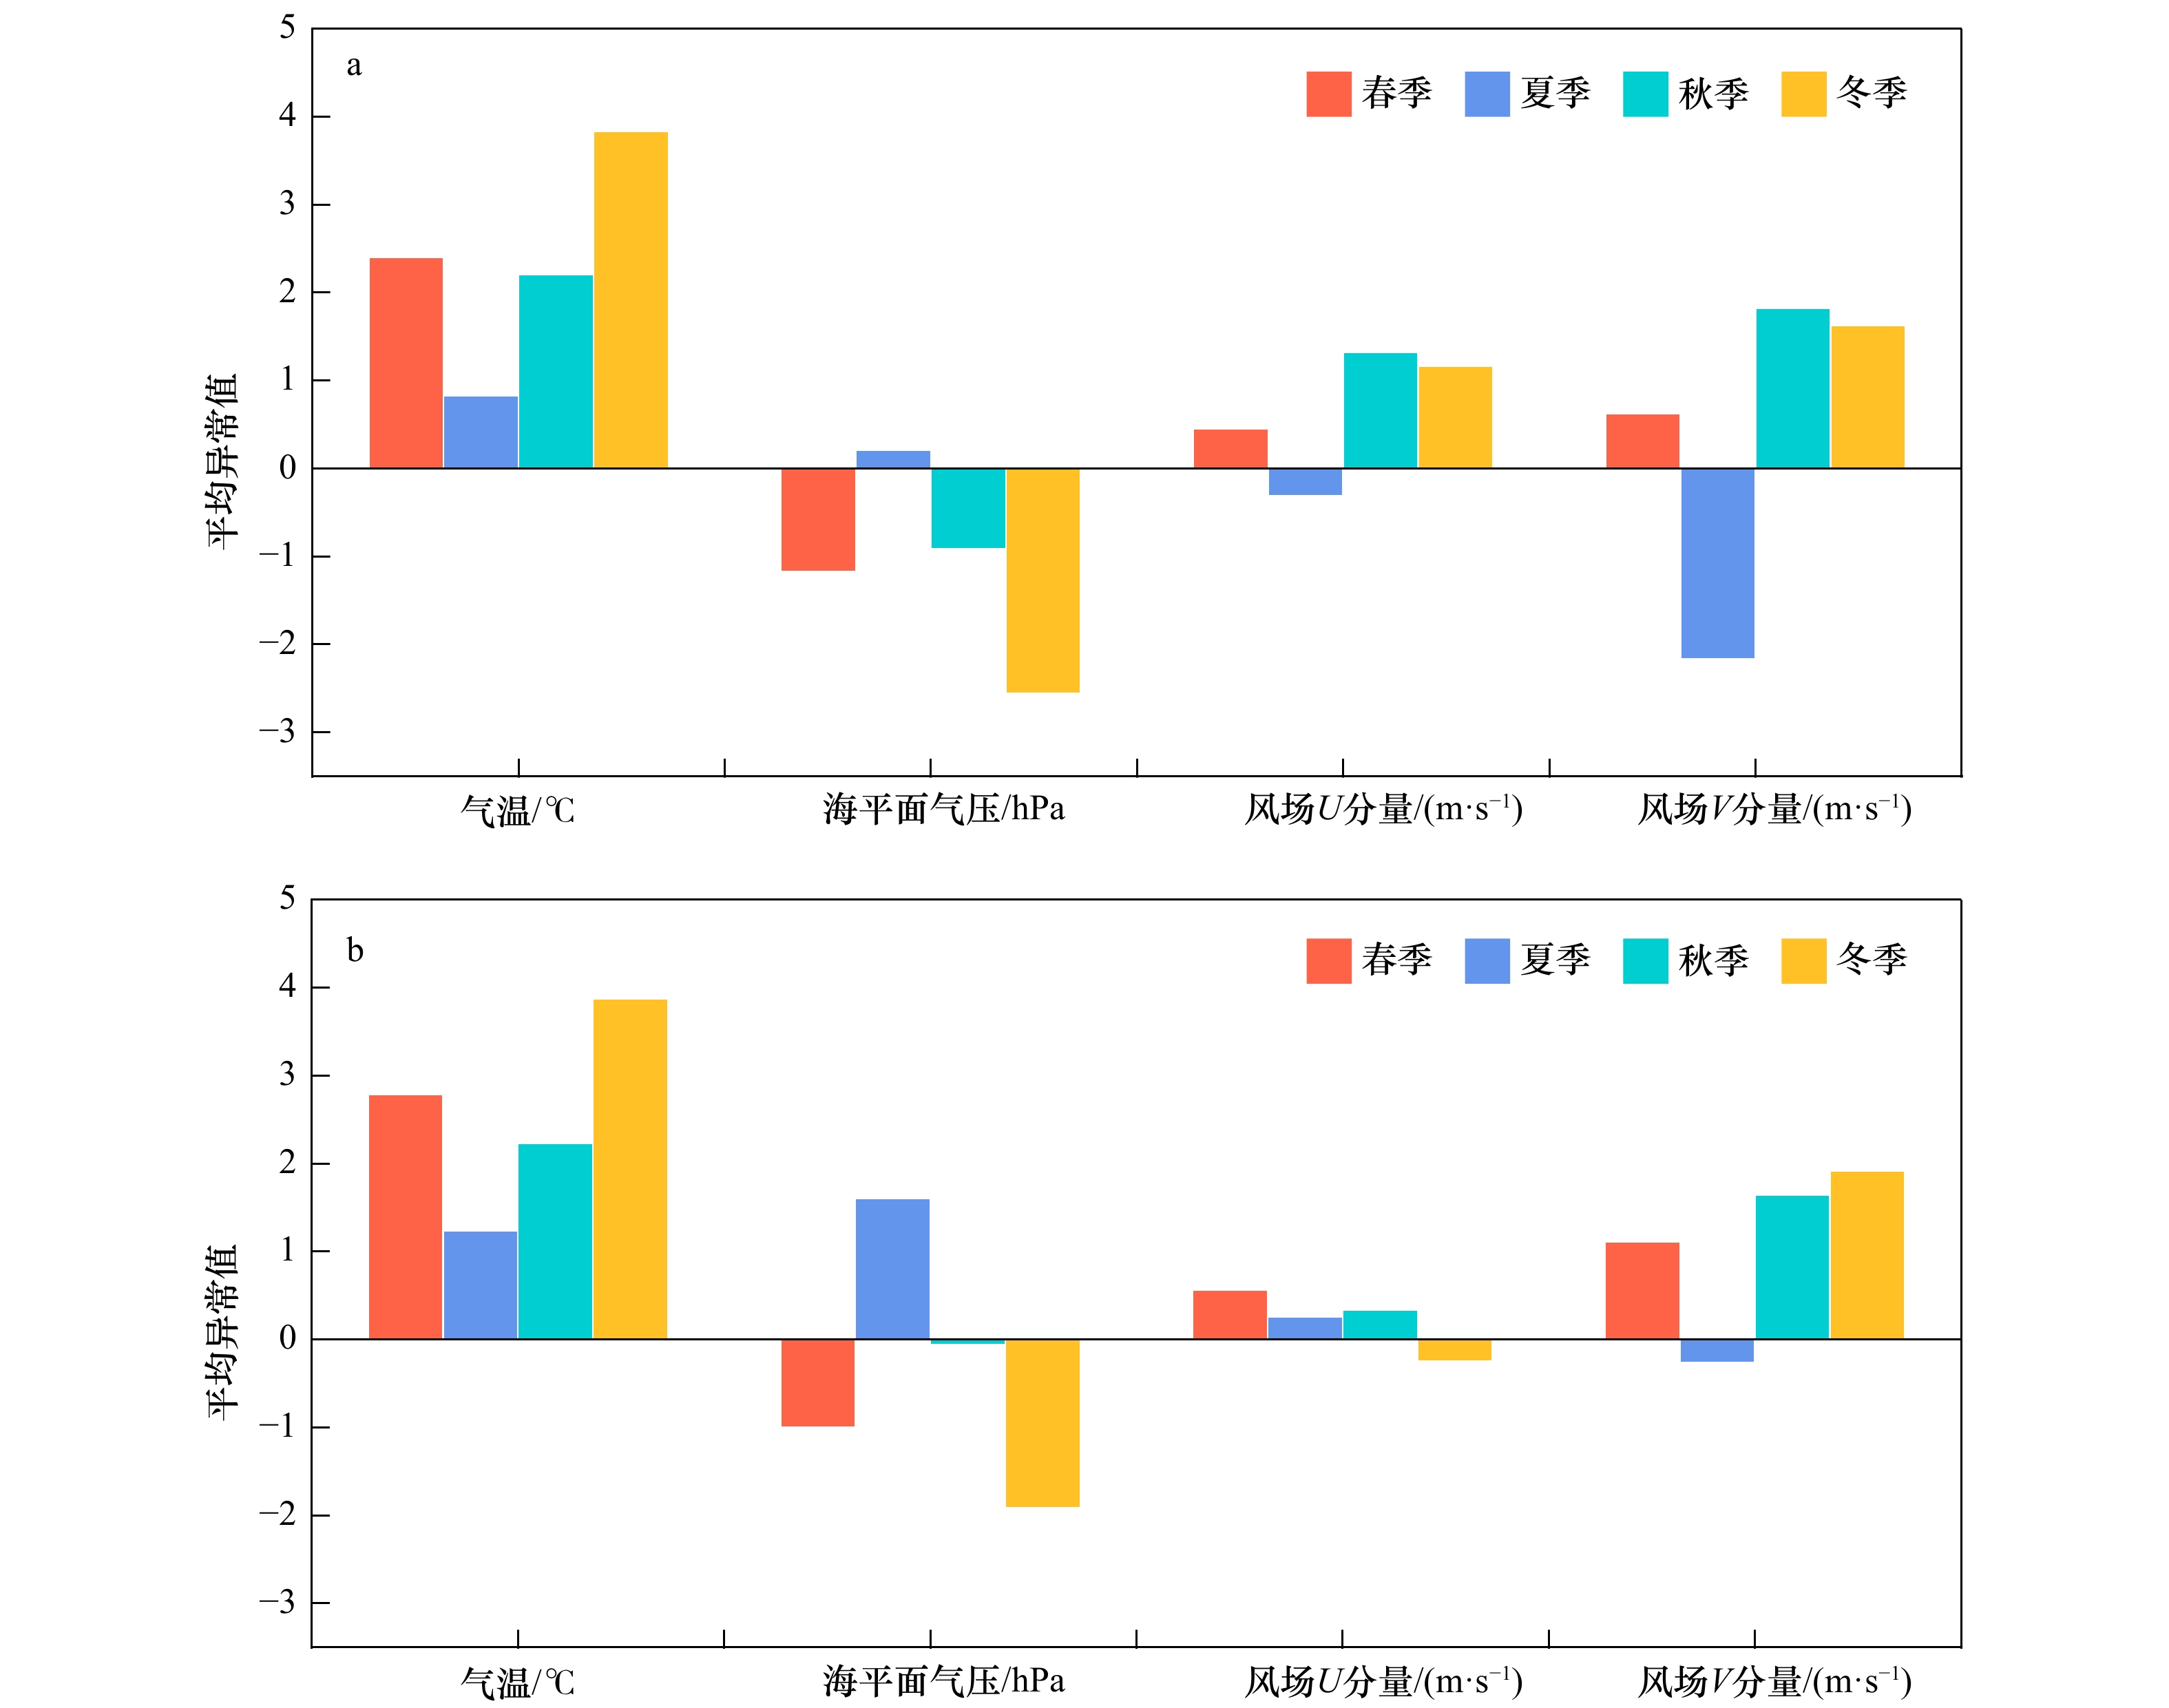
图 9 1980−2019年海洋热浪事件发生时海洋气象要素变化
a. 东方海洋站;b. 涠洲海洋站
Fig. 9 Properties of ocean meteorological elements during marine heatwave events from 1980 to 2019
a. Dongfang marine station; b. Weizhou marine station
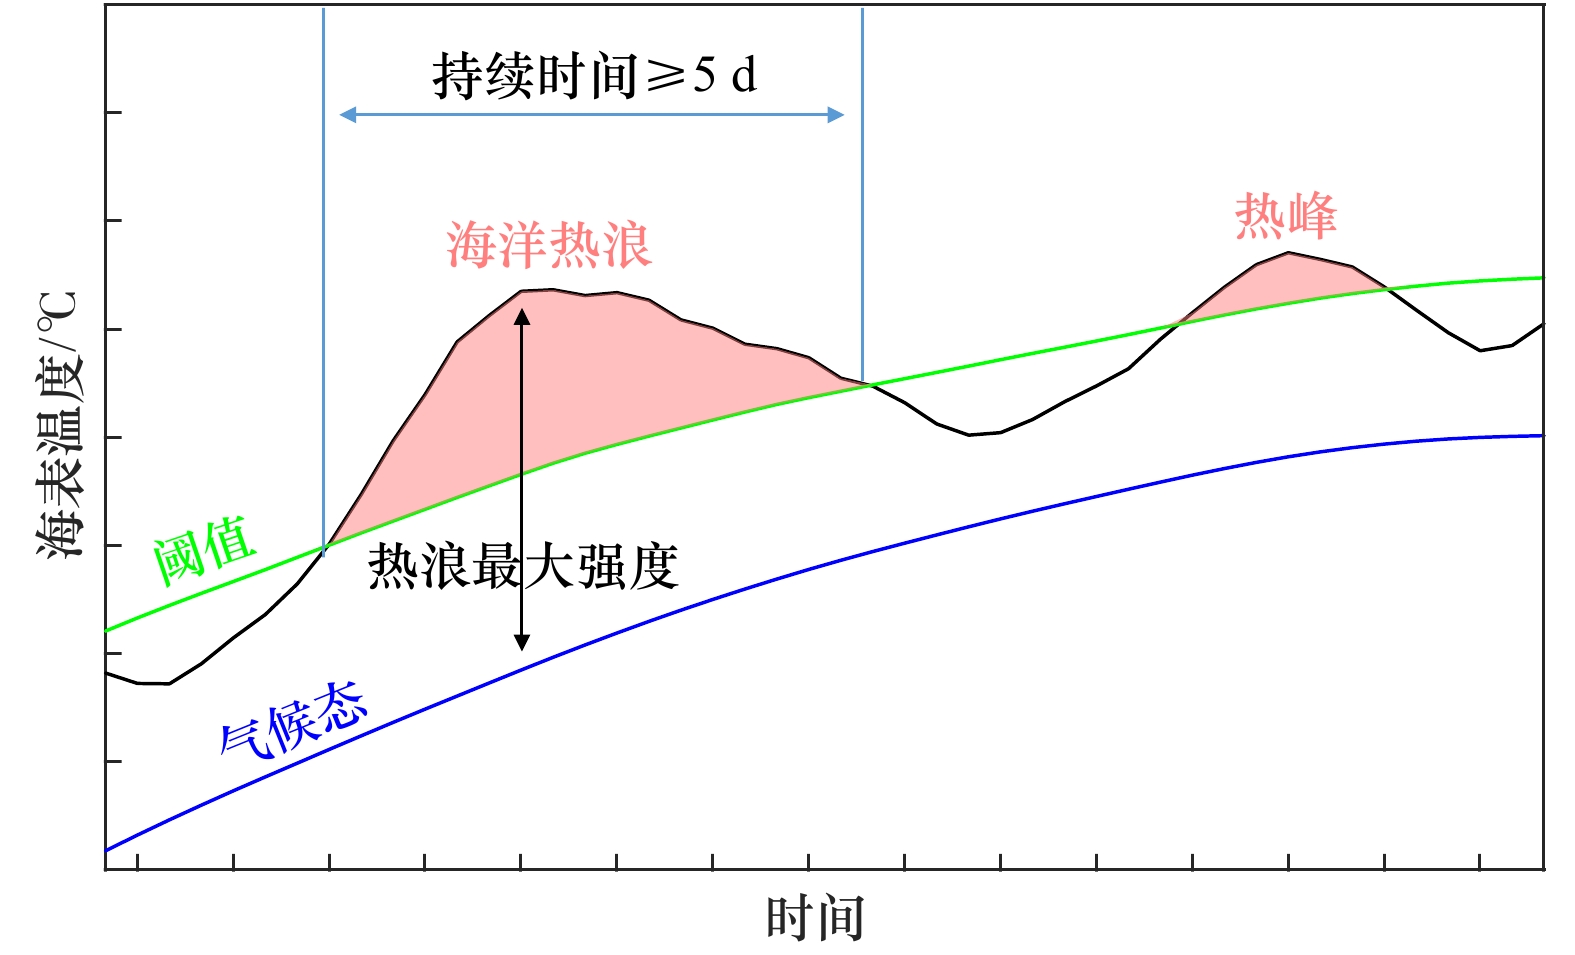
表 1 海洋热浪特征指标
Tab. 1 Characteristic index of marine heatwave
指标 定义 单位 Ts 海洋热浪起始的时间 d Te 海洋热浪结束的时间 d D 海洋热浪持续时间D=Te-Ts d imax 海洋热浪最大强度,即热浪期间温度异常的最大值 ℃ imean 海洋热浪平均强度,即热浪期间温度异常的平均值 ℃  下载: 导出CSV
表 2 所用海洋站数据信息
Tab. 2 Information of marine station’s data used
序号 海洋站 站代码 要素 时间范围 ① 涠洲 WZU 海温、气温、气压和风场 1980年1月至2019年12月 ② 东方 DFG 海温、气温、气压和风场 1980年1月至2019年12月
下载: 导出CSV
表 3 1980−2019年海洋热浪平均强度与各环境背景场的相关系数统计
Tab. 3 Statistics of correlation coefficient between marine heatwave mean intensity and environmental background fields during 1980−2019
季节 台站 气温 气压 U分量 V分量 春季 东方站 0.49* ‒0.25* 0.24* 0.35* 涠洲站 0.51* ‒0.43* 0.08 0.13 夏季 东方站 0.01 0.08 0.05 ‒0.12 涠洲站 0.47* ‒0.05 0.16 0.02 秋季 东方站 0.60* ‒0.49* 0.43* 0.42* 涠洲站 0.58* ‒0.36* ‒0.08 0.23* 冬季 东方站 0.48* ‒0.11 0.10 0.23* 涠洲站 0.36* 0.07 ‒0.03 0.18* 注:*表示通过95%显著性检验。
下载: 导出CSV
-
[1] Caputi N, Kangas M, Denham A, et al. Management adaptation of invertebrate fisheries to an extreme marine heat wave event at a global warming hot spot[J]. Ecology and Evolution, 2016, 6(11): 3583−3593. doi: 10.1002/ece3.2137 [2] Mills K E, Pershing A J, Brown C J, et al. Fisheries management in a changing climate: Lessons from the 2012 ocean heat wave in the Northwest Atlantic[J]. Oceanography, 2013, 26(2): 191−195. [3] Gentemann C L, Fewings M R, García-Reyes M, et al. Satellite sea surface temperatures along the West Coast of the United States during the 2014−2016 northeast Pacific marine heat wave[J]. Geophysical Research Letters, 2017, 44(1): 312−319. doi: 10.1002/2016GL071039 [4] Di Lorenzo E, Mantua N J. Multi-year persistence of the 2014/15 North Pacific marine heatwave[J]. Nature Climate Change, 2016, 6(11): 1042−1047. doi: 10.1038/nclimate3082 [5] Oliver E C J, Benthuysen J A, Bindoff N L, et al. The unprecedented 2015/16 Tasman Sea marine heatwave[J]. Nature Communications, 2017, 8(1): 16101. doi: 10.1038/ncomms16101 [6] Hughes T P, Kerry J T, Álvarez-Noriega M, et al. Global warming and recurrent mass bleaching of corals[J]. Nature, 2017, 543(7645): 373−377. doi: 10.1038/nature21707 [7] 李琰, 范文静, 骆敬新, 等. 2017年中国近海海温和气温气候特征分析[J]. 海洋通报, 2018, 37(3): 296−302.Li Yan, Fan Wenjing, Luo Jingxin, et al. Climatic characteristics of sea surface temperature and air temperature over the China Seas in 2017[J]. Marine Science Bulletin, 2018, 37(3): 296−302. [8] Li Yan, Ren Guoyu, Wang Qingyuan, et al. More extreme marine heatwaves in the China Seas during the global warming hiatus[J]. Environmental Research Letters, 2019, 14(10): 104010. doi: 10.1088/1748-9326/ab28bc [9] 齐庆华, 蔡榕硕, 颜秀花. 气候变化与我国海洋灾害风险治理探讨[J]. 海洋通报, 2019, 38(4): 361−367.Qi Qinghua, Cai Rongshuo, Yan Xiuhua. Discussion on climate change and marine disaster risk governance in the coastal China seas[J]. Marine Science Bulletin, 2019, 38(4): 361−367. [10] Hobday A J, Alexander L V, Perkins S E, et al. A hierarchical approach to defining marine heatwaves[J]. Progress in Oceanography, 2016, 141: 227−238. doi: 10.1016/j.pocean.2015.12.014 [11] Reynolds R W, Smith T M, Liu Chunying, et al. Daily high-resolution-blended analyses for sea surface temperature[J]. Journal of Climate, 2007, 20(22): 5473−5496. doi: 10.1175/2007JCLI1824.1 [12] 经志友, 齐义泉, 华祖林. 闽浙沿岸上升流及其季节变化的数值研究[J]. 河海大学学报(自然科学版), 2007, 35(4): 464−470.Jing Zhiyou, Qi Yiquan, Hua Zulin. Numerical study on upwelling and its seasonal variation along Fujian and Zhejiang coast[J]. Journal of Hohai University (Natural Sciences), 2007, 35(4): 464−470. [13] Smale D A, Wernberg T. Satellite-derived SST data as a proxy for water temperature in nearshore benthic ecology[J]. Marine Ecology Progress Series, 2009, 387: 27−37. doi: 10.3354/meps08132 [14] Ruthrof K X, Breshears D D, Fontaine J B, et al. Subcontinental heat wave triggers terrestrial and marine, multi-taxa responses[J]. Scientific Reports, 2018, 8(1): 13094. doi: 10.1038/s41598-018-31236-5 [15] McCabe R M, Hickey B M, Kudela R M, et al. An unprecedented coastwide toxic algal bloom linked to anomalous ocean conditions[J]. Geophysical Research Letters, 2016, 43(19): 10366−10376. [16] Hu Kaiming, Huang Gang, Qu Xia, et al. The impact of indian ocean variability on high temperature extremes across the southern Yangtze River valley in late summer[J]. Advances in Atmospheric Sciences, 2012, 29(1): 91−100. doi: 10.1007/s00376-011-0209-2 [17] Benthuysen J A, Oliver E C J, Feng Ming, et al. Extreme marine warming across tropical Australia during austral summer 2015−2016[J]. Journal of Geophysical Research: Oceans, 2018, 123(2): 1301−1326. doi: 10.1002/2017JC013326 [18] Oliver E C, Donat M G, Burrows M T, et al. Longer and more frequent marine heatwave over the past century[J]. Nature Communications, 2018, 9(1): 1324. doi: 10.1038/s41467-018-03732-9 [19] Tan Hongjian, Cai Rongshuo. What caused the record-breaking warming in East China Seas during August 2016?[J]. Atmospheric Science Letters, 2018, 19(10): e853. doi: 10.1002/asl.853 [20] 蔡榕硕, 陈际龙, 谭红建. 全球变暖背景下中国近海表层海温变异及其与东亚季风的关系[J]. 气候与环境研究, 2011, 16(1): 94−104.Cai Rongshuo, Chen Jilong, Tan Hongjian. Variations of the sea surface temperature in the offshore area of China and their relationship with the East Asian monsoon under the global warming[J]. Climatic and Environmental Research, 2011, 16(1): 94−104. [21] Cai Rongshuo, Tan Hongjian, Kontoyiannis H. Robust surface warming in offshore China seas and its relationship to the East Asian monsoon wind field and ocean forcing on inter-decadal time scales[J]. Journal of Climate, 2017, 30(22): 8987−9005. doi: 10.1175/JCLI-D-16-0016.1 [22] 蔡榕硕, 张启龙, 齐庆华. 南海表层水温场的时空特征与长期变化趋势[J]. 台湾海峡, 2009, 28(4): 559−568.Cai Rongshuo, Zhang Qilong, Qi Qinghua. Spatial and temporal oscillation and long-term variation in sea surface temperature field of the South China Sea[J]. Journal of Oceanography in Taiwan Strait, 2009, 28(4): 559−568. [23] Kelin S A, Soden B J, Lau N C. Remote sea surface temperature variations during ENSO: evidence for a tropical atmospheric bridge[J]. Journal of Climate, 1999, 12(4): 917−932. doi: 10.1175/1520-0442(1999)012<0917:RSSTVD>2.0.CO;2 [24] Qu Tangdong, Kim Y, Yaremchuk M, et al. Can Luzon strait transport play a role in conveying the impact of ENSO to the South China Sea?[J]. Journal of Climate, 2004, 17(18): 3644−3657. doi: 10.1175/1520-0442(2004)017<3644:CLSTPA>2.0.CO;2 [25] Zhang Renhe, Sumi A, Kimoto M. Impact of El Niño on the East Asian monsoon: A diagnostic study of the ’86/87 and ’91/92 events[J]. Journal of the Meteorological Society of Japan, 1996, 74(1): 49−62. doi: 10.2151/jmsj1965.74.1_49 [26] 自然资源部. 2019年中国海平面公报[EB/OL]. [2020-05-21]. 北京: 自然资源部. http://www.nmdis.org.cn/hygb/zghpmgb/2019nzghpmgb/.Ministry of Natural Resources. China sea level bulletin 2019[EB/OL]. [2020-05-21]. Beijing: Ministry of Natural Resources. http://www.nmdis.org.cn/hygb/zghpmgb/2019nzghpmgb/. [27] Zhou Tianjun, Yu Rucong, Zhang Jie, et al. Why the western Pacific subtropical high has extended westward since the late 1970s[J]. Journal of Climate, 2009, 22(8): 2199−2215. doi: 10.1175/2008JCLI2527.1 [28] 谭红建, 蔡榕硕. 2000年以来福州地区夏季极端高温的新特征及成因探讨[J]. 大气科学, 2015, 39(6): 1179−1190.Tan Hongjian, Cai Rongshuo. New characteristics of heat extremes in Fuzhou Since 2000 and the possible causes[J]. Chinese Journal of Atmospheric Sciences, 2015, 39(6): 1179−1190. [29] Oliver E C J, Burrows M T, Donat M G, et al. Projected marine heatwaves in the 21st century and the potential for ecological impact[J]. Frontiers in Marine Science, 2019, 6: 734. doi: 10.3389/fmars.2019.00734 [30] Oliver E C J. Mean warming not variability drives marine heatwave trends[J]. Climate Dynamics, 2019, 53(3): 1653−1659. [31] Cheng Lijing, Abraham J, Zhu Jiang, et al. Record-setting ocean warmth continued in 2019[J]. Advances in Atmospheric Sciences, 2020, 37(2): 137−142. doi: 10.1007/s00376-020-9283-7 -

计量
- 文章访问数: 1449
- HTML全文浏览量: 615
- PDF下载量: 184
- 被引次数: 0
