

Improvement of marine environment feature extraction based on deep convolution embedded clustering (DCEC) for fishery forecast modelA case study of bigeye tuna (Thunnus obesus) in the Southwest Indian Ocean
-
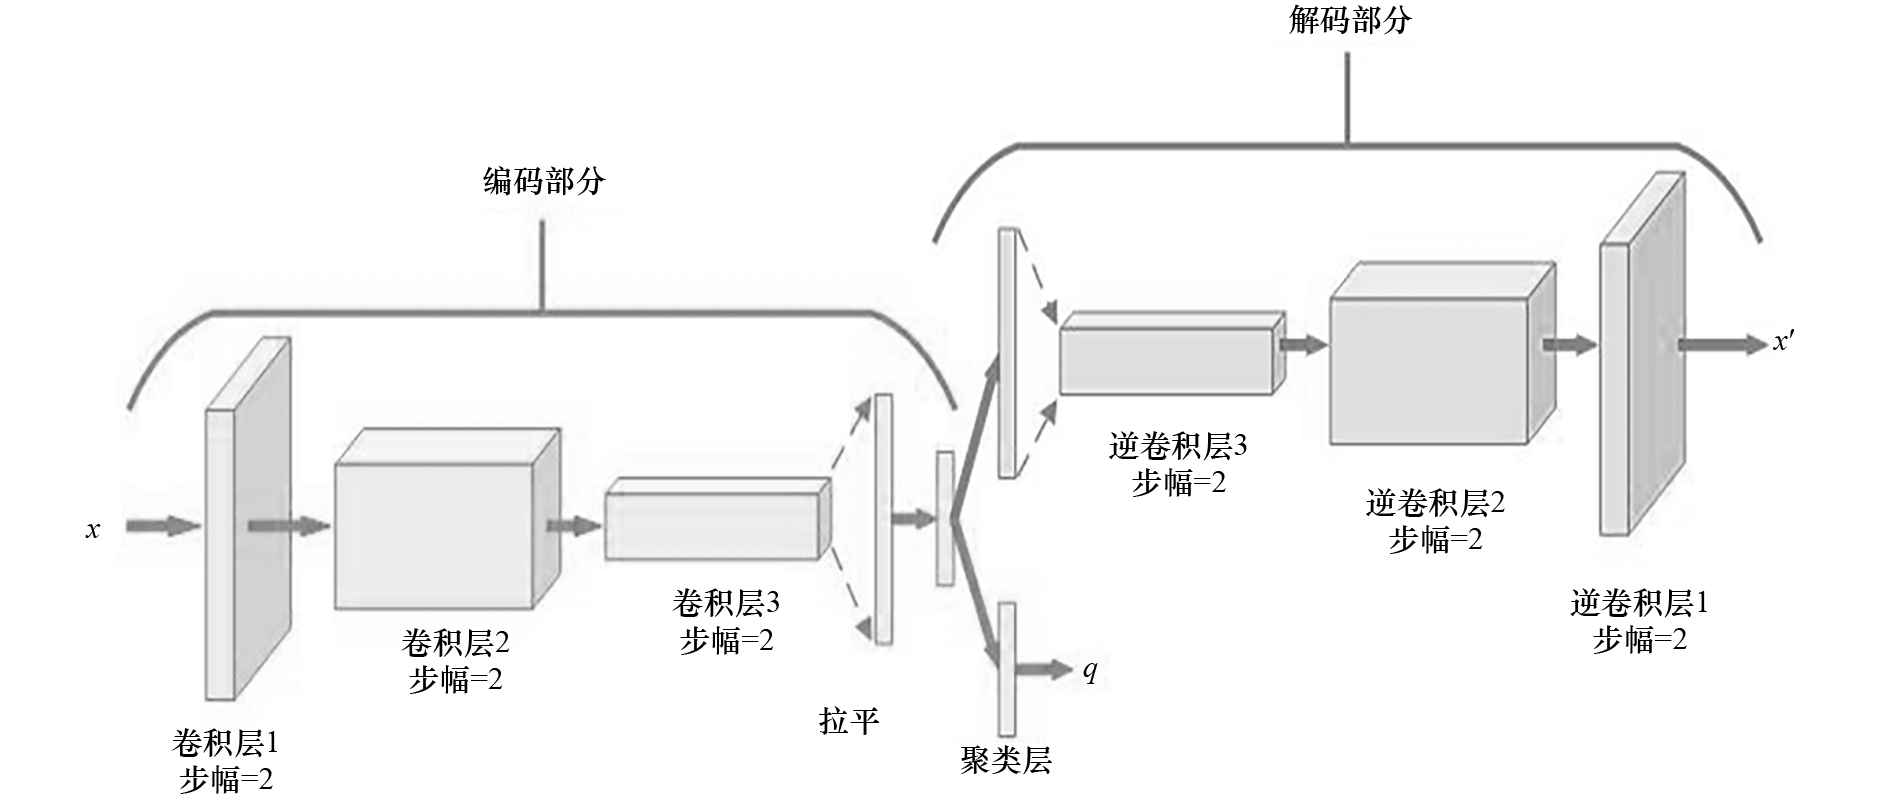
摘要: 为提高大眼金枪鱼(Thunnus obesus)延绳钓渔情预报模型的预测能力,本研究提出了一种基于深度卷积嵌入式聚类(DCEC)的海洋环境时空特征提取方法,结合广义可加模型(GAM)对西南印度洋大眼金枪鱼延绳钓渔场进行预报。采用2018年1−12月0.041 6°×0.041 6°的MODIS-Aqua和MODIS-Terra海表面温度三级反演图像数据(以日为单位)构建DCEC模型,基于Davies-Bouldi 指数(DBI)确定最佳聚类数,在此基础上提取各月海表温度(SST)的类别特征值
$ {F}_{M} $ ;采用美国国家海洋和大气管理局网站2018年1−12月1°×1°的Chl a浓度月平均值作为辅助环境特征因子;采用印度洋金枪鱼委员会2018年1−12月1°×1°的大眼金枪鱼延绳钓渔业数据(以月为单位),计算单位捕捞努力量渔获量(CPUE);将SST月类别特征值$ {F}_{M} $ 、Chl a浓度月平均值与CPUE数据进行时空匹配,构建改进GAM;采用SST月平均值、Chl a浓度月平均值与CPUE数据构建基础GAM;采用联合假设检验($ F $ 检验)验证模型解释变量对响应变量的影响;采用赤池信息准则(AIC)、均方误差(MSE)、绘制实测值和预测值的散点图并计算相关系数r,分析改进GAM相比于基础GAM的提升效果。实验结果表明:(1)基于DCEC模型提取的$ {F}_{M} $ 能够较好地反映西南印度洋海表温度的时空动态特征与规律,并与西南印度洋的气候条件、季风状况和水文特征等相互耦合;(2)$ {F}_{M} $ 相比SST平均值的因子解释率更高,对大眼金枪鱼CPUE影响更为显著,高渔获率集中在暖冷流交汇区域;(3)改进GAM相比基础GAM的AIC值降低了9.17%,MSE降低了26.7%,散点图显示改进GAM预测的CPUE对数值与实测CPUE对数值的相关性较显著,r为0.60。本研究证明了DCEC模型在海洋环境特征提取方面的有效性,可为后序大眼金枪鱼延绳钓渔情预报模型的改进研究提供参考。Abstract: In order to improve the forecasting ability of the fishery forecast model for the longline bigeye tuna (Thunnus obesus), we proposed a marine environment feature extraction method based on deep convolutional embedded clustering (DCEC), combined with generalized additive model (GAM) for forecasting the longline bigeye tuna fishing grounds in the Southwest Indian Ocean. We used the MODIS-Aqua and MODIS-Terra sea surface temperature (SST) three-level inversion image data (in days) from January to December in 2018 at 0.041 6°×0.041 6° to construct a DCEC model, determined the optimal number of clusters based on the Davies-Bouldi index (DBI), and extracted the category feature value (FM) of each month’s sea surface temperature (SST); we used monthly 1°×1° bigeye tuna longline fishery data from January to December in 2018 generated from the Indian Ocean Tuna Commission (IOTC), and calculated the catch per unit effort (CPUE); we matched the monthly category feature value FM and the monthly average value of Chl a concentration with the CPUE data to construct an improved GAM; we matched the monthly average SST, the monthly average Chl a concentration and CPUE data to build a basic GAM; we used the joint hypothesis test (F test) to verify the influence of model explanatory variables; we used akaike information criterion (AIC), mean square error (MSE), and draw the frequency distribution diagrams and box diagrams of measured and predicted values, etc., to analysis the improvement effect of the improved GAM compared to the basic GAM. The results showed that: (1) the category feature value (FM) extracted based on the DCEC model could better reflect the temporal and spatial dynamic characteristics of SST in the Southwest Indian Ocean, and was related with the climatic conditions, monsoon conditions, and hydrological characteristics in the Southwest Indian Ocean; (2) the factor interpretation of FM was higher than that of the monthly average SST in GAM, which means FM had more significant impact on the CPUE of bigeye tuna. The high catch rate was concentrated in the areas where the FM category was 2, 10, 24 with intersections between the warm and cold currents; (3) the AIC of the improved GAM was reduced by 9.17% than that of the basic GAM and MSE of the improved GAM was reduced by 26.7% than that of the basic GAM; the frequency distribution of the CPUE logarithmic value predicted by the improved GAM was closer to the normal distribution, and the high frequency distribution interval was closer to that of the measured value; the scatter plot showed that the CPUE predicted by the improved GAM had a significant correlation with the measured CPUE, with r equaled to 0.60. This study proves the effectiveness of the DCEC model in extracting marine environmental features, and can provide a reference for the further study on the bigeye tuna fishery forecast. -
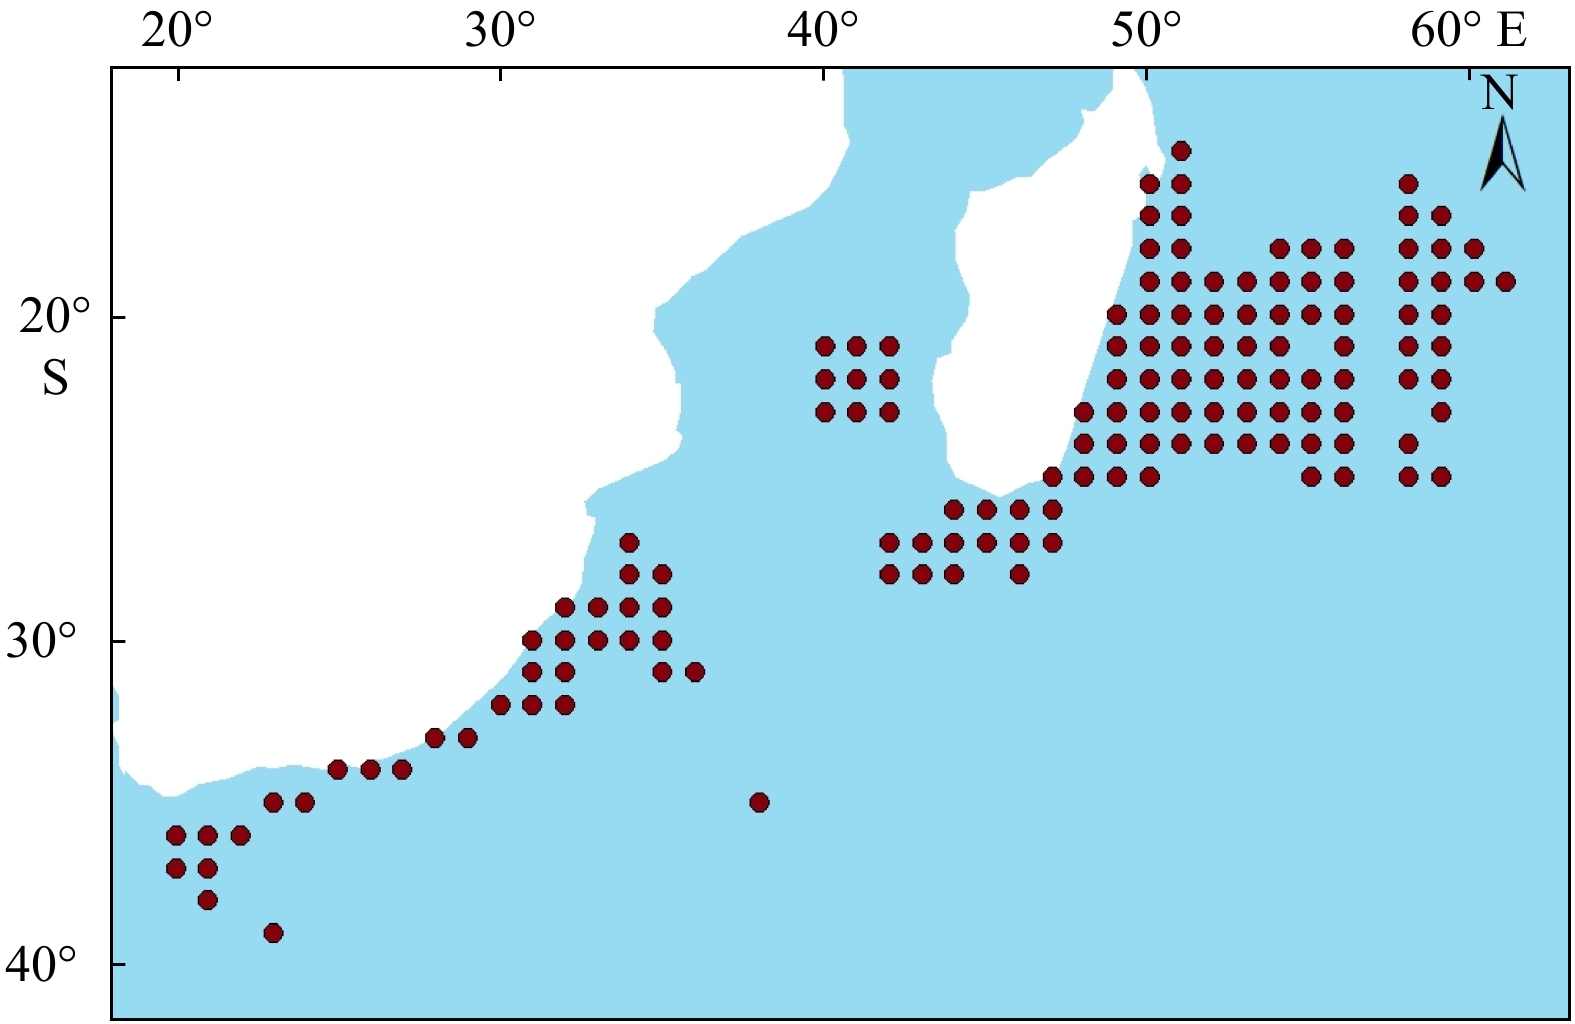
图 1 IOTC 2018年1−12月 1°×1° 西南印度洋大眼金枪鱼延绳钓统计数据分布点
Fig. 1 The distribution of the longline bigeye tuna fishery data in the Southwest Indian Ocean in 1°×1° from January to December, 2018 downloaded from IOTC

图 4 DCEC模型聚类个数对应的DBI曲线
Fig. 4 The curve of DBI corresponding to the number of clusters in the DCEC model
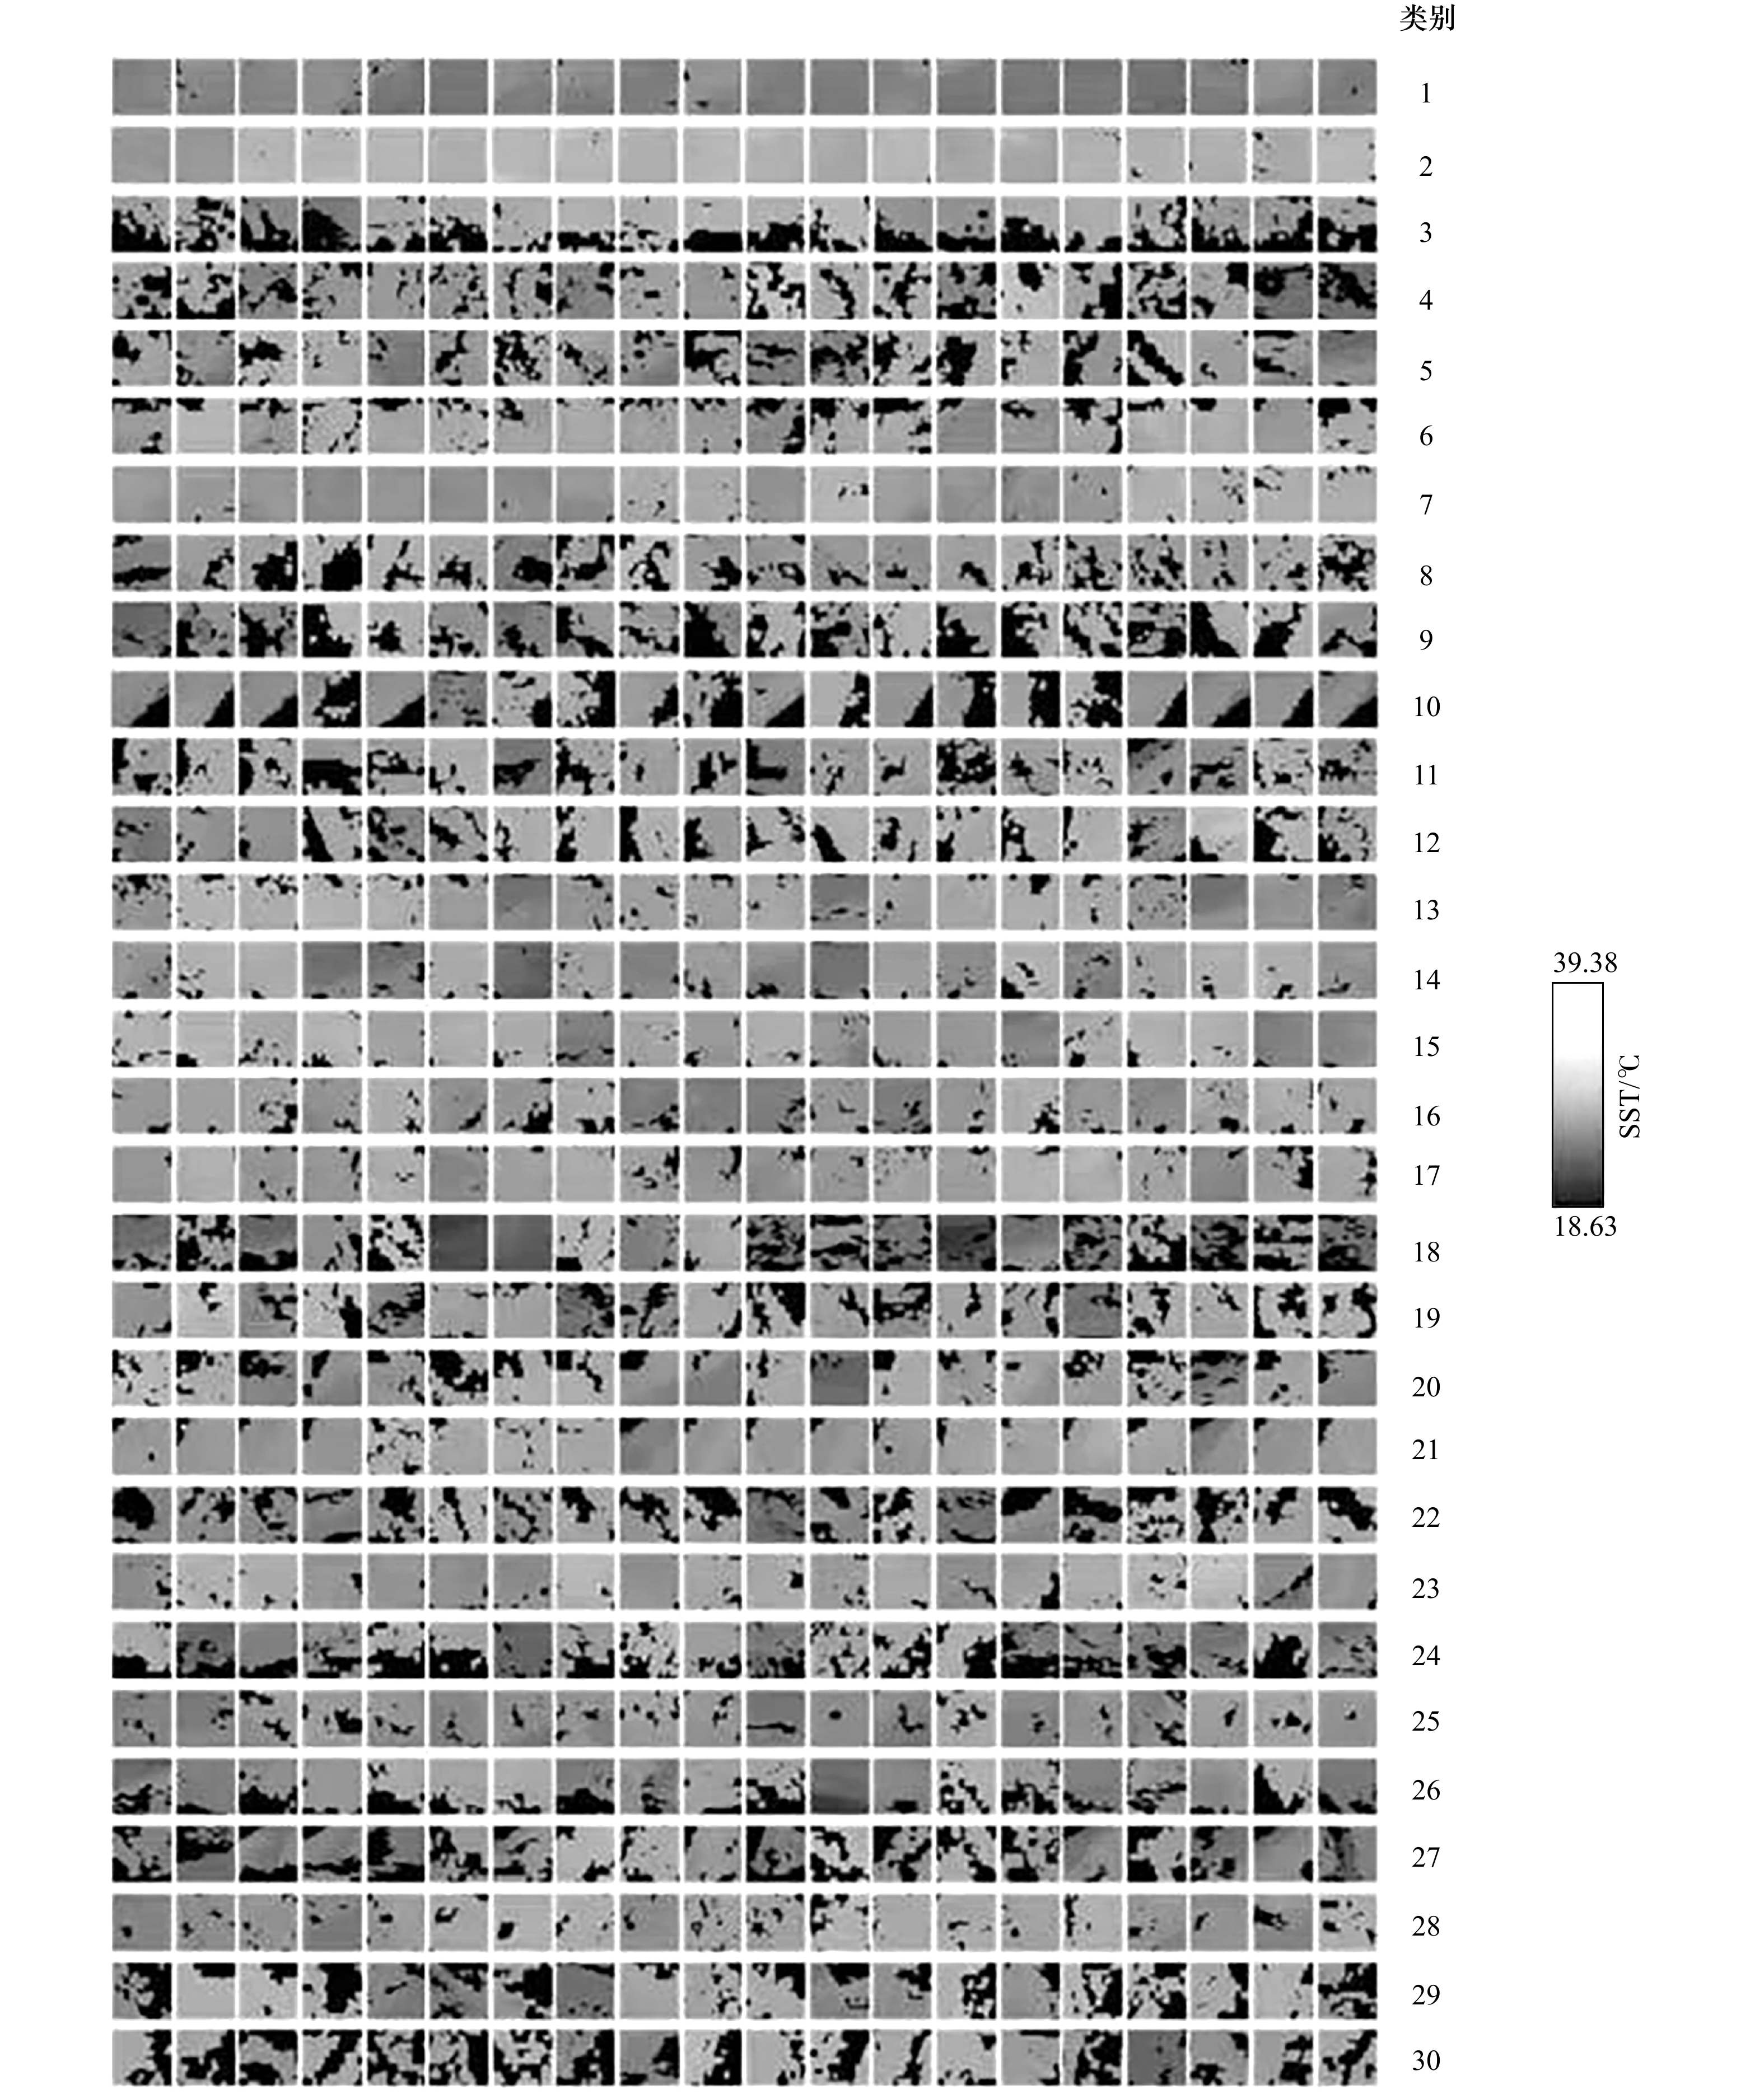
图 5 基于DCEC模型的SST图像聚类结果(每一类随机选取20张图片)
Fig. 5 The clustering results of SST images based on the DCEC model (20 images are randomly selected for each category)
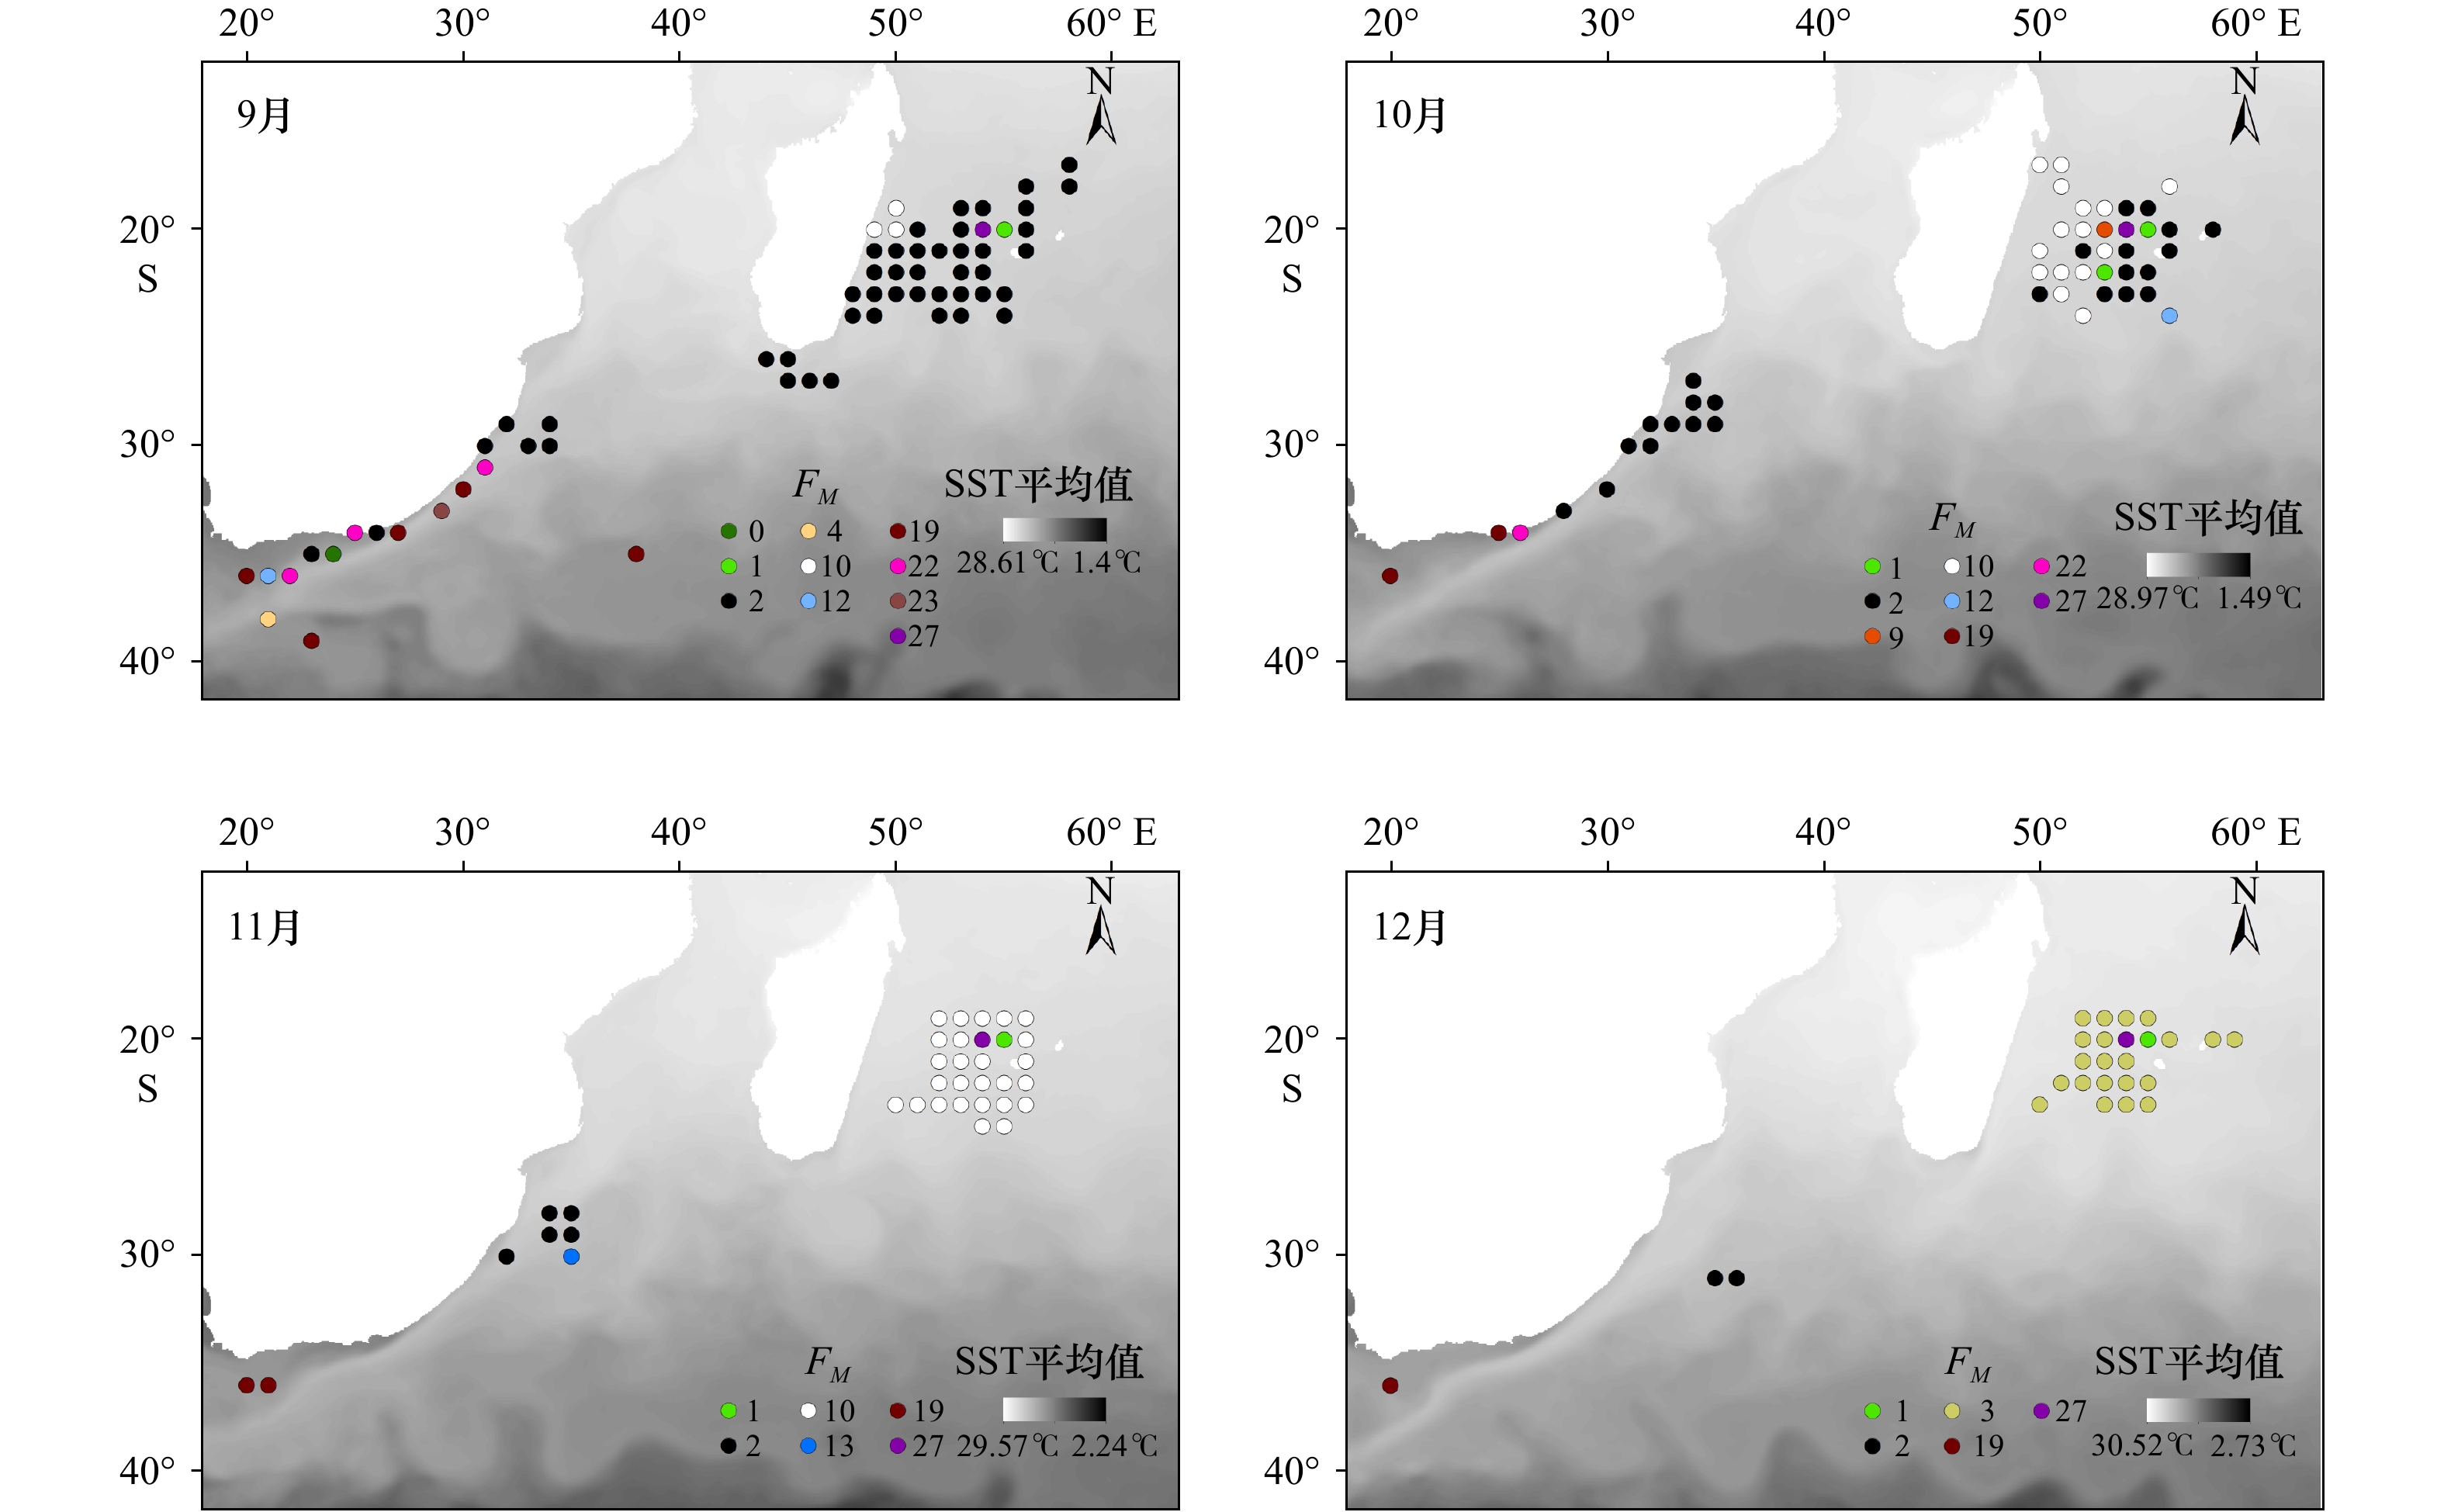
6 2018年1−12月各月渔场CPUE对应的月SST类别特征值
$ {F}_{M} $ 与月SST平均值6 SST category feature
$ {F}_{M} $ corresponding to the fishery CPUE in each month and monthly average SST from January to December, 2018
图 7 基础GAM的SST平均值(a)、改进GAM的月SST类别特征值FM(b)与CPUE的关系曲线
纵轴表示模型对CPUE的平滑函数值,6.74和8.55表示自由度
Fig. 7 The relationship curve between the monthly average SST and CPUE in the basic GAM (a), and the SST category feature
$ {F}_{M} $ and CPUE in the improved GAM (b)The ordinate represents the smoothing function value of the model to CPUE, 6.74 and 8.55 represent the free degree
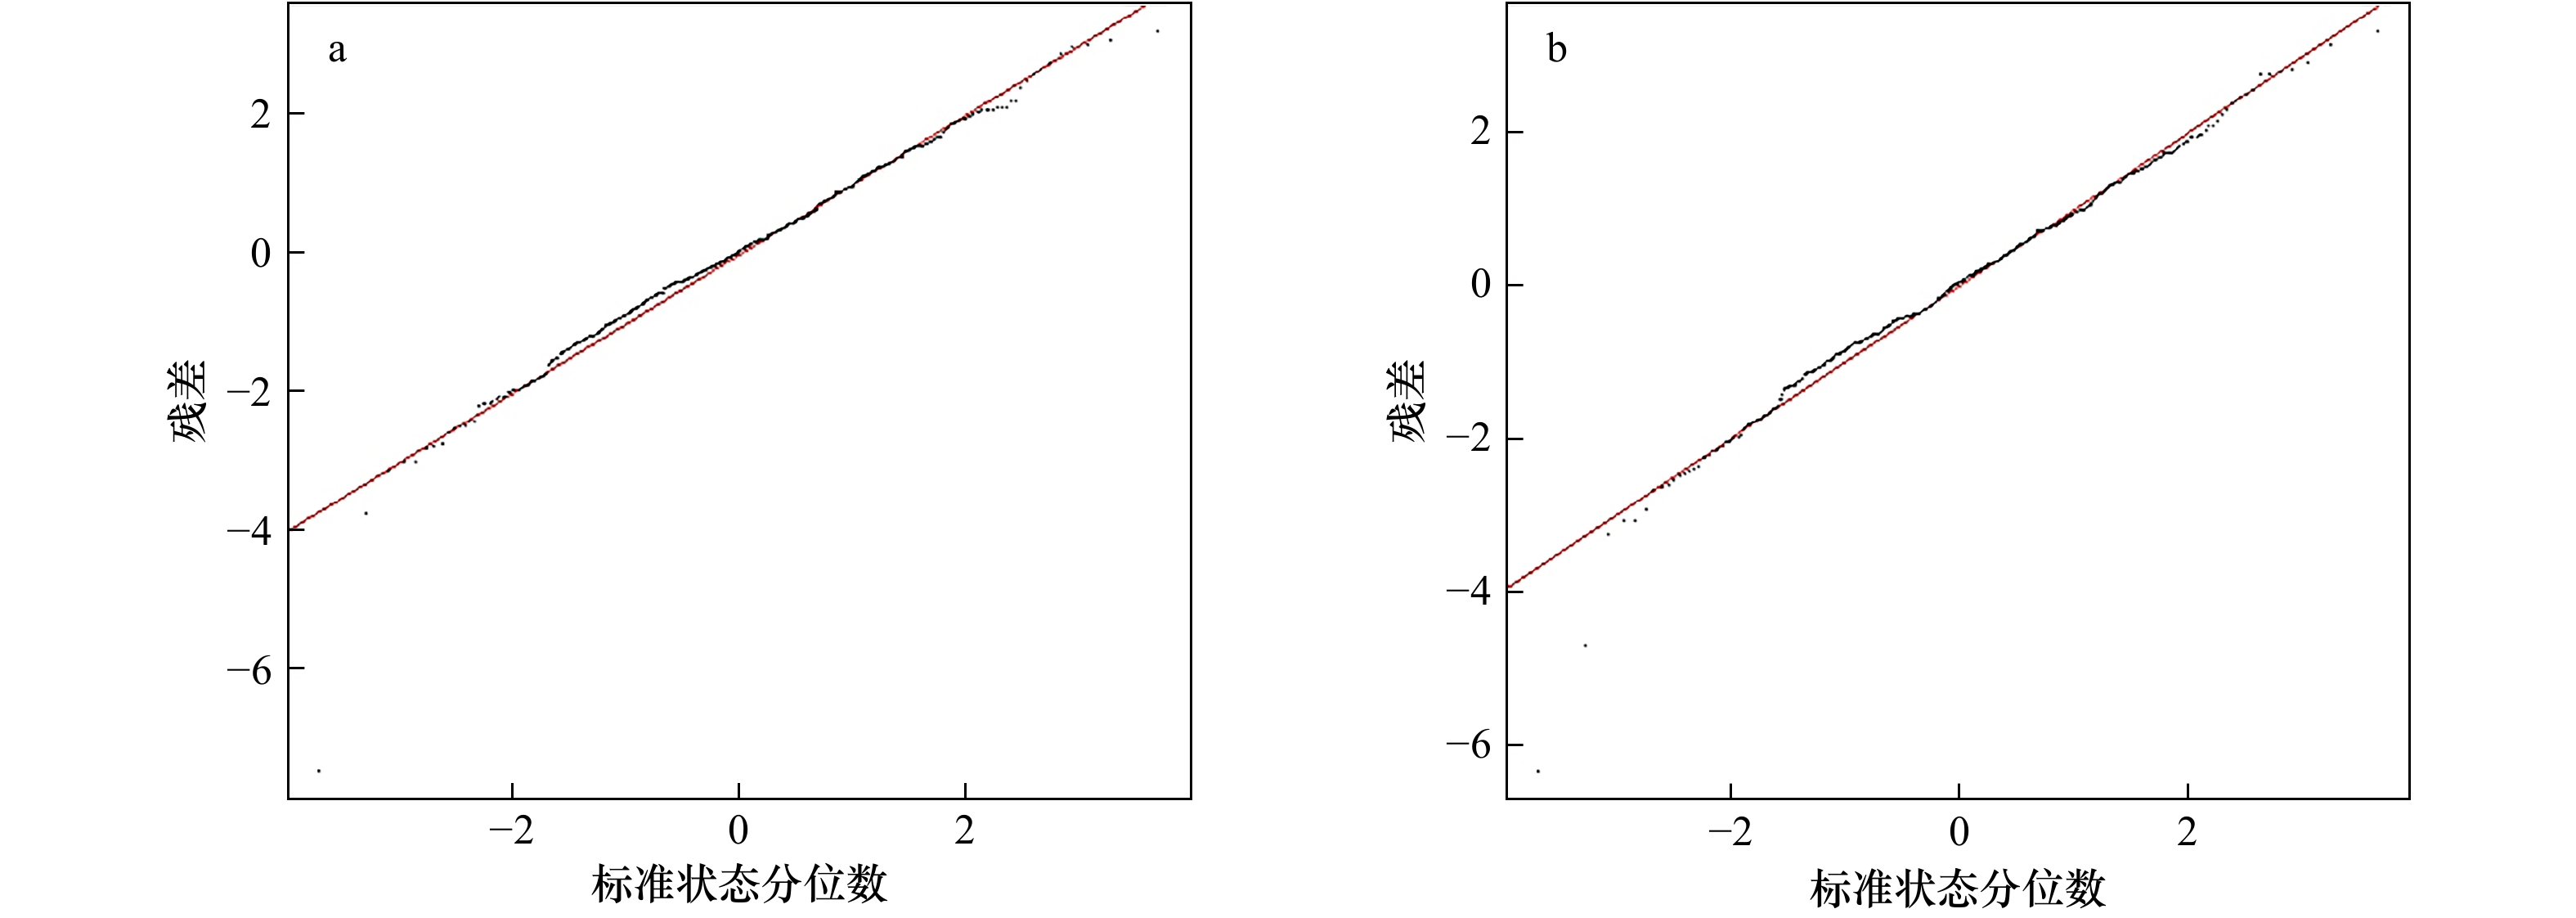
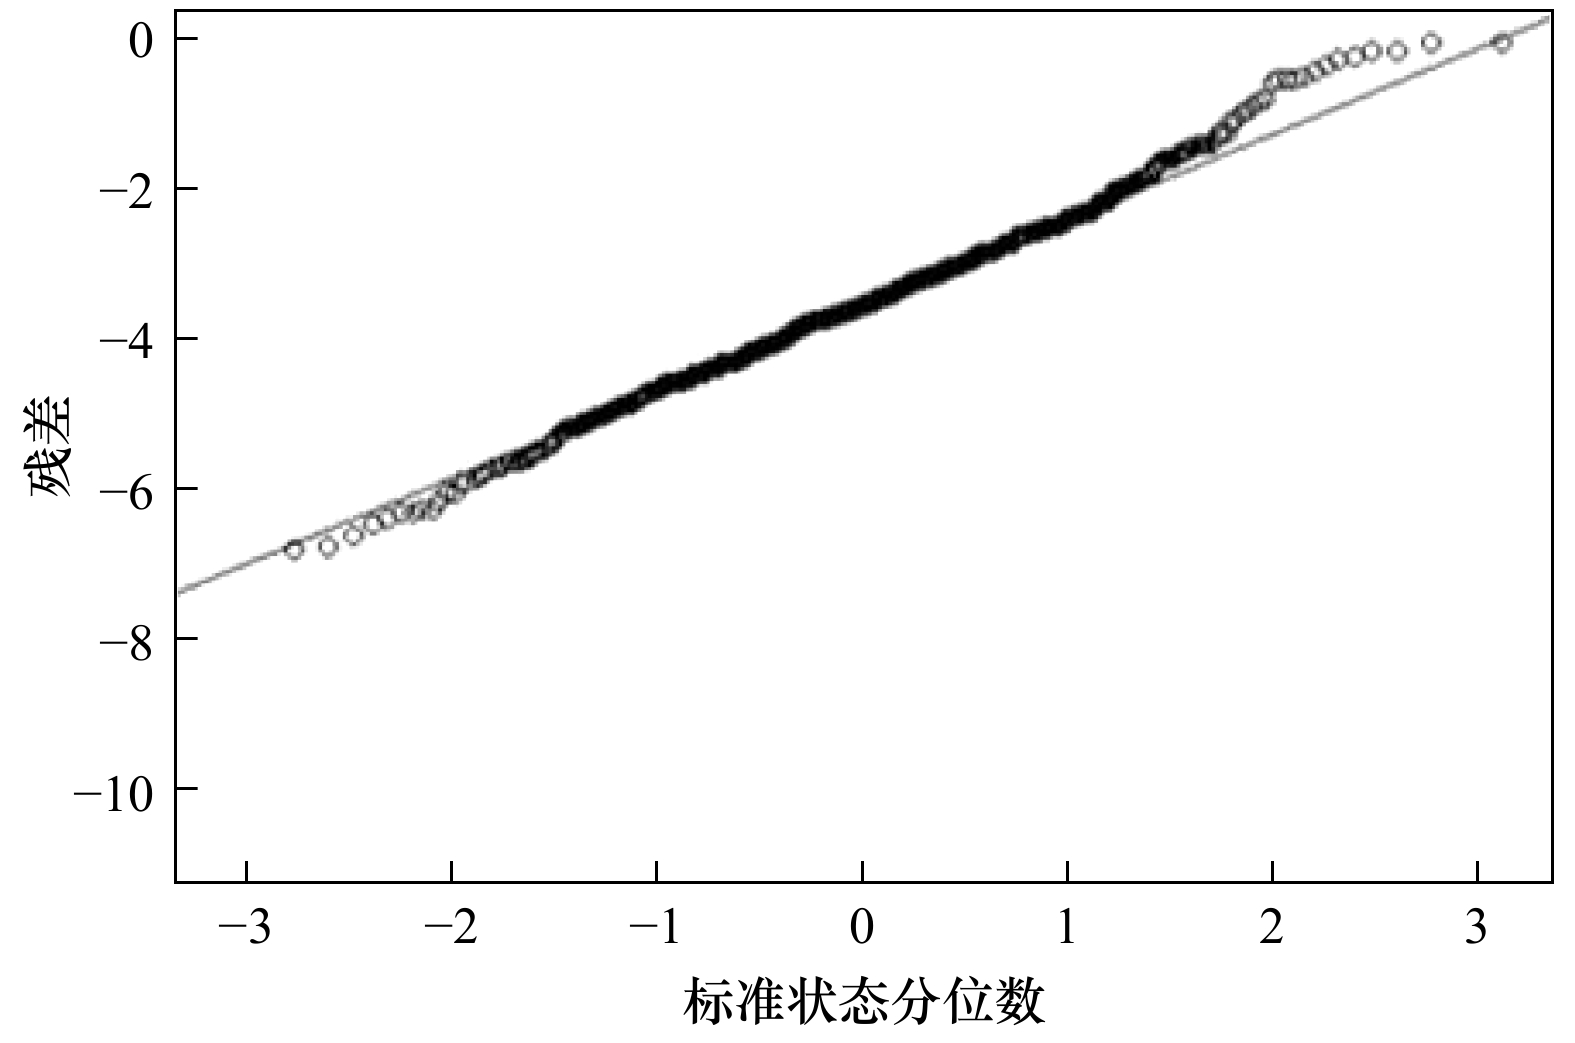
图 8 基础GAM(a)与改进GAM(b)残差图
红色直线代表一条斜率为样本标准差,截距为样本均值的正态分布直线;图中的黑色点为样本值的分布
Fig. 8 Residual diagram of the basic GAM (a) and the improved GAM (b)
The red line represents a normal distribution line whose slope is the sample standard deviation and intercept is the sample mean; the black dots in the graph are the distribution of sample values
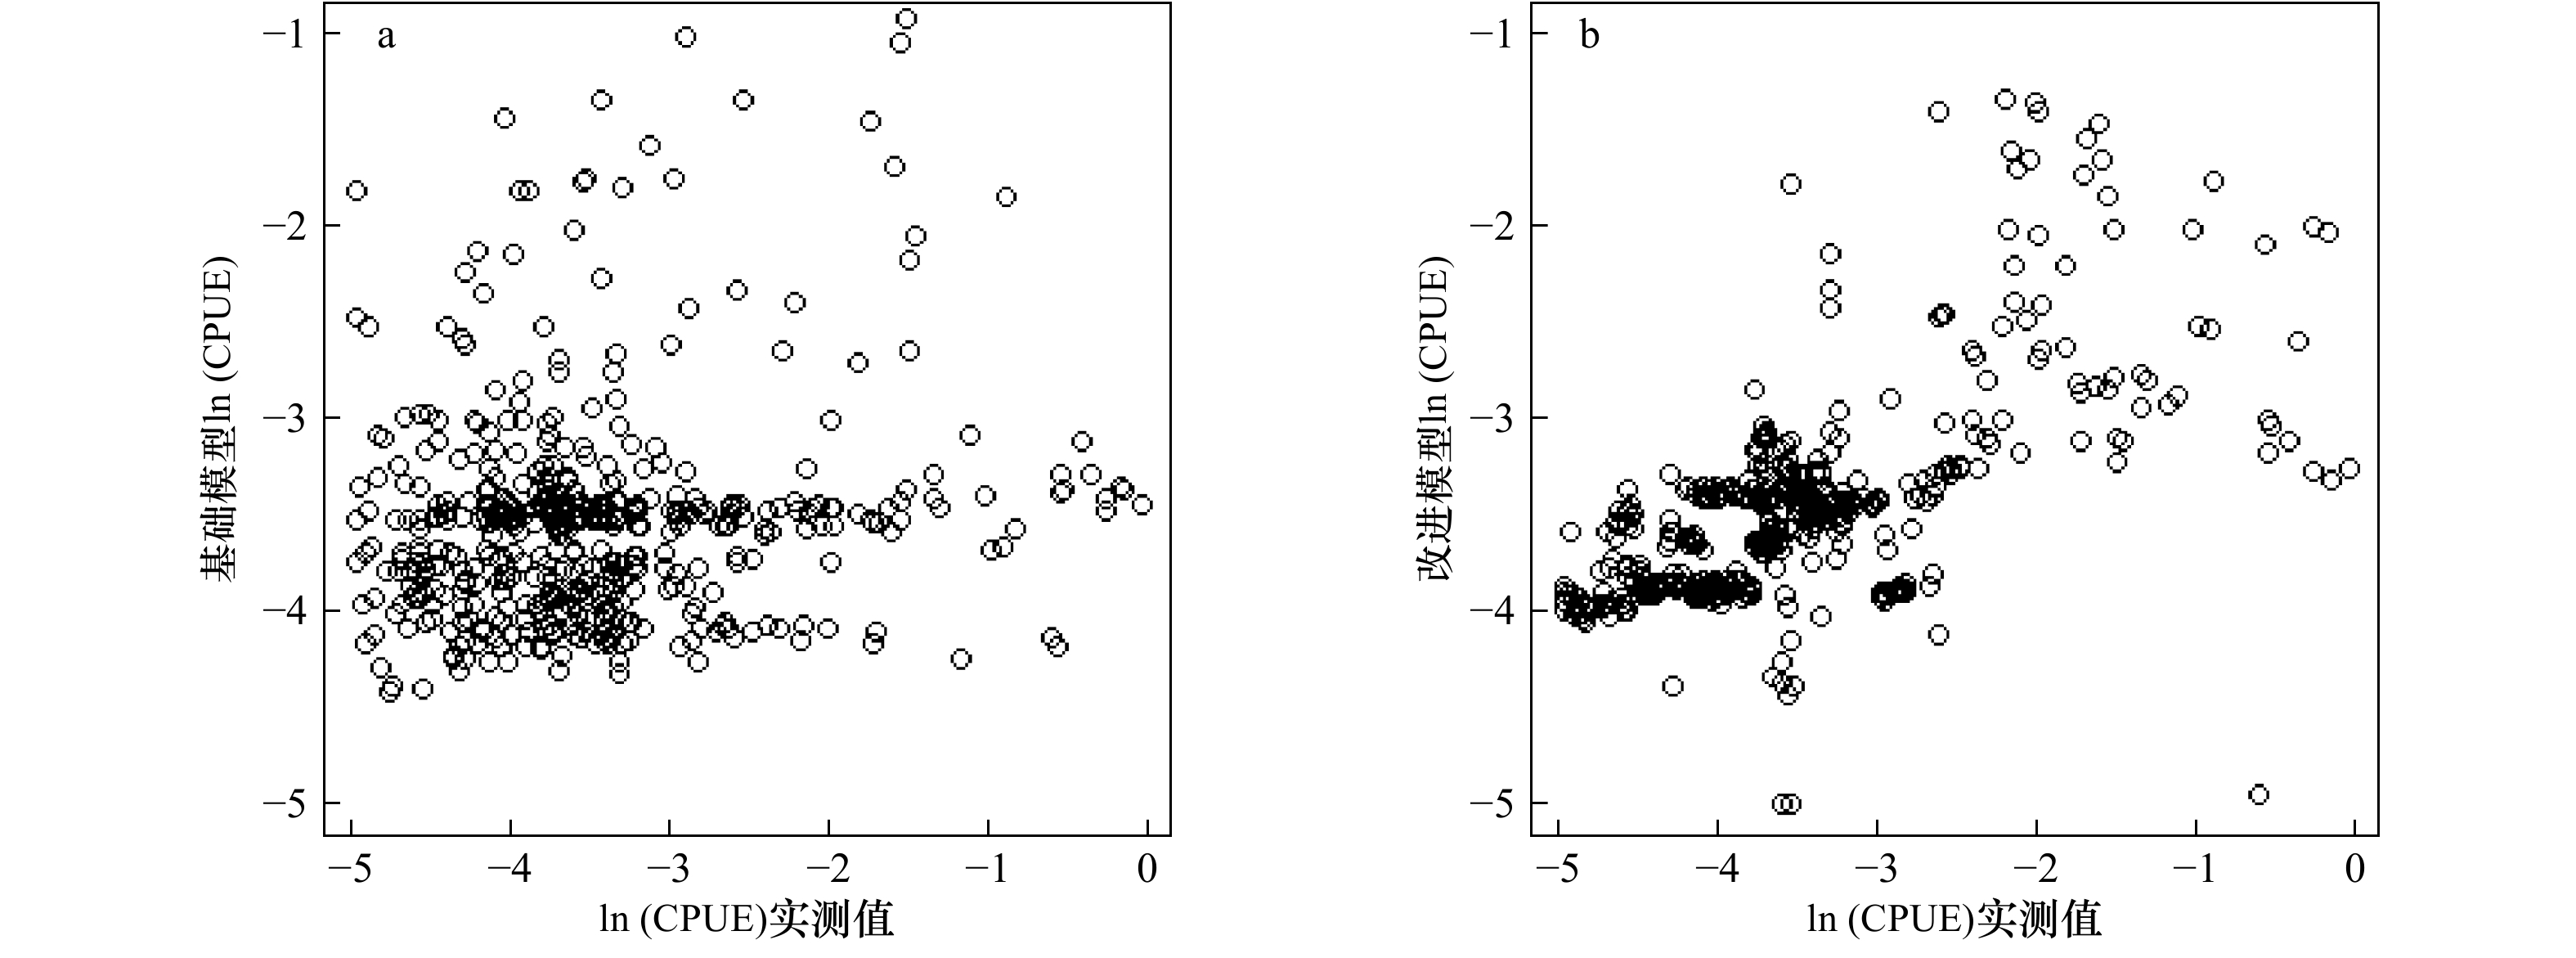
图 9 ln(CPUE)实测值与基础模型ln(CPUE)预测值散点图(a)、ln(CPUE)实测值与改进模型ln(CPUE)预测值散点图(b)
Fig. 9 The scatter plot of ln (CPUE) predicted by the improved GAM with the measured ln (CPUE) (a), and the scatter plot of ln (CPUE) predicted by the basic GAM with the measured ln (CPUE) (b)
表 1 基础GAM、改进GAM中变量解释率与显著性水平
Tab. 1 Variable interpretation rate and significance level in basic GAM and improved GAM
模型 模型因子 解释率/% p值 基础GAM $ s\left({\rm{Chl}}\;a\right) $ 8.85 0.000 $ s\left({\rm{SST}}\right) $ 12.8 0.001 $ s\left({\rm{Chl}}\;a\right)+s\left(\mathrm{S}\mathrm{S}\mathrm{T}\right) $ 14.18 0.004 改进GAM $ s\left({\rm{Chl}}\;a\right) $ 8.85 0.000 $ s\left({F}_{M}\right) $ 15 0.000 $s\left({\rm{Chl} }\;a\right)+s\left({F}_{M}\right)$ 17.86 0.002  下载: 导出CSV
表 2 基础GAM、改进GAM的AIC、MSE、r值
Tab. 2 AIC, MSE and r of the basic GAM and the improved GAM
模型 AIC MSE r 基础GAM 1 199 0.015 0.21 改进GAM 1 089 0.011 0.60
下载: 导出CSV
-
[1] 徐国强, 朱文斌, 张洪亮, 等. 基于GAM模型分析印度洋大眼金枪鱼和黄鳍金枪鱼渔场分布与不同环境因子关系[J]. 海洋学报, 2018, 40(12): 68−80.Xu Guoqiang, Zhu Wenbin, Zhang Hongliang, et al. Relationship between fishing grounds of Thunnus obesus and Thunnus albacores with environmental factors in the Indian Ocean based on generalized additive model[J]. Haiyang Xuebao, 2018, 40(12): 68−80. [2] IOTC, Secretariat. Executive summary: bigeye tuna[EB/OL]. (2018−11−26) [2020−08−10]. http://doi.org/10.5281/zenodo.3263175. [3] Ma Qiuyun, Tian Siquan, Song Liming, et al. Preliminary stock assessment for Bigeye tuna Thunnus obesus in the Indian Ocean using JABBA[C]//Working Party on Tropical Tunas (WPTT). Indonesia: Indian Ocean Tuna Commission, 2018. [4] 沈智宾, 陈新军, 汪金涛. 基于海表温度和海面高度的东太平洋大眼金枪鱼渔场预测[J]. 海洋科学, 2015, 39(10): 45−51. doi: 10.11759/hykx20140621002Shen Zhibin, Chen Xinjun, Wang Jintao. Forecasting of Bigeye tuna fishing ground in the Eastern Pacific Ocean based on sea surface temperature and sea surface height[J]. Marine Sciences, 2015, 39(10): 45−51. doi: 10.11759/hykx20140621002 [5] Lehodey P, Senina I, Wibawa T A, et al. Operational modelling of bigeye tuna (Thunnus obesus) spatial dynamics in the Indonesian region[J]. Marine Pollution Bulletin, 2018, 131: 19−32. doi: 10.1016/j.marpolbul.2017.08.020 [6] Dunn N, Curnick D. Using historical fisheries data to predict tuna distribution within the British Indian Ocean Territory Marine Protected Area, and implications for its management[J]. Aquatic Conservation Marine and Freshwater Ecosystems, 2019, 29(12): 2057−2070. doi: 10.1002/aqc.3204 [7] Brodie S J, Thorson J T, Carroll G, et al. Trade-offs in covariate selection for species distribution models: a methodological comparison[J]. Ecography, 2020, 43(1): 11−24. doi: 10.1111/ecog.04707 [8] 查铖, 贺琪, 宋巍, 等. 结合注意力机制的区域型海表面温度预报算法[J]. 海洋通报, 2020, 39(2): 191−199.Zha Cheng, He Qi, Song Wei, et al. Regional sea surface temperature prediction algorithm combined with attention mechanism[J]. Marine Science Bulletin, 2020, 39(2): 191−199. [9] Guo Xifeng, Liu Xinwang, Zhu En, et al. Deep Clustering with Convolutional Autoencoders[M]. Cham: Springer, 2017. doi: 10.1007/978-3-319-70096-0_39. [10] 武胜男, 陈新军, 刘祝楠. 基于GAM的西北太平洋日本鲭资源丰度预测模型建立[J]. 海洋学报, 2019, 41(8): 36−42.Wu Shengnan, Chen Xinjun, Liu Zhunan. Establishment of forecasting model of the abundance index for chub mackerel (Scomber japonicus) in the northwest Pacific Ocean based on GAM[J]. Haiyang Xuebao, 2019, 41(8): 36−42. [11] 杨胜龙, 范秀梅, 伍玉梅, 等. 基于GAM模型的阿拉伯海鲐鱼渔场分布与环境关系[J]. 生态学杂志, 2019, 38(8): 2466−2470.Yang Shenglong, Fan Xiumei, Wu Yumei, et al. The relationship between the fishing ground of mackerel (Scomber australasicus) in Arabian Sea and the environment based on GAM model[J]. Chinese Journal of Ecology, 2019, 38(8): 2466−2470. [12] 闫敏, 张衡, 伍玉梅, 等. 基于GAM模型研究时空及环境因子对南太平洋长鳍金枪鱼渔场的影响[J]. 大连海洋大学学报, 2015, 30(6): 681−685.Yan Min, Zhang Heng, Wu Yumei, et al. Effects of spatio-temporal and environmental factors on fishing grounds of albacore tuna Thunnus alalunga in the South Pacific Ocean based on generalized additive model[J]. Journal of Dalian Ocean University, 2015, 30(6): 681−685. [13] Arbelaitz O, Gurrutxaga I, Muguerza J, et al. An extensive comparative study of cluster validity indices[J]. Pattern Recognition, 2013, 46(1): 243−256. doi: 10.1016/j.patcog.2012.07.021 [14] 杨胜龙, 周为峰, 伍玉梅, 等. 西北印度洋大眼金枪鱼渔场预报模型建立与模块开发[J]. 水产科学, 2011, 30(11): 666−672. doi: 10.3969/j.issn.1003-1111.2011.11.003Yang Shenglong, Zhou Weifeng, Wu Yumei, et al. Development of predictive model and module of fishing ground for Bigeye Tuna, Thunnus obesusand in the Northwest Indian Ocean[J]. Fisheries Science, 2011, 30(11): 666−672. doi: 10.3969/j.issn.1003-1111.2011.11.003 [15] Murase H, Nagashima H, Yonezaki S, et al. Application of a generalized additive model (GAM) to reveal relationships between environmental factors and distributions of pelagic fish and krill: a case study in Sendai Bay, Japan[J]. ICES Journal of Marine Science, 2009, 66(6): 1417−1424. doi: 10.1093/icesjms/fsp105 [16] 武胜男, 陈新军. 基于GLM和GAM的日本鲭太平洋群体补充量与产卵场影响因子关系分析[J]. 水产学报, 2020, 44(1): 61−70.Wu Shengnan, Chen Xinjun. Relationship between the recruitment of the Pacific-cohort of chub mackerel (Scomber japonicus) and the influence factors on the spawning ground based on GLM and GAM[J]. Journal of Fisheries of China, 2020, 44(1): 61−70. [17] 张云雷, 徐宾铎, 张崇良, 等. 基于Tweedie-GAM模型研究海州湾小黄鱼资源丰度与栖息环境的关系[J]. 海洋学报, 2019, 41(12): 78−89.Zhang Yunlei, Xu Binduo, Zhang Chongliang, et al. Relationship between the habitat factors and the abundance of small yellow croaker (Larimichthys polyactis) in Haizhou Bay based on the Tweedie-GAM mode[J]. Haiyang Xuebao, 2019, 41(12): 78−89. [18] 王海军. 深度卷积神经网络在遥感影像分类的应用研究[D]. 北京: 中国地质大学, 2018.Wang Haijun. Research and application of deep convolutional neural networks in remote sensing image classification[D]. Beijing: China University of Geosciences, 2018. [19] 孟祥鹤哲. 基于神经网络的WOA13数据的海洋温跃层分析[D]. 长春: 吉林大学, 2019.Meng Xianghezhe. Thermocline analysis of WOA13 data based on neural network[D]. Changchun: Jilin University, 2019. [20] 崔艳荣, 邹斌, 韩震, 等. 卷积神经网络在卫星遥感海冰图像分类中的应用探究——以渤海海冰为例[J]. 海洋学报, 2020, 42(9): 100−109.Cui Yanrong, Zou Bin, Han Zhen, et al. Application of convolutional neural networks in satellite remote sensing sea ice image classification: a case study of sea ice in the Bohai Sea[J]. Haiyang Xuebao, 2020, 42(9): 100−109. [21] 杜岩, 张涟漪, 张玉红. 印度洋热带环流圈热盐输运及其对区域气候模态的影响[J]. 地球科学进展, 2019, 34(3): 243−254. doi: 10.11867/j.issn.1001-8166.2019.03.0243Du Yan, Zhang Lianyi. Zhang Yuhong. Review of the tropical gyre in the Indian Ocean with its impact on heat and salt transport and regional climate modes[J]. Advances in Earth Science, 2019, 34(3): 243−254. doi: 10.11867/j.issn.1001-8166.2019.03.0243 [22] 姜德忠, 解思梅, 包澄澜, 等. 35°S以北的印度洋的气候状况和季风特征[J]. 海洋预报, 1998, 15(4): 40−49. doi: 10.11737/j.issn.1003-0239.1998.04.006Jiang Dezhong, Xie Simei, Bao Chenglan, et al. Climate and monsoon features of the Indian Ocean north of 35°S[J]. Marine Forecasts, 1998, 15(4): 40−49. doi: 10.11737/j.issn.1003-0239.1998.04.006 [23] 刘增宏, 许建平, 吴晓芬. 印度洋海域水文特征及其季节变化[C]//第八届全国海洋资料同化研讨会暨第二届Argo科学研讨会. 北京: 海洋出版社, 2013.Liu Zenghong, Xu Jianping, Wu Xiaofen. The characteristics of hydrography and its seasonal variability in the Indian Ocean[C]//The Eighth and the Second National Seminar on Ocean Data Assimilation Argo Scientific Conferences. Beijing: China Ocean Press, 2013. [24] Schott F A, Xie Shangping, McCreary Jr J P. Indian Ocean circulation and climate variability[J]. Reviews of Geophysics, 2009, 47(1): RG1002. [25] Peng Shiqiu, Qian Yukun, Lumpkin R, et al. Characteristics of the near-surface currents in the Indian Ocean as deduced from satellite-tracked surface drifters. Part II: lagrangian statistics[J]. Journal of Physical Oceanography, 2015, 45(2): 459−477. doi: 10.1175/JPO-D-14-0049.1 [26] 吕为群, 袁明哲. 温度变化对鱼类行为影响的研究进展[J]. 上海海洋大学学报, 2017, 26(6): 828−835.Lü Weiqun, Yuan Mingzhe. The literature review of temperature change effect on fish behavior[J]. Journal of Shanghai Ocean University, 2017, 26(6): 828−835. [27] 陈雪忠, 杨胜龙, 张禹, 等. 热带印度洋大眼金枪鱼垂直分布空间分析[J]. 中国水产科学, 2013, 20(3): 660−671. doi: 10.3724/SP.J.1118.2013.00660Chen Xuezhong, Yang Shenglong, Zhang Yu, et al. Vertical distribution of bigeye tuna Thunnus obesus in the tropical Indian Ocean[J]. Journal of Fishery Sciences of China, 2013, 20(3): 660−671. doi: 10.3724/SP.J.1118.2013.00660 [28] 宋利明, 杨嘉樑, 武亚苹, 等. 吉尔伯特群岛海域大眼金枪鱼(Thunnus obesus)栖息环境综合指数[J]. 海洋与湖沼, 2012, 43(5): 954−962. doi: 10.11693/hyhz201205012012Song Liming, Yang Jialiang, Wu Yaping, et al. An integrated habitat index of bigeye tuna Thunnus obesus in waters near Gilbert Islands[J]. Oceanologia et Limnologia Sinica, 2012, 43(5): 954−962. doi: 10.11693/hyhz201205012012 -


计量
- 文章访问数: 460
- HTML全文浏览量: 190
- PDF下载量: 50
- 被引次数: 0
