

Multidecadal variability of rapid intensification of tropical cyclones passing through the South China Sea
-
摘要: 本文利用中国气象局热带气旋资料中心最佳路径数据集、美国国家环境预报中心/美国国家大气研究中心大气再分析数据集和国家海洋信息中心的海洋再分析数据集,研究了路经南海热带气旋迅速加强(Rapid Intensification, RI)的年代际变化。在1951–2017年期间,路经南海的热带气旋主要发生在6–12月,其中发生RI的热带气旋集中在7–12月,且RI呈现年代际变化,这种变化和太平洋年代际振荡(Pacific Decadal Oscillation, PDO)显著相关。在正PDO年,RI频数较少且主要分布在菲律宾群岛东部和南海北部;而在负PDO年,RI频数较多且分布在菲律宾群岛东部的大范围区域。路经南海热带气旋RI的年代际变化与PDO对大尺度海洋大气变量的调制有关。回归分析显示热带气旋潜热对路经南海热带气旋RI频数的年代际变化影响最大,而相对湿度的影响相对较小,垂直风切变的影响很小。Abstract: Multidecadal variability of rapid intensification of tropical cyclones passing through the South China Sea (SCS) is investigated using the best track data set of tropical cyclones archived at the China Meteorological Administration, the National Center for Atmospheric Research/National Center for Environmental Prediction atmospheric reanalysis data set, and the China Ocean Reanalysis oceanic reanalysis data set from the National Marine Data and Information Service. During 1951−2017, tropical cyclones passing through the SCS are occurred concentratedly from June through December, among which the tropical cyclones with rapid intensification (RI) are concentrated from July through December. RI events have shown multidecadal variability, which is significantly correlated with the Pacific Decadal Oscillation (PDO). In positive PDO years, RI events, with relatively low frequency, mainly distribute in Eastern Philippines and north of the SCS, while in negative PDO years, RI events, with relatively high frequency, mainly distribute in a large area of eastern Philippines. The multidecadal variation of RI of tropical cyclones passing through the SCS is related to large-scale oceanic and atmospheric variables modulated by PDO. Regression analysis shows that tropical cyclone heat potential has the greatest effect on the multidecadal variation of RI, while relative humidity has a relatively small effect and the effect of vertical wind shear is smaller.
-
Key words:
- tropical cyclones /
- rapid intensification /
- Pacific decadal oscillation /
- South China Sea
-
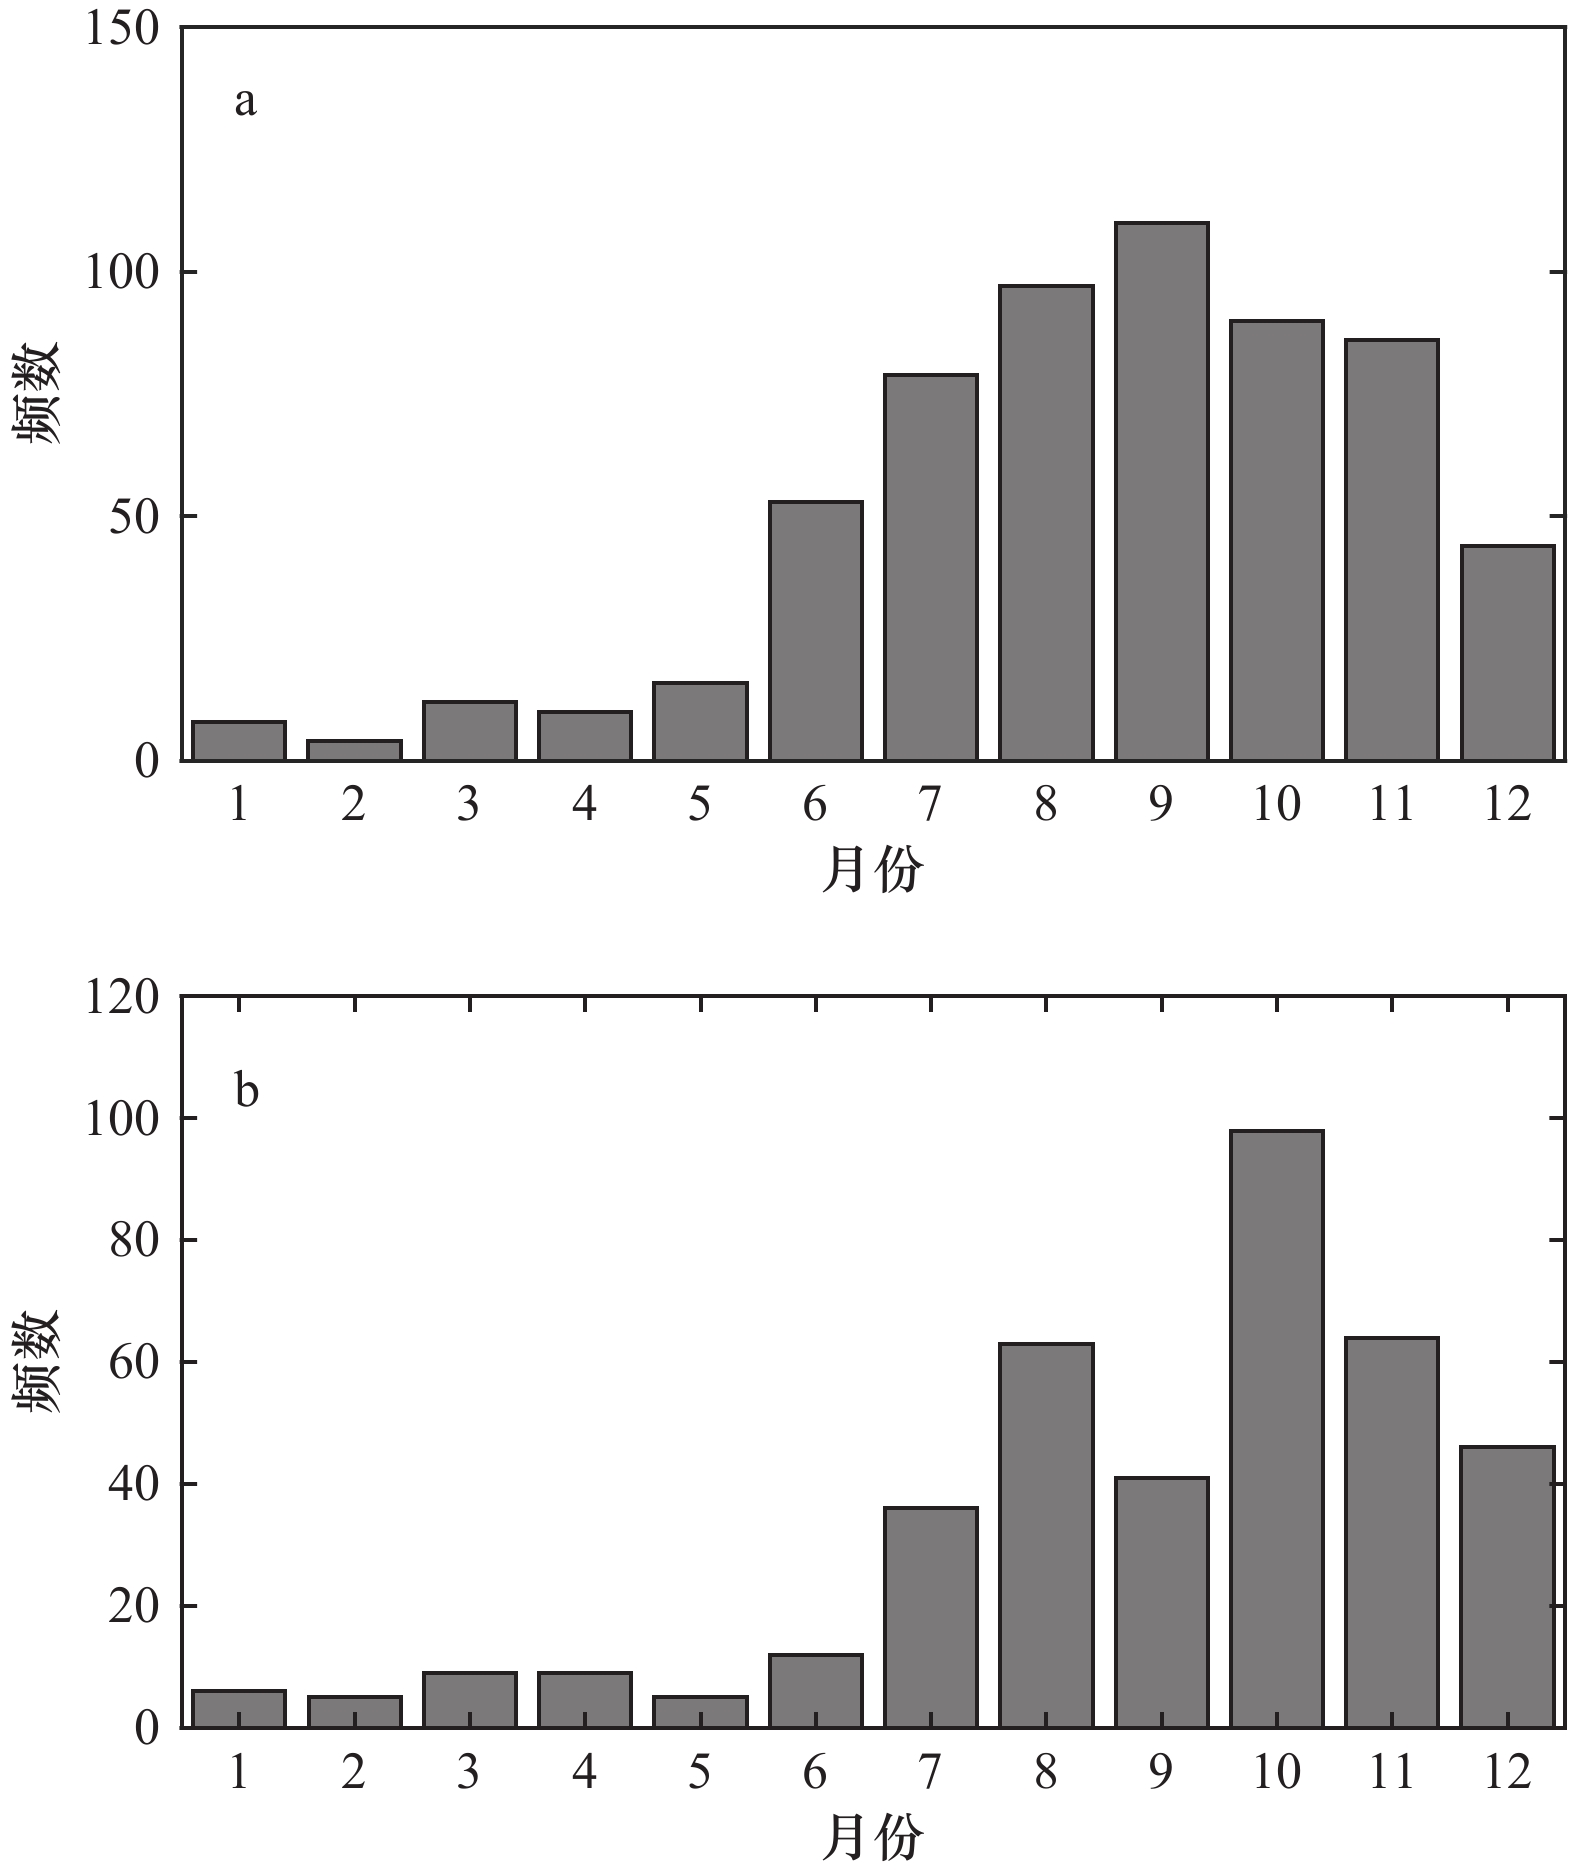
图 1 1951–2017年期间各月路经南海热带气旋频数(a)和发生RI频数(b)
Fig. 1 Monthly number of tropical cyclones passing through the South China Sea (a) and RI events (b) during 1951−2017

图 2 1951−2017年间发生RI的路经南海热带气旋的轨迹(灰色线)(a)和RI频数在5°×5°网格的空间分布(b)(a中红点表示发生RI的地点)
Fig. 2 Tracks of tropical cyclones passing through the South China Sea (gray lines) with RI events (red dots) (a) and RI number in each 5°×5° box (b) during 1951−2017
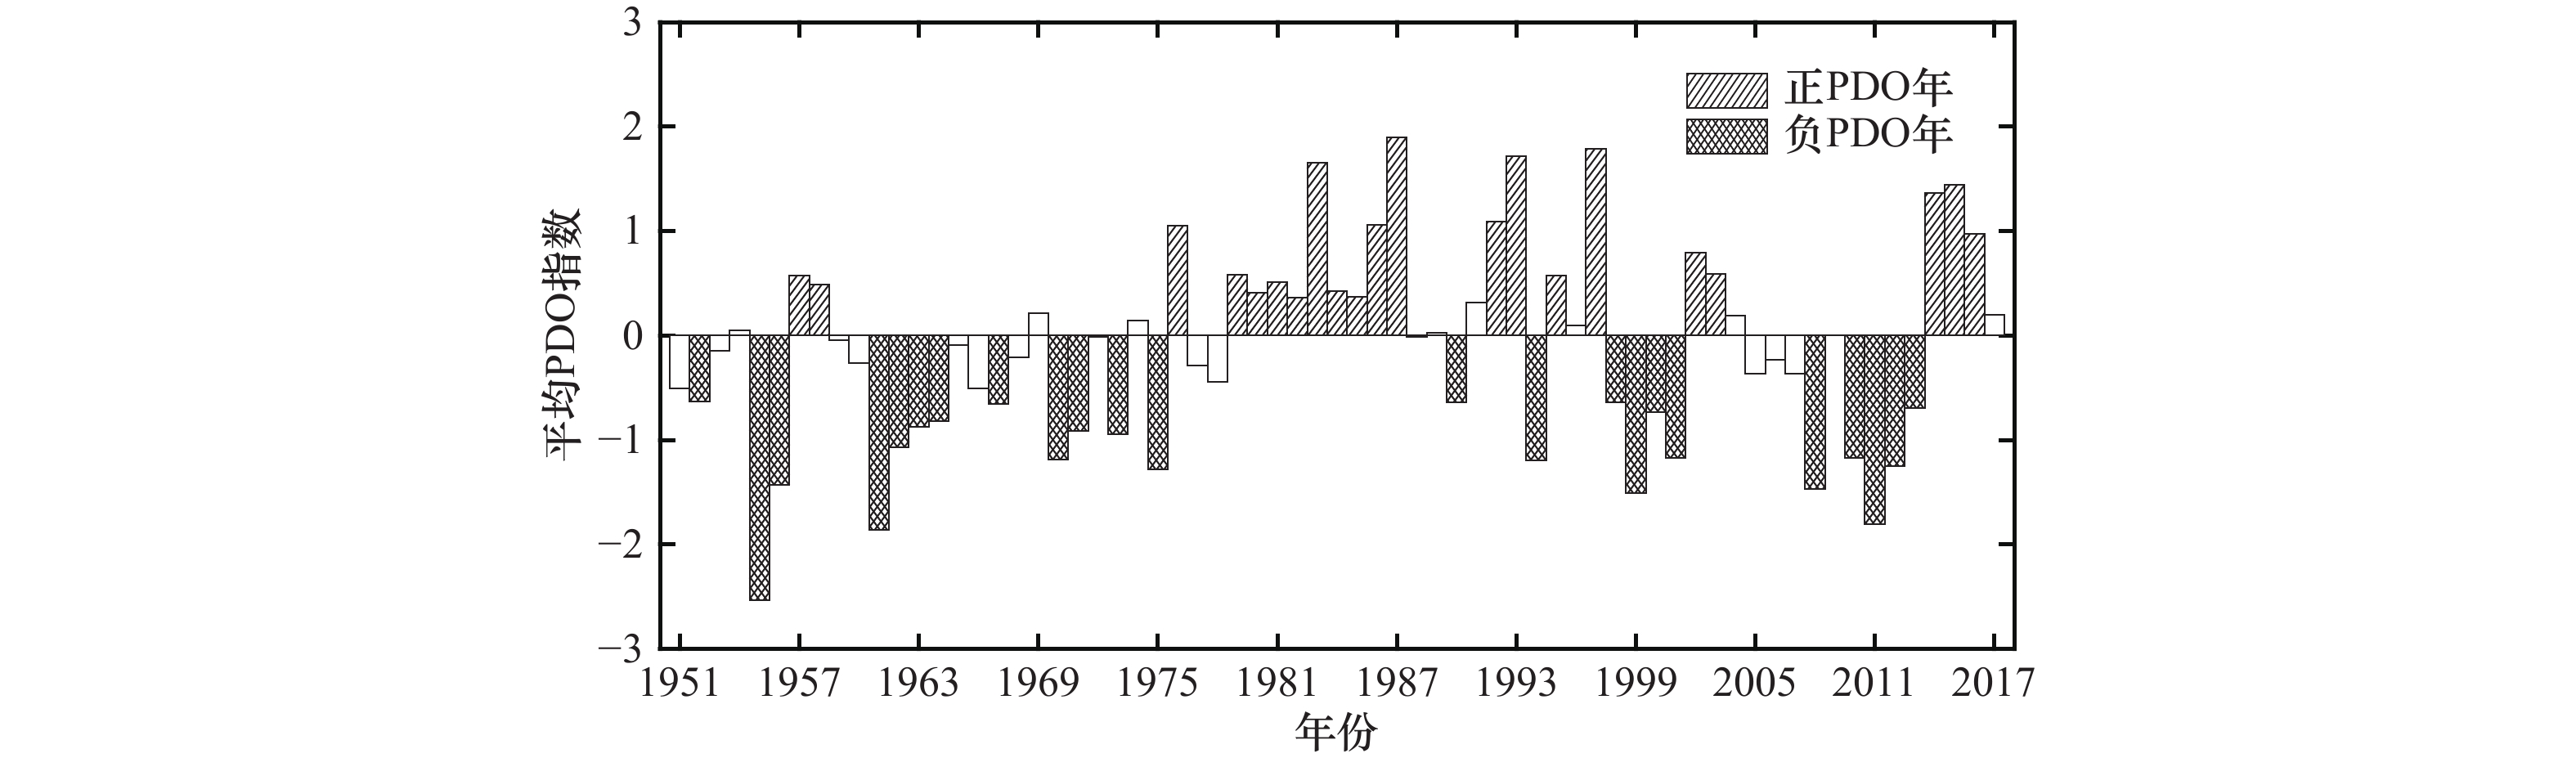
图 3 1951–2017年7–12月平均PDO指数时间序列图
Fig. 3 Time series of average PDO index from July to December during 1951−2017
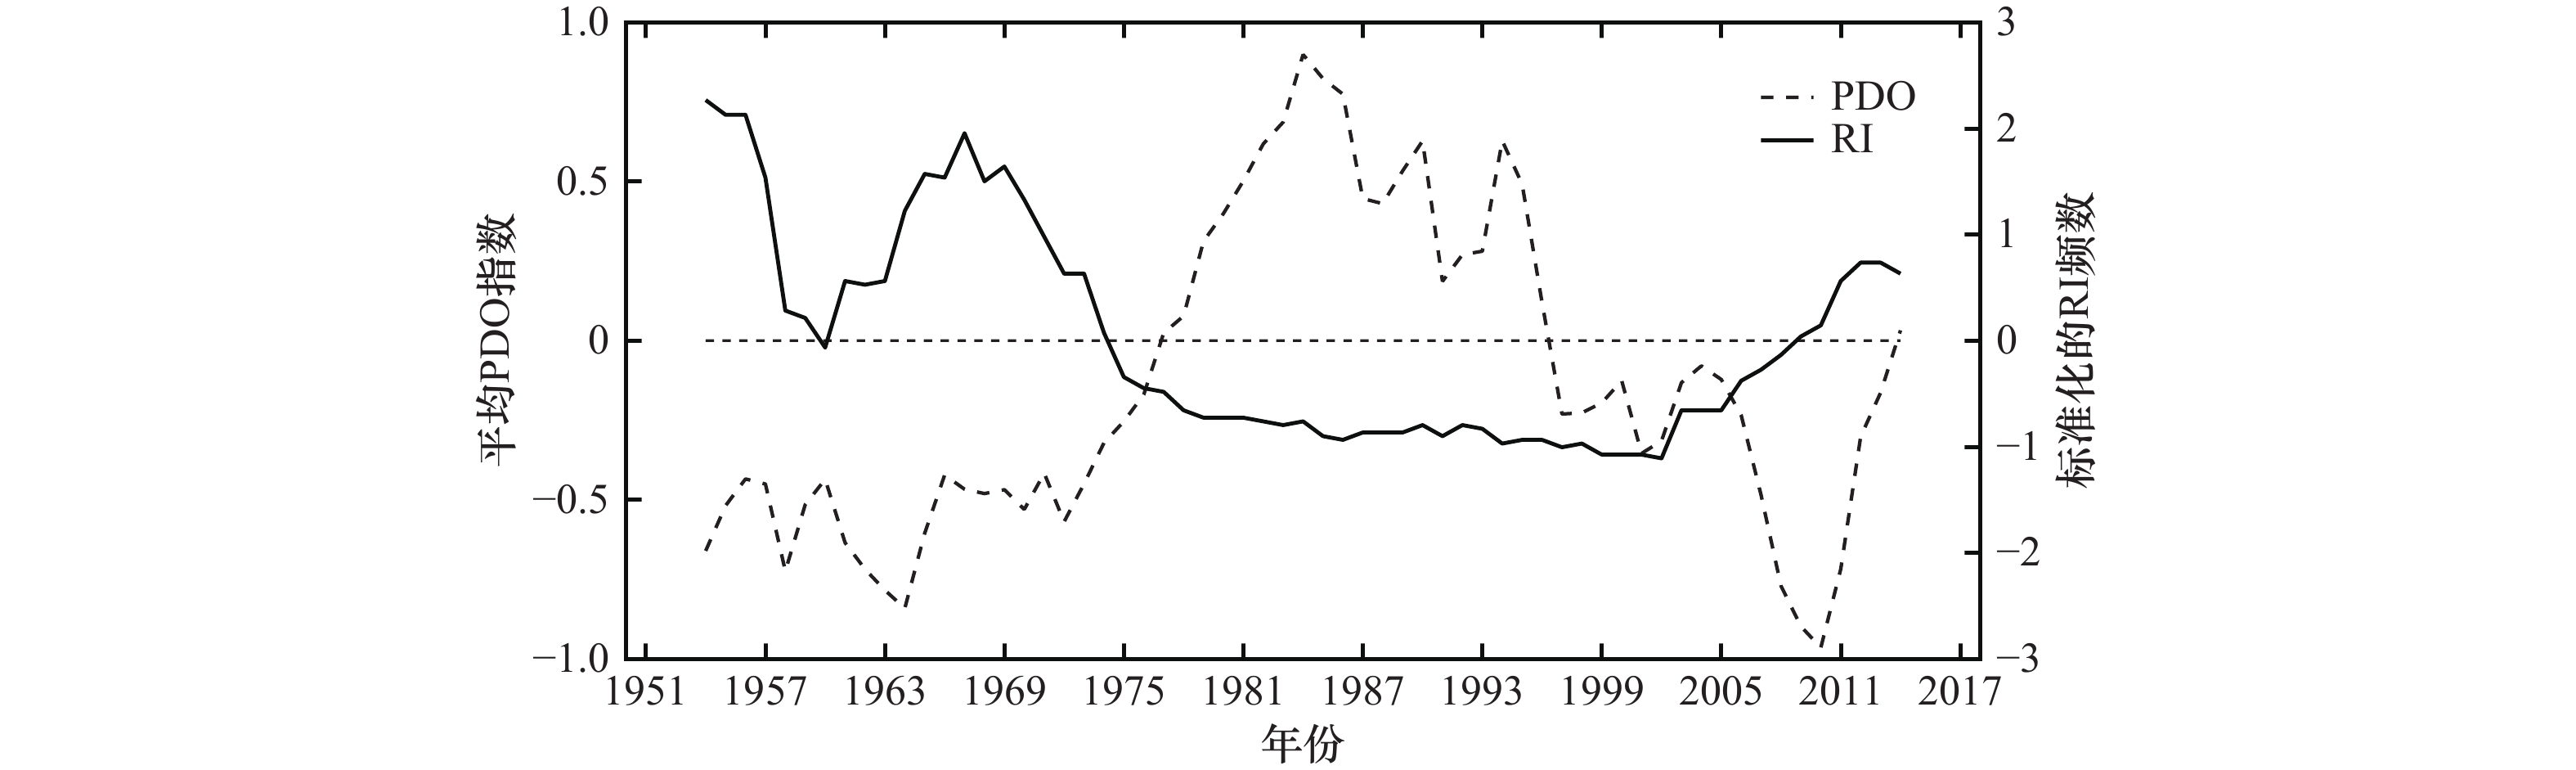
图 4 1951–2017年7–12月路经南海热带气旋的RI频数经过7年滑动平均后的标准化时间序列(实线)和经过7年滑动平均后的PDO指数序列(虚线)(二者的相关系数为−0.64)
Fig. 4 Standardized time series of RI number (solid line) of tropical cyclones passing through the South China Sea and PDO index (dashed line) both with a 7-year running mean from July through December during 1951−2017 (the correlation coefficient of the two is −0.64)
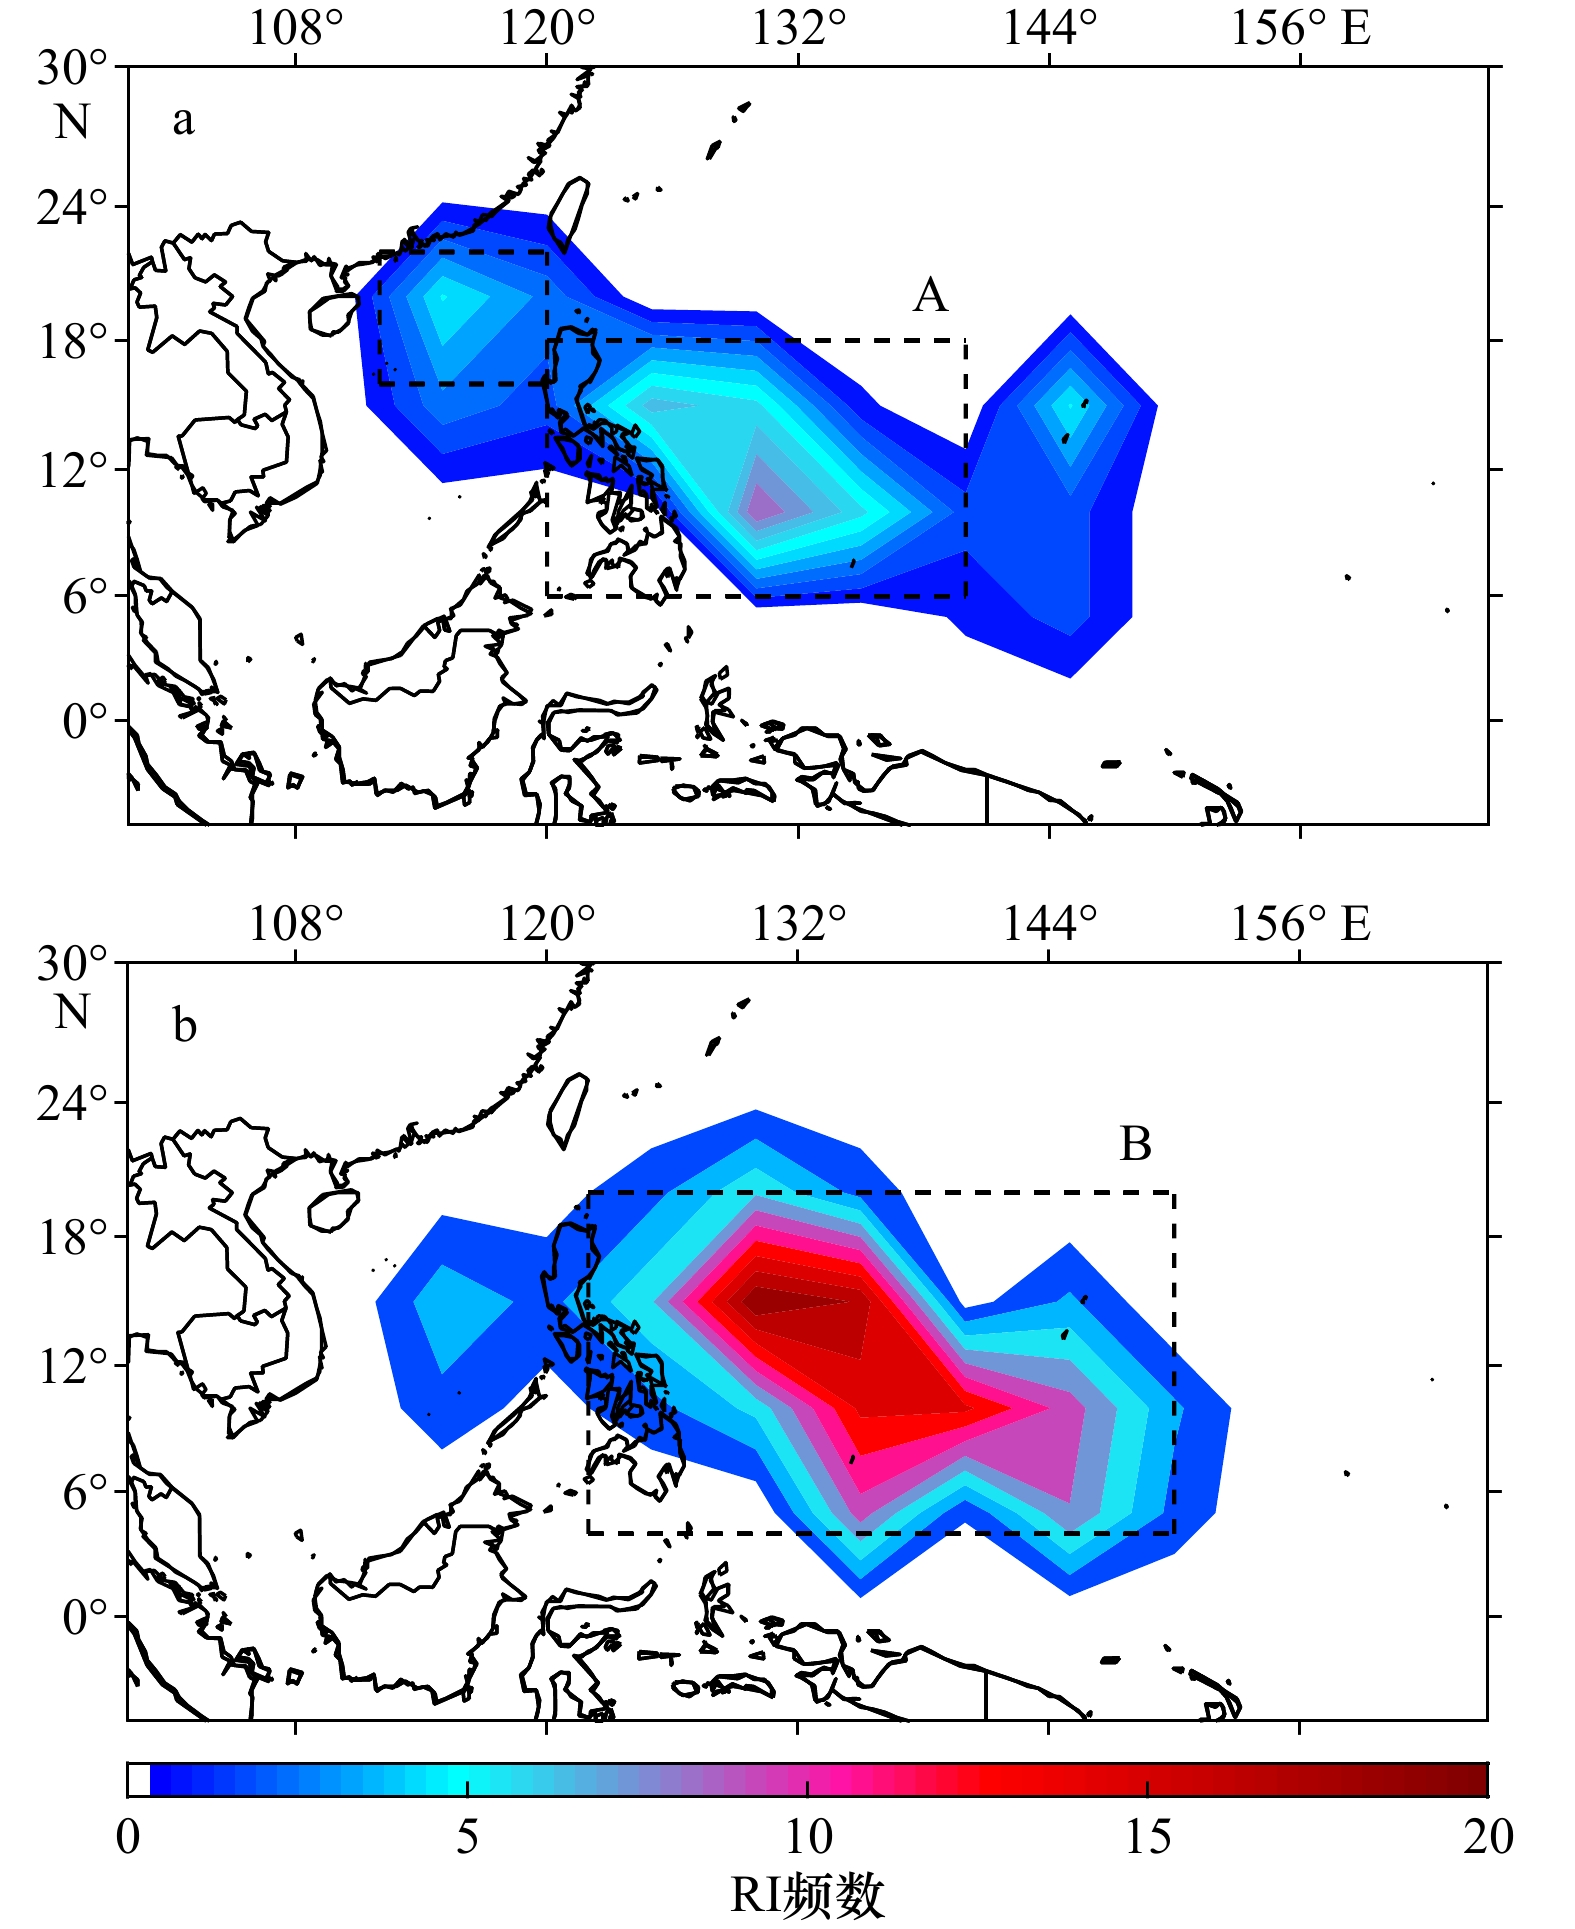
图 5 正PDO年(a)和负PDO年(b)的RI频数在5°×5°网格的空间分布
Fig. 5 Total RI number in each 5°×5° box during 1951−2017 in positive (a) and negative (b) PDO years
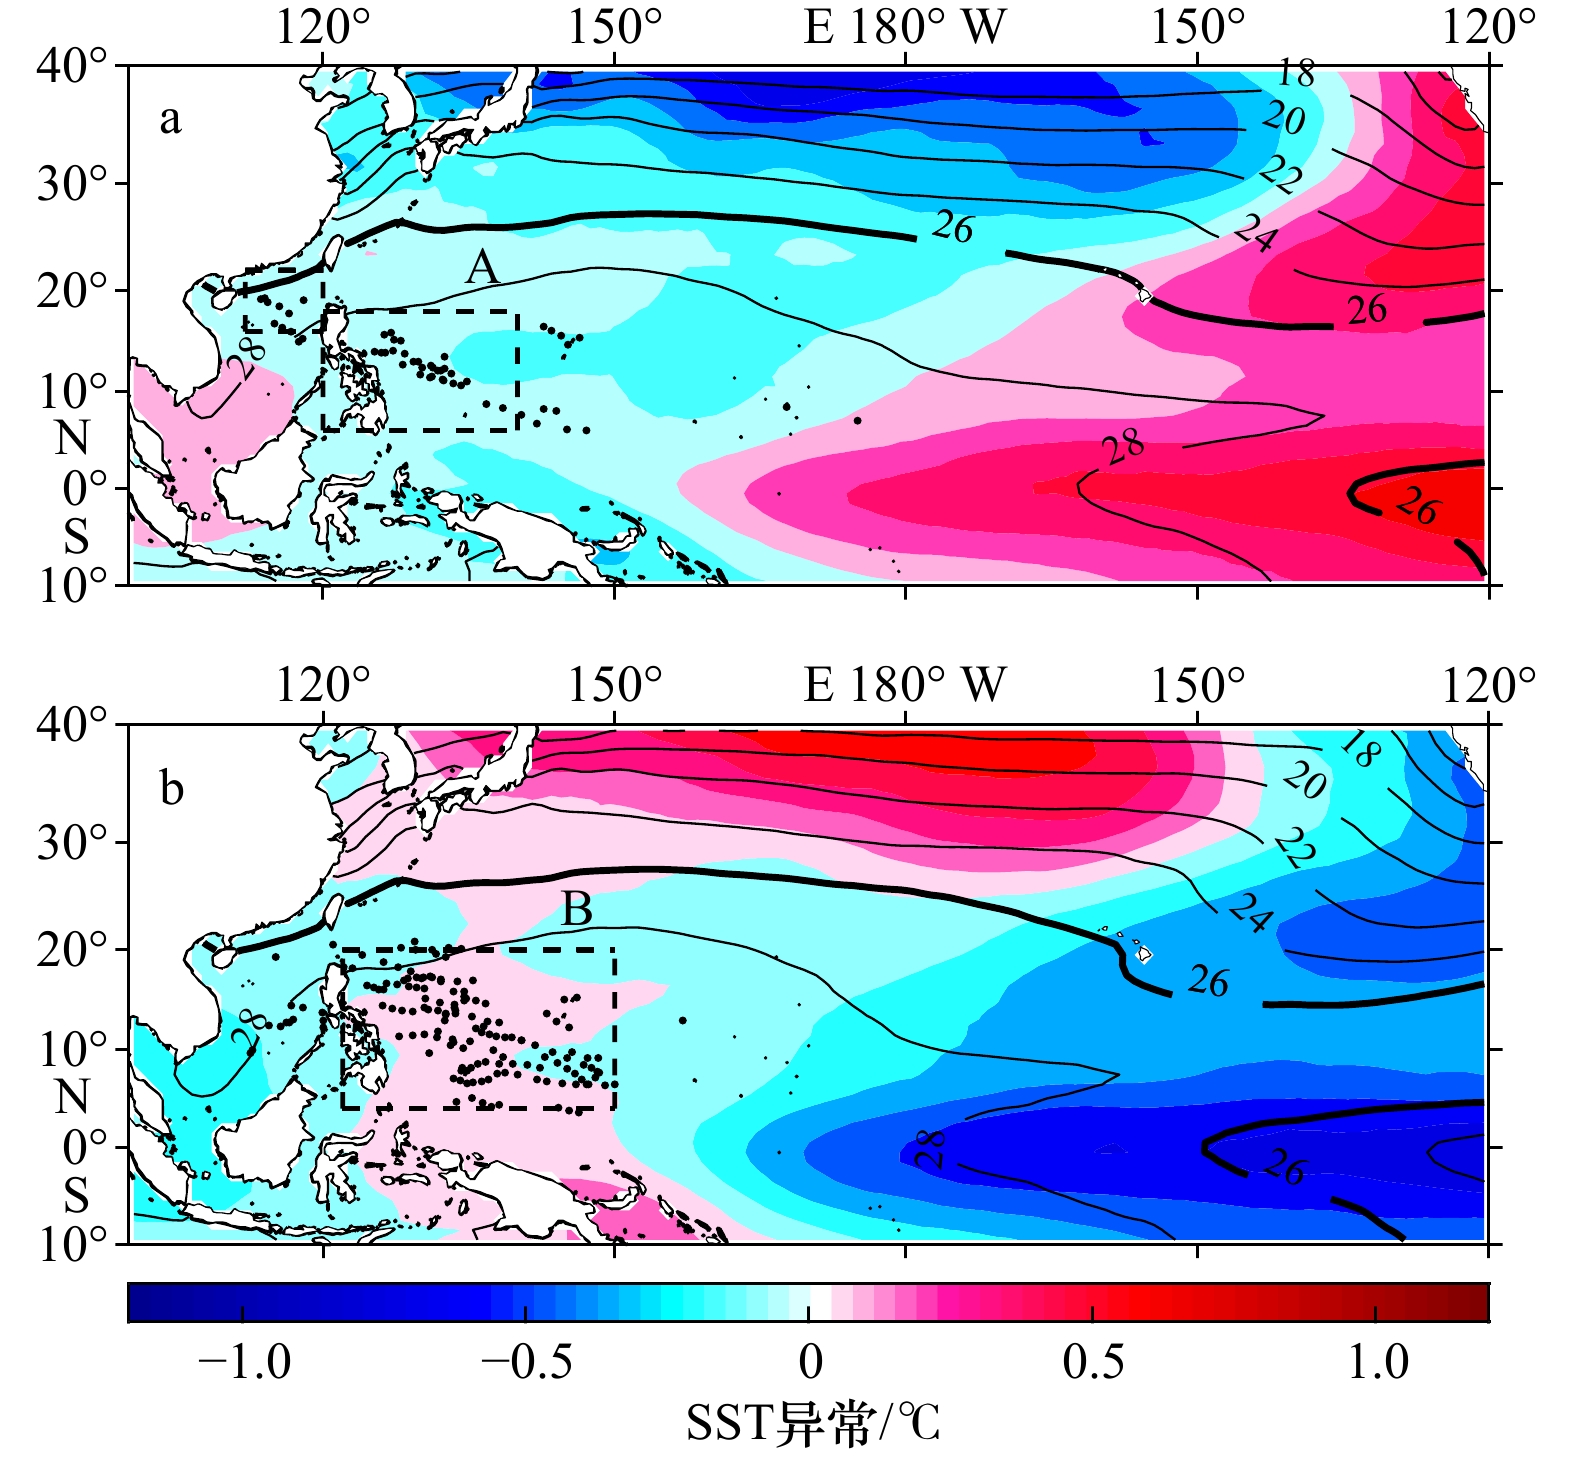
图 6 正PDO年(a)和负PDO年(b)的平均SST(等值线)和SST异常(填色)
黑点代表RI位置,矩阵框表示RI主要区域
Fig. 6 Mean SST (contour) and SST anomaly (shaded) in positive (a) and negative (b) PDO years
The black dots represent the RI location. The rectangle boxes indicate the main RI region
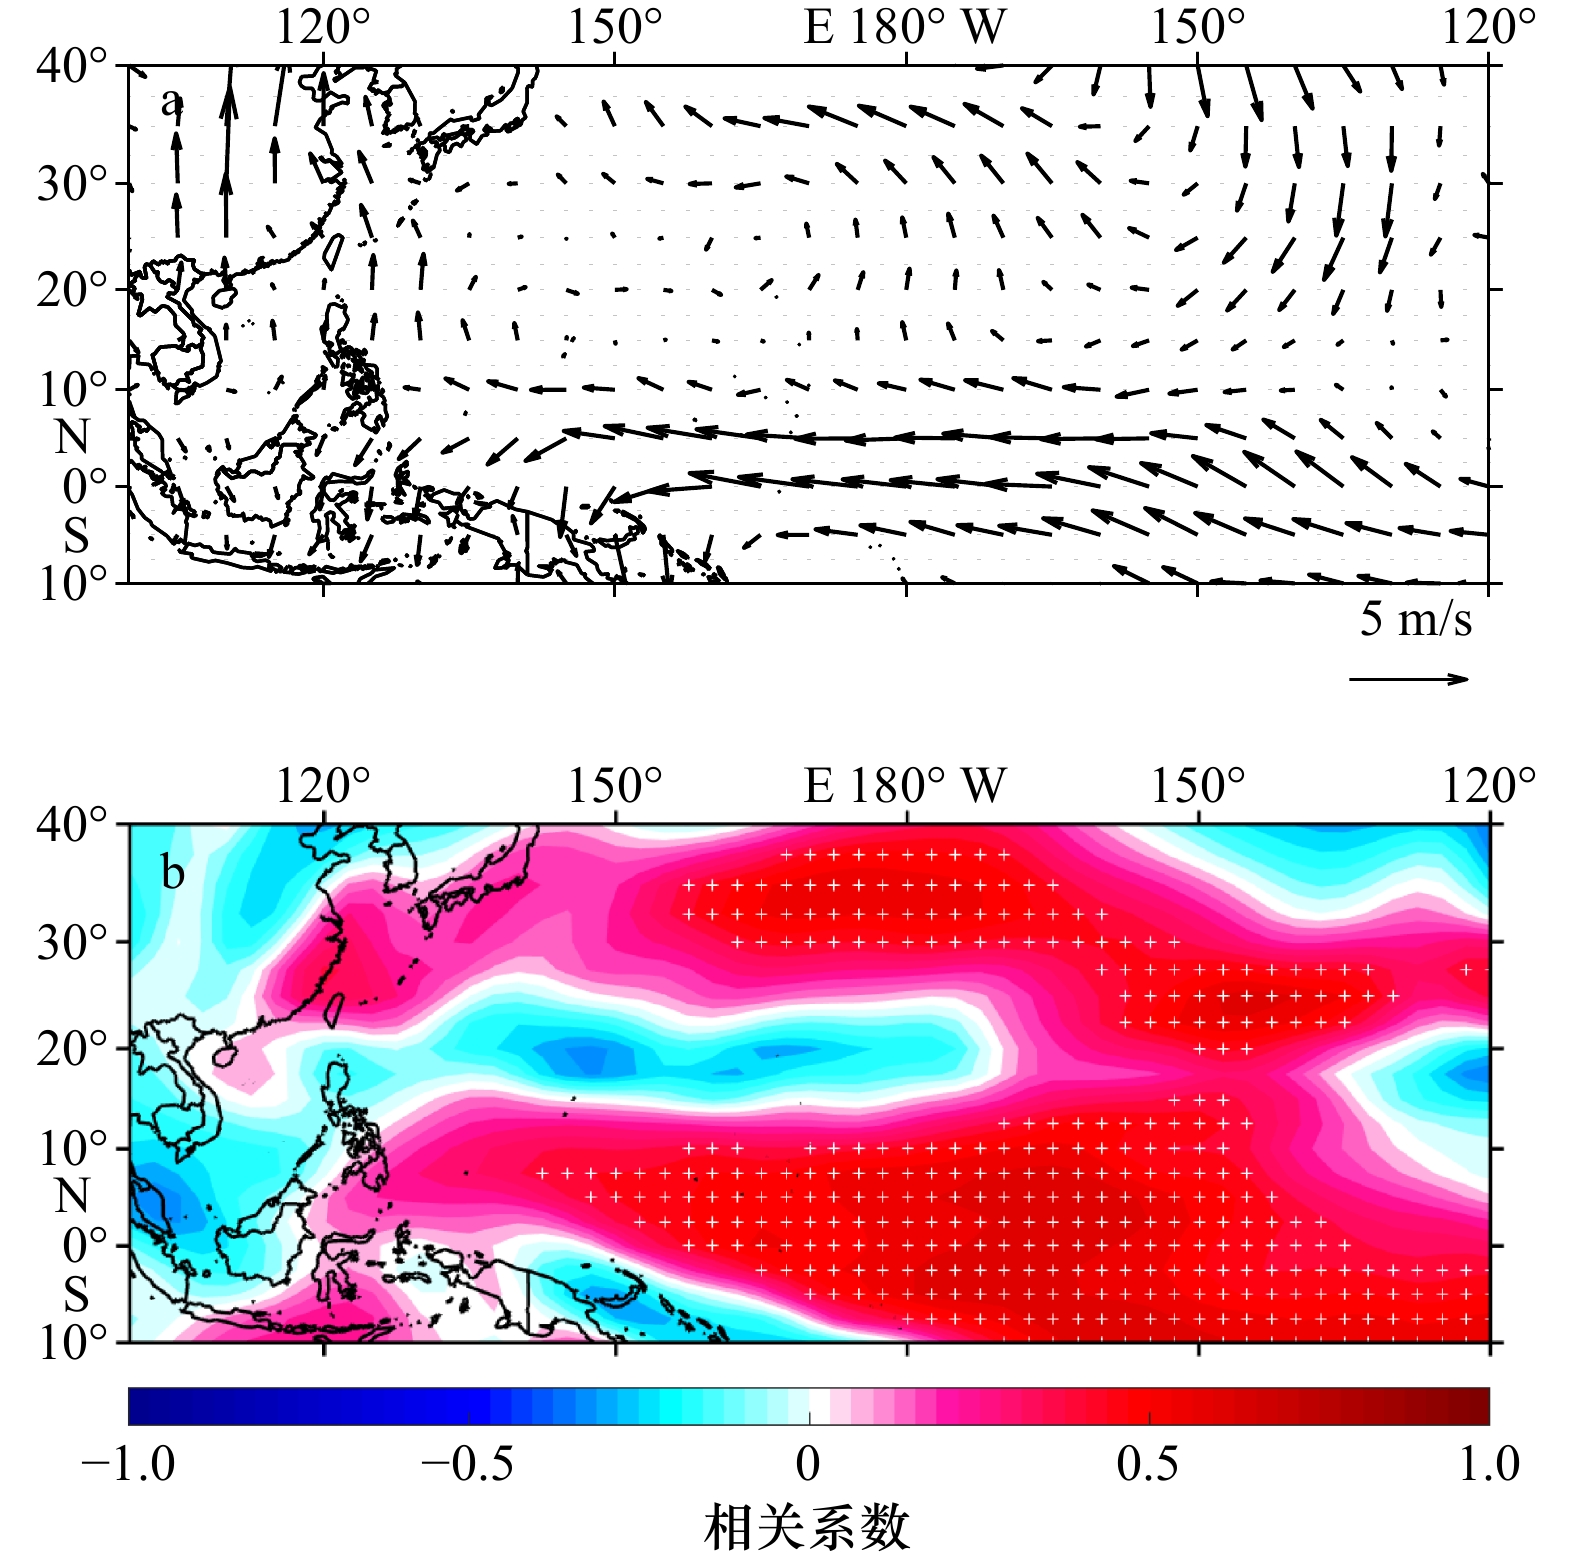
图 7 负PDO年和正PDO年850 hPa平均风场差异(a)和850 hPa纬向风与PDO指数的相关系数(b)分布
图b中白点表示该位置的相关系数通过了置信度为99%的显著性检验
Fig. 7 Difference of mean 850 hPa wind vectors between negative and positive PDO years (a) and correlation between 850 hPa wind and the PDO index (b)
The white dots in b indicate those exceeding the 99% significance level

图 8 正PDO年(a)和负PDO年(b)的平均TCHP (kJ/cm2,等值线)和TCHP异常(填色)
黑点代表RI位置,矩阵框表示RI主要区域
Fig. 8 Mean TCHP (kJ/cm2, contour) and TCHP anomaly(shaded) in positive (a) and negative (b) PDO years
The black dots represent the RI location. The rectangle boxes indicate the main RI region

图 9 TCHP与PDO指数的相关系数分布
白点表示该位置的相关系数通过了置信度为99%的显著性检验
Fig. 9 Correlation between TCHP and the PDO index
The white dots indicate those exceeding the 99% significance level

图 10 负PDO年和正PDO年海表面平均风场差异(a)和海表面纬向风(b)和经向风(c)与PDO指数的相关系数分布
图b和c中白点表示该位置的相关系数通过了置信度为99%的显著性检验
Fig. 10 Difference of mean surface wind vectors between negative and positive PDO years (a) and correlation between surface zonal wind and the PDO index (b), surface meridional wind and the PDO index (c)
The white dots in b and c indicate those exceeding the 99% significance level

图 11 正PDO年(a)和负PDO年(b)的平均RHUM(%,等值线)和RHUM异常(填色)
黑点代表RI位置,矩阵框表示主要的RI区域
Fig. 11 Mean RHUM (%, contour) and RHUM anomaly (shaded) in positive (a) and negative (b) PDO years
The black dots represent the RI location. The rectangle boxes indicate the main RI region
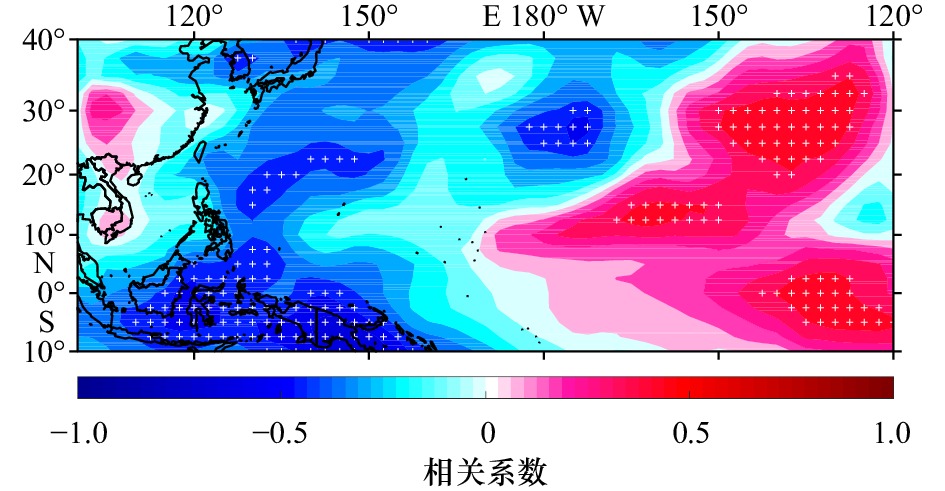
图 12 RHUM与PDO指数的相关系数分布
白点表示该位置的相关系数通过了置信度为99%的显著性检验
Fig. 12 Correlation between RHUM and the PDO index
The white dots indicate those exceeding the 99% significance level
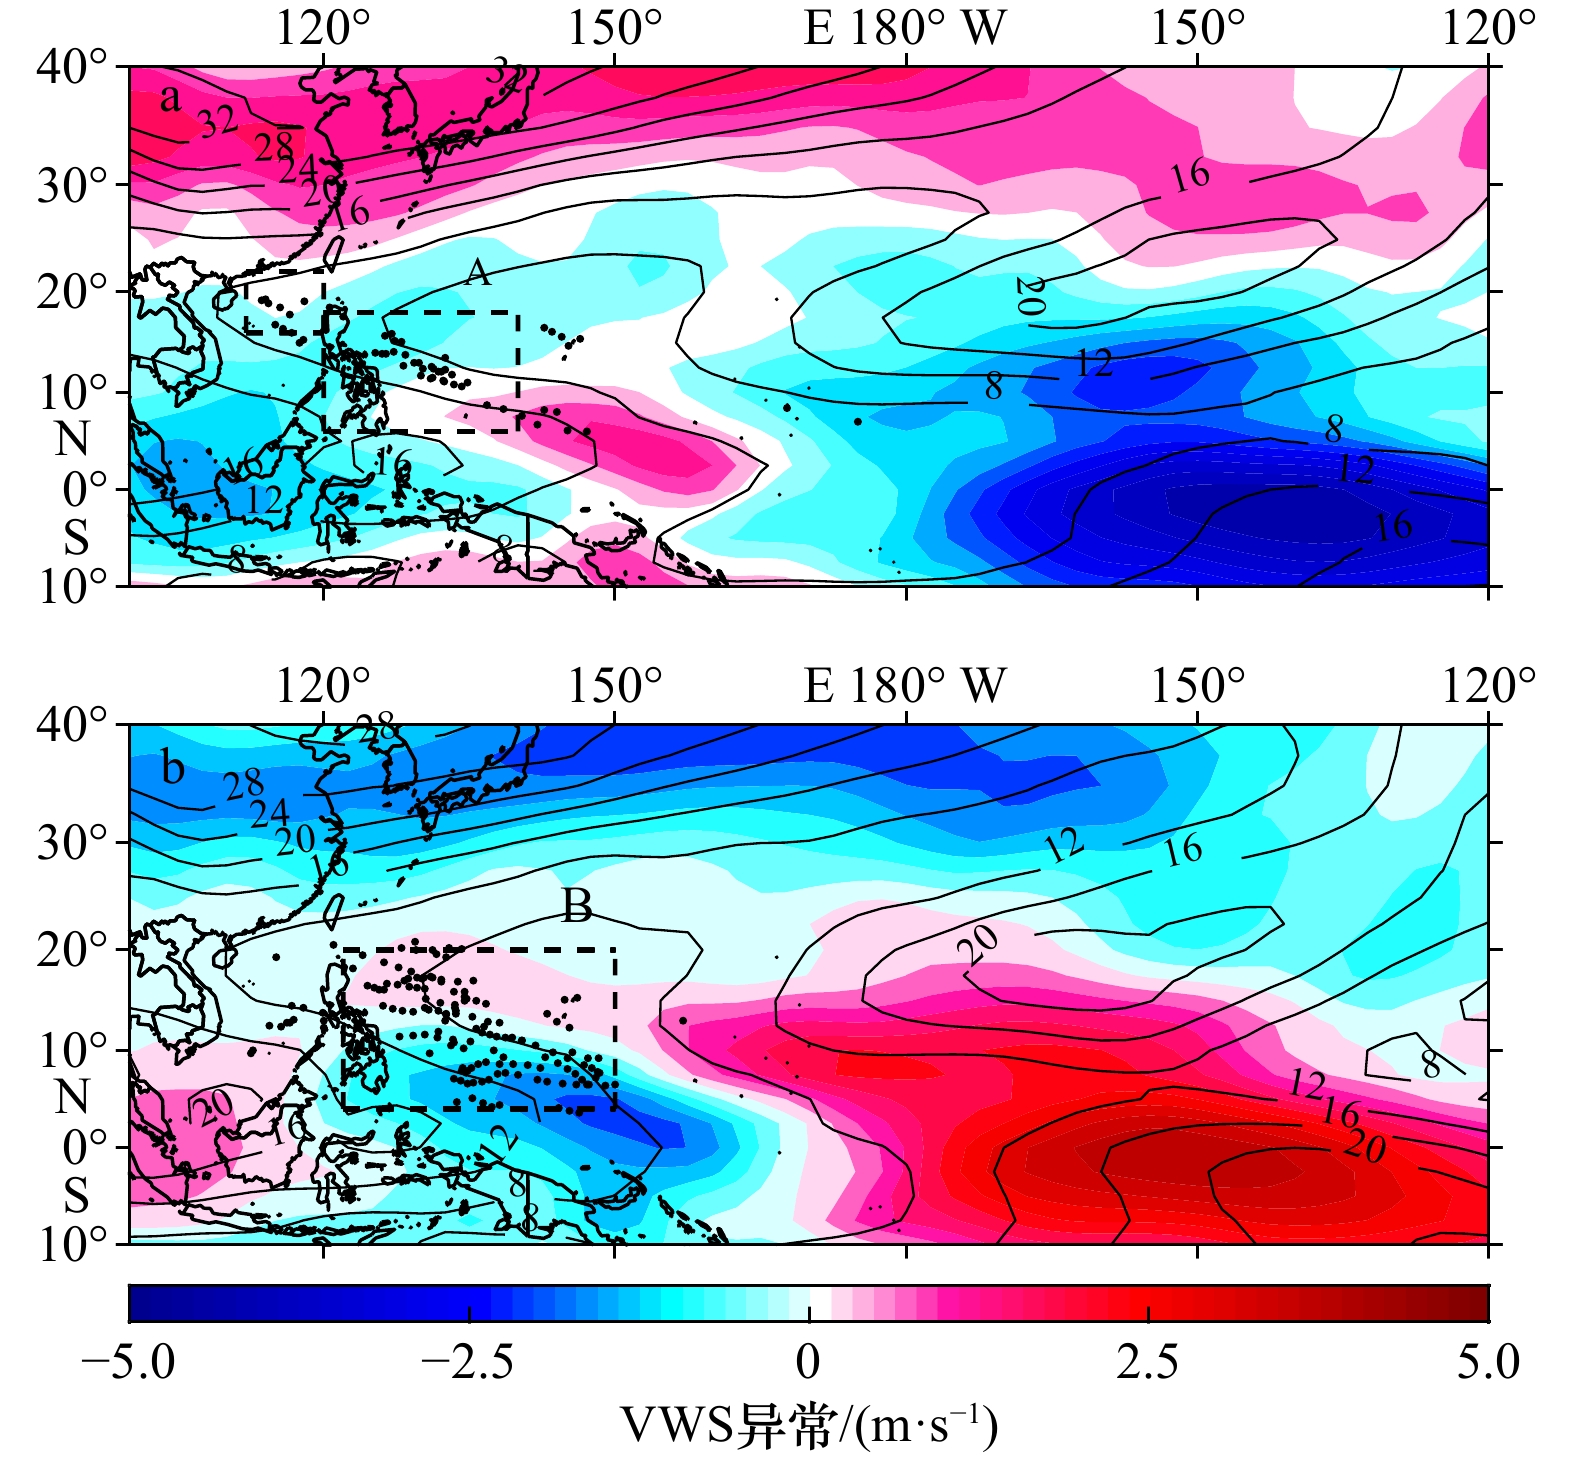
图 13 正PDO年(a)和负PDO年(b)的平均VWS (m/s,等值线)和VWS异常(填色)
黑点代表RI位置,矩阵框表示主要的RI区域
Fig. 13 Mean VWS (m/s, contour) and VWS anomaly (shaded) in positive (a) and negative (b) PDO years
The black dots represent the RI location. The rectangle boxes indicate the main RI region
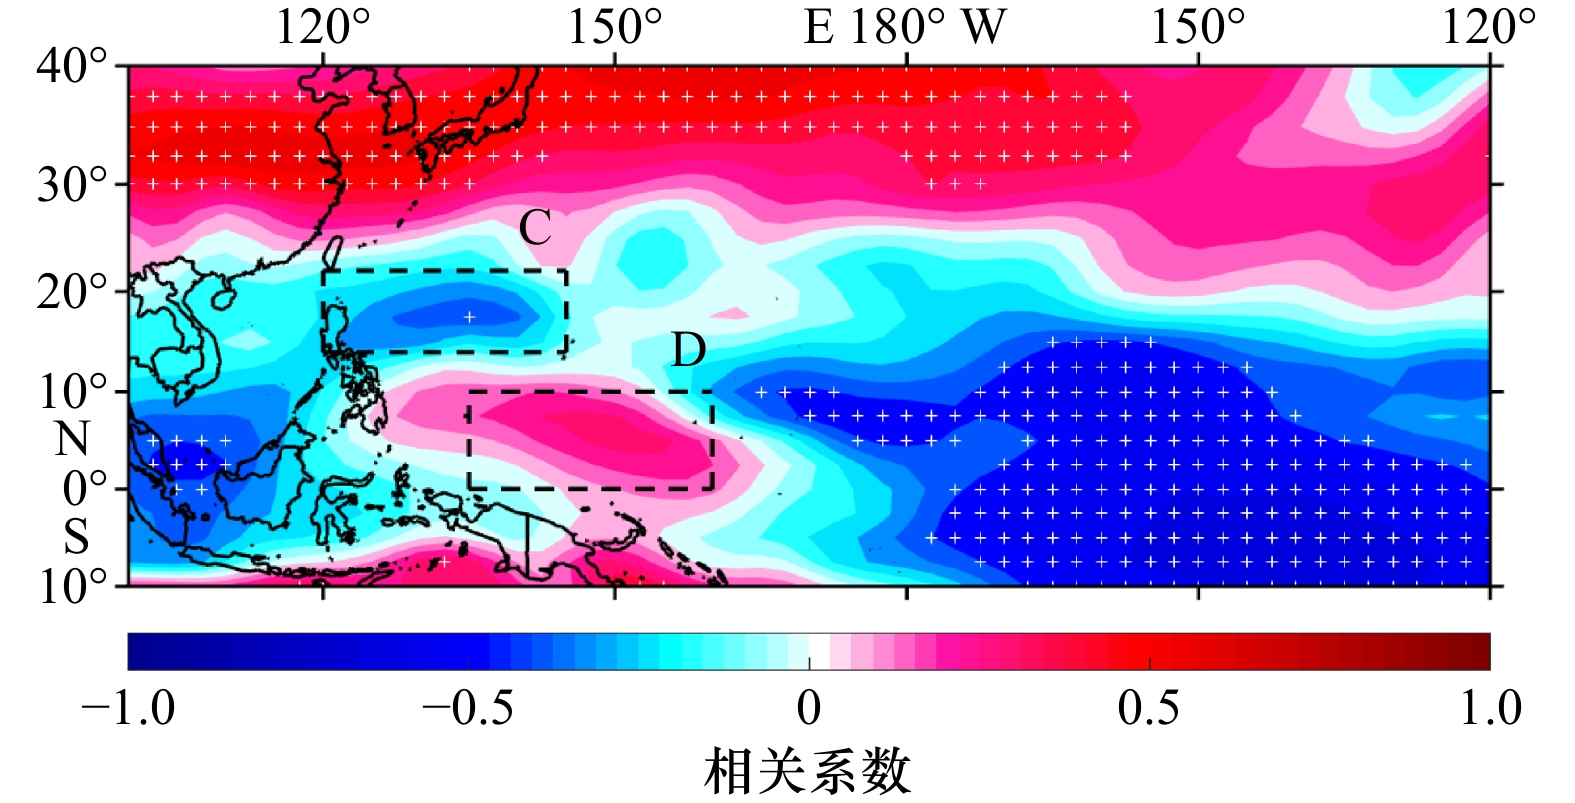
图 14 VWS与PDO指数的相关系数分布
白点表示该位置的相关系数通过了置信度为99%的显著性检验,矩阵框表示RI事体的相关区域
Fig. 14 Correlation between VWS and the PDO index
The white dots indicate those exceeding the 99% significance level. The rectangle boxes indicate the concentration regions of RI events
表 1 RI主要区域SST、TCHP、RHUM和VWS在正PDO年和负PDO年的平均值和差异
Tab. 1 Average magnitude for SST, TCHP, RHUM and VWS during positive and negative PDO years and difference for SST, TCHP, RHUM and VWS between positive and negative PDO years
要素 正PDO年 负PDO年 差异 SST/℃ 28.50 28.79 −0.29* TCHP/(kJ∙cm−2) 74.32 97.40 −23.08** RHUM/% 48.06 49.34 −1.28 VWS/(m∙s−1) 9.53 9.38 0.15 注:*表示差异通过了置信度为95%的显著性检验,**表示差异通过了置信度为99%的显著性检验。  下载: 导出CSV
-
[1] 周磊, 陈大可, 雷小途, 等. 海洋与台风相互作用研究进展[J]. 科学通报, 2019, 64(1): 60−72. doi: 10.1360/N972018-00668Zhou Lei, Chen Dake, Lei Xiaotu, et al. Progress and perspective on interactions between ocean and typhoon[J]. Chinese Science Bulletin, 2019, 64(1): 60−72. doi: 10.1360/N972018-00668 [2] Wang Chunzai, Wang Xidong, Weisberg R H, et al. Variability of tropical cyclone rapid intensification in the North Atlantic and its relationship with climate variations[J]. Climate Dynamics, 2017, 49(11/12): 3627−3645. [3] Kaplan J, Demaria M. Large-scale characteristics of rapidly intensifying tropical cyclones in the North Atlantic Basin[J]. Weather and Forecasting, 2003, 18(6): 1093−1108. doi: 10.1175/1520-0434(2003)018<1093:LCORIT>2.0.CO;2 [4] Kieu C, Tallapragada V, Hogsett W. Vertical structure of tropical cyclones at onset of the rapid intensification in the HWRF model[J]. Geophysical Research Letters, 2014, 41(9): 3298−3306. doi: 10.1002/2014GL059584 [5] Yan Ziyu, Ge Xuyang, Peng Melinda, et al. Does monsoon gyre always favour tropical cyclone rapid intensification?[J]. Quarterly Journal of the Royal Meteorological Society, 2019, 145(723): 2685−2697. doi: 10.1002/qj.3586 [6] Shu Shoujuan, Ming Jie, Chi Peng. Large-scale characteristics and probability of rapidly intensifying tropical cyclones in the Western North Pacific Basin[J]. Weather and Forecasting, 2012, 27(2): 411−423. doi: 10.1175/WAF-D-11-00042.1 [7] Lin Jialin, Qian Taotao. Rapid intensification of tropical cyclones observed by AMSU satellites[J]. Geophysical Research Letters, 2019, 46(12): 7054−7062. doi: 10.1029/2019GL083488 [8] Chih C H, Wu C C. Exploratory analysis of upper-ocean heat content and sea surface temperature underlying tropical cyclone rapid intensification in the Western North Pacific[J]. Journal of Climate, 2020, 33(3): 1031−1050. doi: 10.1175/JCLI-D-19-0305.1 [9] Guo Yipeng, Tan Zhemin. Westward migration of tropical cyclone rapid-intensification over the Northwestern Pacific during short duration El Niño[J]. Nature Communications, 2018, 9(1): 1507−1516. doi: 10.1038/s41467-018-03945-y [10] Benedetto K M, Trepanier J C. Climatology and spatiotemporal analysis of North Atlantic rapidly intensifying hurricanes (1851−2017)[J]. Atmosphere, 2020, 11(3): 291−313. doi: 10.3390/atmos11030291 [11] Mantua N J, Hare S R, Zhang Yuan, et al. A Pacific interdecadal climate oscillation with impacts on salmon production[J]. Bulletin of the American Meteorological Society, 1997, 78(6): 1069−1079. doi: 10.1175/1520-0477(1997)078<1069:APICOW>2.0.CO;2 [12] 李辑, 李菲, 林蓉, 等. 东亚盛夏北上转向台风年代际变化及与PDO的关系[J]. 热带气象学报, 2011, 27(5): 731−737. doi: 10.3969/j.issn.1004-4965.2011.05.015Li Ji, Li Fei, Lin Rong, et al. Interdecadal variations of midsummer northward-going typhoons over east Asia and the relationships with Pacific decadal oscillation[J]. Journal of Tropical Meteorology, 2011, 27(5): 731−737. doi: 10.3969/j.issn.1004-4965.2011.05.015 [13] 何鹏程, 江静. PDO对西北太平洋热带气旋活动与大尺度环流关系的影响[J]. 气象科学, 2011, 31(3): 266−273. doi: 10.3969/j.issn.1009-0827.2011.03.004He Pengcheng, Jiang Jing. Effect of PDO on the relationships between large scale circulation and tropical cyclone activity over the western North Pacific[J]. Scientia Meteorologica Sinica, 2011, 31(3): 266−273. doi: 10.3969/j.issn.1009-0827.2011.03.004 [14] 陆晓婕, 董昌明, 李刚. 1951−2015年进入东海的台风频数及登陆点的变化[J]. 大气科学学报, 2018, 41(4): 433−440.Lu Xiaojie, Dong Changming, Li Gang. Variations of typhoon frequency and landfall position in East China Sea from 1951 to 2015[J]. Transactions of Atmospheric Sciences, 2018, 41(4): 433−440. [15] Wang Xidong, Wang Chunzai, Zhang Liping, et al. Multidecadal variability of tropical cyclone rapid intensification in the western North Pacific[J]. Journal of Climate, 2015, 28(9): 3806−3820. doi: 10.1175/JCLI-D-14-00400.1 [16] Wang Xidong, Liu Hailong. PDO modulation of ENSO effect on tropical cyclone rapid intensification in the western North Pacific[J]. Climate Dynamics, 2016, 46(1/2): 15−28. [17] Zhao Haikun, Duan Xingyi, Raga G B, et al. Changes in characteristics of rapidly intensifying western North Pacific tropical cyclones related to climate regime shifts[J]. Journal of Climate, 2018, 31(19): 8163−8179. doi: 10.1175/JCLI-D-18-0029.1 [18] Zhao Haikun, Wang Chunzai. On the relationship between ENSO and tropical cyclones in the western North Pacific during the boreal summer[J]. Climate Dynamics, 2019, 52(1/2): 275−288. [19] 张亚杰, 陈升孛, 吴慧, 等. 对南海不同区域热带气旋气候特征的分析[J]. 海南大学学报(自然科学版), 2017, 35(1): 44−53.Zhang Yajie, Chen Shengbei, Wu Hui, et al. Climatic characteristics of tropical cyclones entering the different regions of the South China Sea[J]. Natural Science Journal of Hainan University, 2017, 35(1): 44−53. [20] Sun Jingru, Xu Fanghua, Oey L Y, et al. Monthly variability of Luzon Strait tropical cyclone intensification over the northern South China Sea in recent decades[J]. Climate Dynamics, 2019, 52(5/6): 3631−3642. [21] 廖菲, 李文婷, 张子然, 等. 1949−2017年南海海域热带气旋强度和路径快速变化统计特征[J]. 海洋学报, 2019, 41(9): 126−135.Liao Fei, Li Wenting, Zhang Ziran, et al. Analysis of rapid changes of tropical cyclones over the South China Sea for 1949−2017[J]. Haiyang Xuebao, 2019, 41(9): 126−135. [22] 朱晓金, 陈联寿. 我国近海热带气旋迅速加强活动特征及其与ENSO的关系[J]. 北京大学学报(自然科学版), 2011, 47(1): 52−58.Zhu Xiaojin, Chen Lianshou. Climatological characteristics of rapidly intensifying tropical cyclone over the coastal waters of China and the relationship with ENSO[J]. Acta Scientiarum Naturalium Universitatis Pekinensis, 2011, 47(1): 52−58. [23] Kalnay E, Kanamitsu M, Kistler R, et al. The NCEP/NCAR 40-year reanalysis project[J]. Bulletin of the American Meteorological Society, 1996, 77(3): 437−472. doi: 10.1175/1520-0477(1996)077<0437:TNYRP>2.0.CO;2 [24] Han Guijun, Li Wei, Zhang Xuefeng, et al. A new version of regional ocean reanalysis for coastal waters of China and adjacent seas[J]. Advances in Atmospheric Sciences, 2013, 30(4): 974−982. doi: 10.1007/s00376-012-2195-4 [25] Leipper D F, Volgenau D, Navy U S. Hurricane heat potential of the Gulf of Mexico[J]. Journal of Physical Oceanography, 1972, 2(3): 218−224. doi: 10.1175/1520-0485(1972)002<0218:HHPOTG>2.0.CO;2 [26] Wang B, Zhou X. Climate variation and prediction of rapid intensification in tropical cyclones in the western North Pacific[J]. Meteorology and Atmospheric Physics, 2008, 99(1/2): 1−16. [27] Medhaug I, Furevik T. North Atlantic 20th century multidecadal variability in coupled climate models: Sea surface temperature and ocean overturning circulation[J]. Ocean Science Discussions, 2011, 8(1): 353−396. [28] Wang Chunzai, Dong Shenfu, Evan A T, et al. Multidecadal covariability of North Atlantic sea surface temperature, African dust, Sahel rainfall, and Atlantic hurricanes[J]. Journal of Climate, 2012, 25(15): 5404−5415. doi: 10.1175/JCLI-D-11-00413.1 [29] 杨修群, 朱益民, 谢倩, 等. 太平洋年代际振荡的研究进展[J]. 大气科学, 2004, 28(6): 979−992. doi: 10.3878/j.issn.1006-9895.2004.06.15Yang Xiuqun, Zhu Yimin, Xie Qian, et al. Advances in studies of Pacific Decadal Oscillation[J]. Chinese Journal of Atmospheric Sciences, 2004, 28(6): 979−992. doi: 10.3878/j.issn.1006-9895.2004.06.15 [30] Newman M, Alexander M A, Ault T R, et al. The Pacific decadal oscillation, revisited[J]. Journal of Climate, 2016, 29(12): 4399−4427. doi: 10.1175/JCLI-D-15-0508.1 [31] Mantua N J, Hare S R. The Pacific decadal oscillation[J]. Journal of Oceanography, 2002, 58(1): 35−44. [32] Goh A Z C, Chan J C L. Interannual and interdecadal variations of tropical cyclone activity in the South China Sea[J]. International Journal of Climatology, 2010, 30(6): 827−843. doi: 10.1002/joc.1943 [33] Liu K S, Chan J C L. Inactive period of western North Pacific tropical cyclone activity in 1998−2011[J]. Journal of Climate, 2013, 26(8): 2614−2630. doi: 10.1175/JCLI-D-12-00053.1 [34] Choi J W, Kim H D. Negative relationship between Korea landfalling tropical cyclone activity and Pacific decadal oscillation[J]. Dynamics of Atmospheres and Oceans, 2019, 8: 101100. [35] Gray W M. Hurricanes: Their formation, structure and likely role in the tropical circulation. Meteorology over tropical oceans[C]//Shaw D B. Meteorology over the Tropical Oceans. Bracknell: James Glaisher House, 1979: 155−218. [36] Chan J C. Comment on “Changes in tropical cyclone number, duration, and intensity in a warming environment”[J]. Science, 2006, 311(5768): 1713b. [37] Emanuel K A. Thermodynamic control of hurricane intensity[J]. Nature, 1999, 401(6754): 665−669. doi: 10.1038/44326 [38] Wada A, Usui N. Importance of tropical cyclone heat potential for tropical cyclone intensity and intensification in the western North Pacific[J]. Journal of Oceanography, 2007, 63(3): 427−447. doi: 10.1007/s10872-007-0039-0 [39] Potter H, Dimarco S F, Knap A H. Tropical cyclone heat potential and the rapid intensification of hurricane Harvey in the Texas Bight[J]. Journal of Geophysical Research: Oceans, 2019, 124(4): 2440−2451. doi: 10.1029/2018JC014776 [40] Lin I I, Wu C C, Emanuel K A, et al. The interaction of supertyphoon Maemi (2003) with a warm ocean eddy[J]. Monthly Weather Review, 2005, 133(9): 2635−2649. doi: 10.1175/MWR3005.1 [41] Gray W. Environmental influences on tropical cyclones[J]. Australian Meteorological Magazine, 1988, 36: 127−139. [42] Shi Donglei, Ge Xuyang, Peng Melinda, et al. Characterization of tropical cyclone rapid intensification under two types of El Niño events in the western North Pacific[J]. International Journal of Climatology, 2020, 40(4): 2359−2372. doi: 10.1002/joc.6338 [43] Zheng Feng, Yue Caijun, Chen Peiyan, et al. Effects of SST, VWS, and DCC upon rapid intensification of off-shore typhoons in China Seas[J]. Journal of Tropical Meteorology, 2019, 25(1): 13−25. [44] Bond N A, Harrison D E. The Pacific decadal oscillation, air-sea interaction and central North Pacific winter atmospheric regimes[J]. Geophysical Research Letters, 2000, 27(5): 731−734. doi: 10.1029/1999GL010847 [45] Matsumura S, Horinouchi T. Pacific ocean decadal forcing of long-term changes in the western Pacific subtropical high[J]. Scientific Reports, 2016, 6(1): 37765. doi: 10.1038/srep37765 -

计量
- 文章访问数: 766
- HTML全文浏览量: 205
- PDF下载量: 94
- 被引次数: 0
