

Research on extraction algorithm of critical points of ocean flow field for topological analysis
-
摘要: 临界点是海洋流场拓扑结构中的重要构成要素,基于临界点的特征提取对于揭示海洋流场拓扑特征、开展海洋流场拓扑分析具有重要意义。本文基于临界点理论和Sperner引理,综合改进后的双线性插值算法和Sperner完全标号法,对海洋流场数据进行了临界点特征提取。首先,在双线性插值算法中添加滑动窗口处理,筛选临界点的候选网格单元,并采用聚合思想通过降低网格分辨率解决了网格插值中的二义性问题,同时考虑了0值网格存在的9种情形,通过迭代聚合思想滑动筛选候选网格单元,解决了插值网格均为0的情况。其次,提出了基于Sperner完全标号的最小值法临界点提取规则,将速度向量模最小的网格中心作为临界点,解决了实际流场物理场景中非0值的临界点提取。对两次提取结果进行合并、去重等处理,可以得到较为全面的临界点提取与分类结果。最后,通过对多个海域、不同深度流场数据的实验结果分析,证明了综合后的临界点提取方法的有效性及可行性。
-
关键词:
- 海洋流场 /
- 临界点提取 /
- 双线性插值 /
- Sperner完全标号 /
- 算法综合
Abstract: The critical point is an important component in the topological structure of the ocean flow field. Feature extraction based on the critical point is of great significance to reveal the topological characteristics of the ocean flow field and carry out the topological analysis of the ocean flow field. In this paper, based on critical point theory and Sperner lemma, the improved bilinear interpolation algorithm and Sperner complete labeling method were integrated to extract the critical point features of ocean flow field data. First of all, we added sliding window to the bilinear interpolation algorithm to filter the candidate grid cells of the critical points, and use the aggregation idea to solve the ambiguity problem of grid interpolation by reducing the grid resolution. At the same time, we considered nine cases of the zero value grid, and used the iterative aggregation idea to slide filter the candidate grid cell, which solves the case that the interpolation grids are all 0. Secondly, the extraction rule of critical points of minimum method based on Sperner complete labeling was proposed, and the grid center with the smallest velocity vector module is taken as the critical point to solve the non-zero critical point extraction in the actual flow field physical scene. By combining and de duplicating the two extraction results, more comprehensive critical point extraction and classification results can be obtained. Finally, through the analysis of the experimental results of the flow field data in multiple sea areas and different depths, the effectiveness and feasibility of the integrated critical point extraction algorithm was proved. -
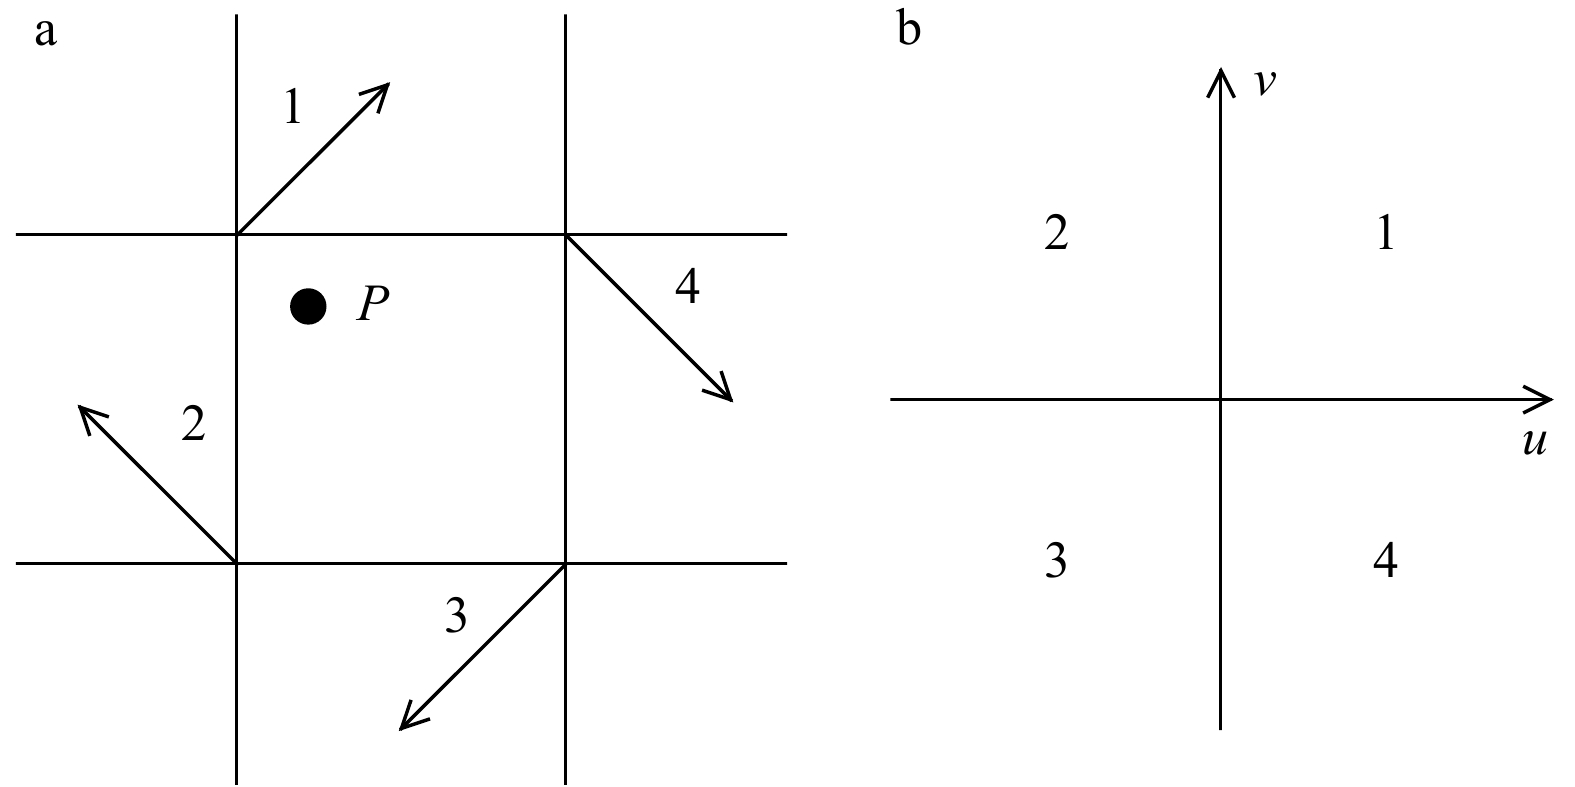
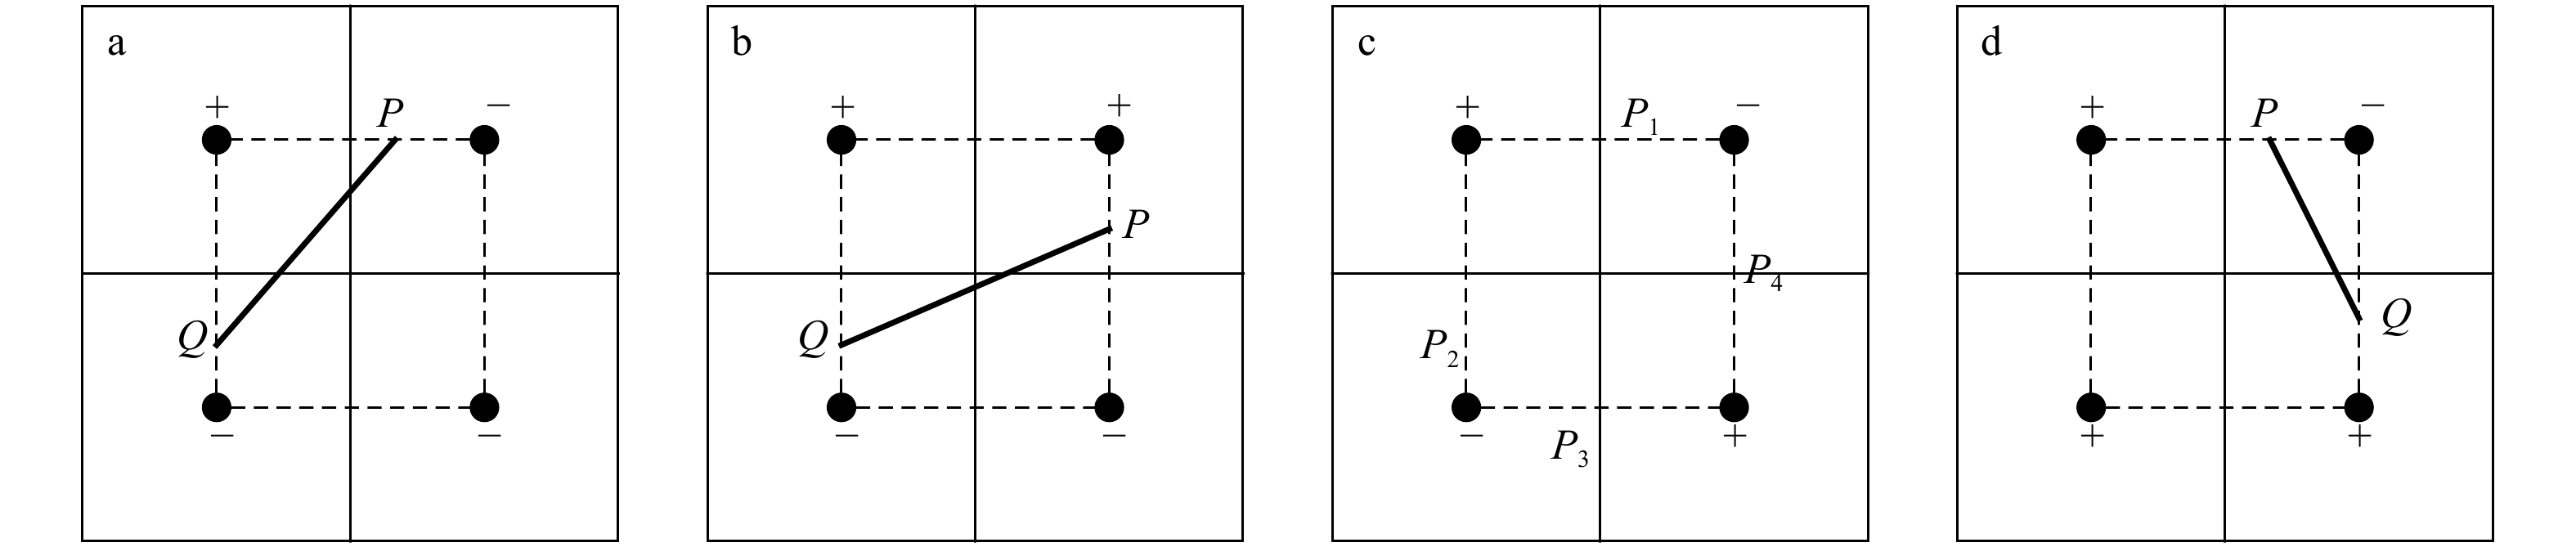
图 3 候选网格情况
●代表网格中心点;+、−代表海水流动的不同方向;P、Q点代表流速分量为0的点;虚线为网格中心点连线;加粗实线PQ为临界点等值线
Fig. 3 Candidate grid case
● represents the center of the grid; +, − represent the different directions of seawater flow; P and Q represent the points with zero velocity component; dashed lines are the grid center lines; bold solid PQ is the contour of critical point
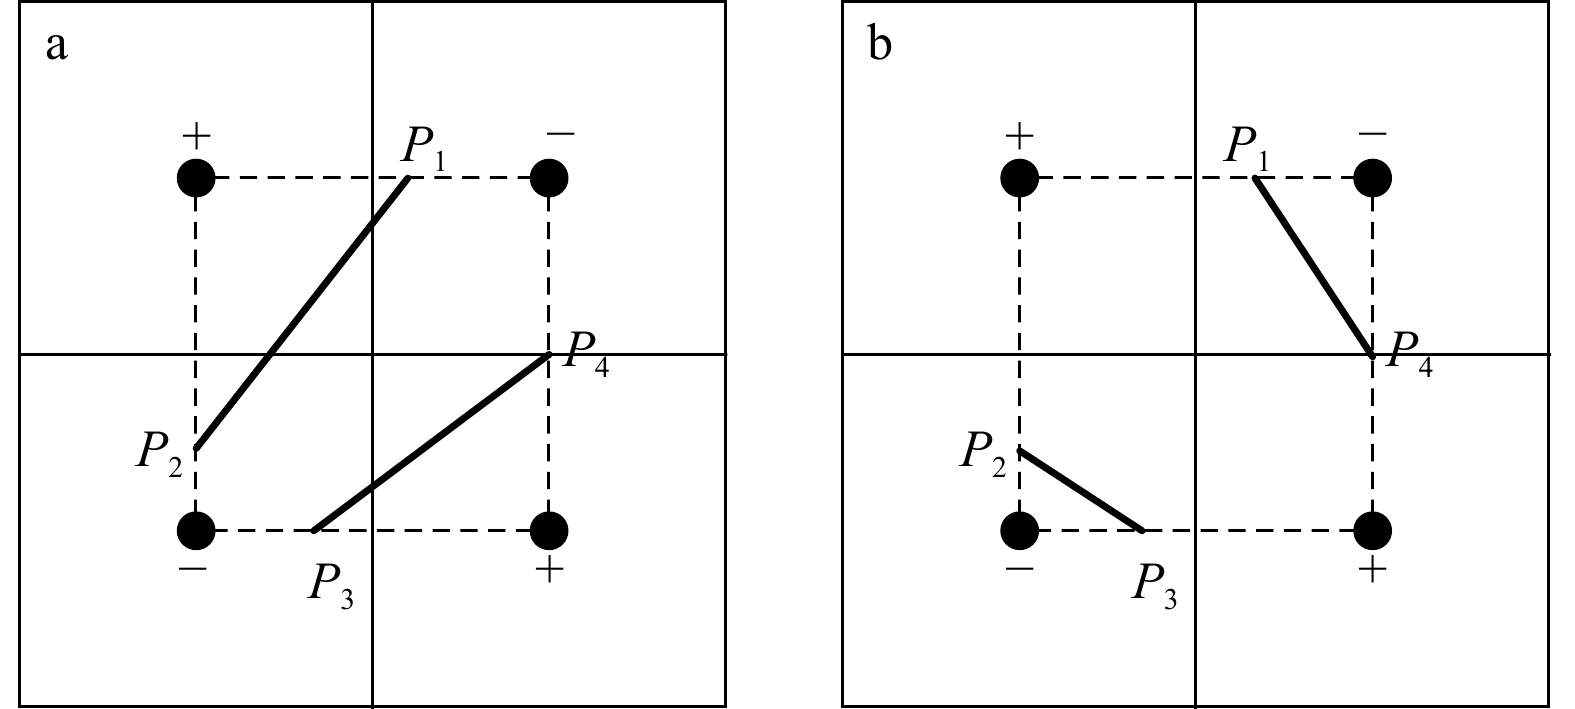
图 4 二义性网格
●代表网格中心点;+、−代表海水流动的不同方向;P点代表流速分量为0的点;虚线为网格中心点连线;加粗实线为临界点等值线
Fig. 4 Ambiguous grid
● represents the center of the grid; +, − represent the different directions of seawater flow; P represents the points with zero velocity component; dashed lines are the grid center lines; bold solid lines are the contours of critical point

图 5 网格值含0的情况
●代表网格中心点;+、−代表海水流动的不同方向;P点代表流速分量为0的点;虚线为网格中心点连线;加粗实线为临界点等值线
Fig. 5 Grid value with 0
● represents the center of the grid; +, − represent the different directions of seawater flow; P represents the point with zero velocity component; dashed lines are the grid center lines; bold solid lines are the contours of critical point

图 6 双线性插值过程图
●代表网格中心点;+、−代表海水流动的不同方向;P、Q点代表流速分量为0的点;虚线为网格中心点连线;加粗实线PQ为临界点等值线
Fig. 6 Bilinear interpolation process chart
● represents the center of the grid; +, − represent the different directions of seawater flow; P and Q represent the points with 0 velocity component; dashed lines are the grid center lines; bold solid PQ is the contour of critical point
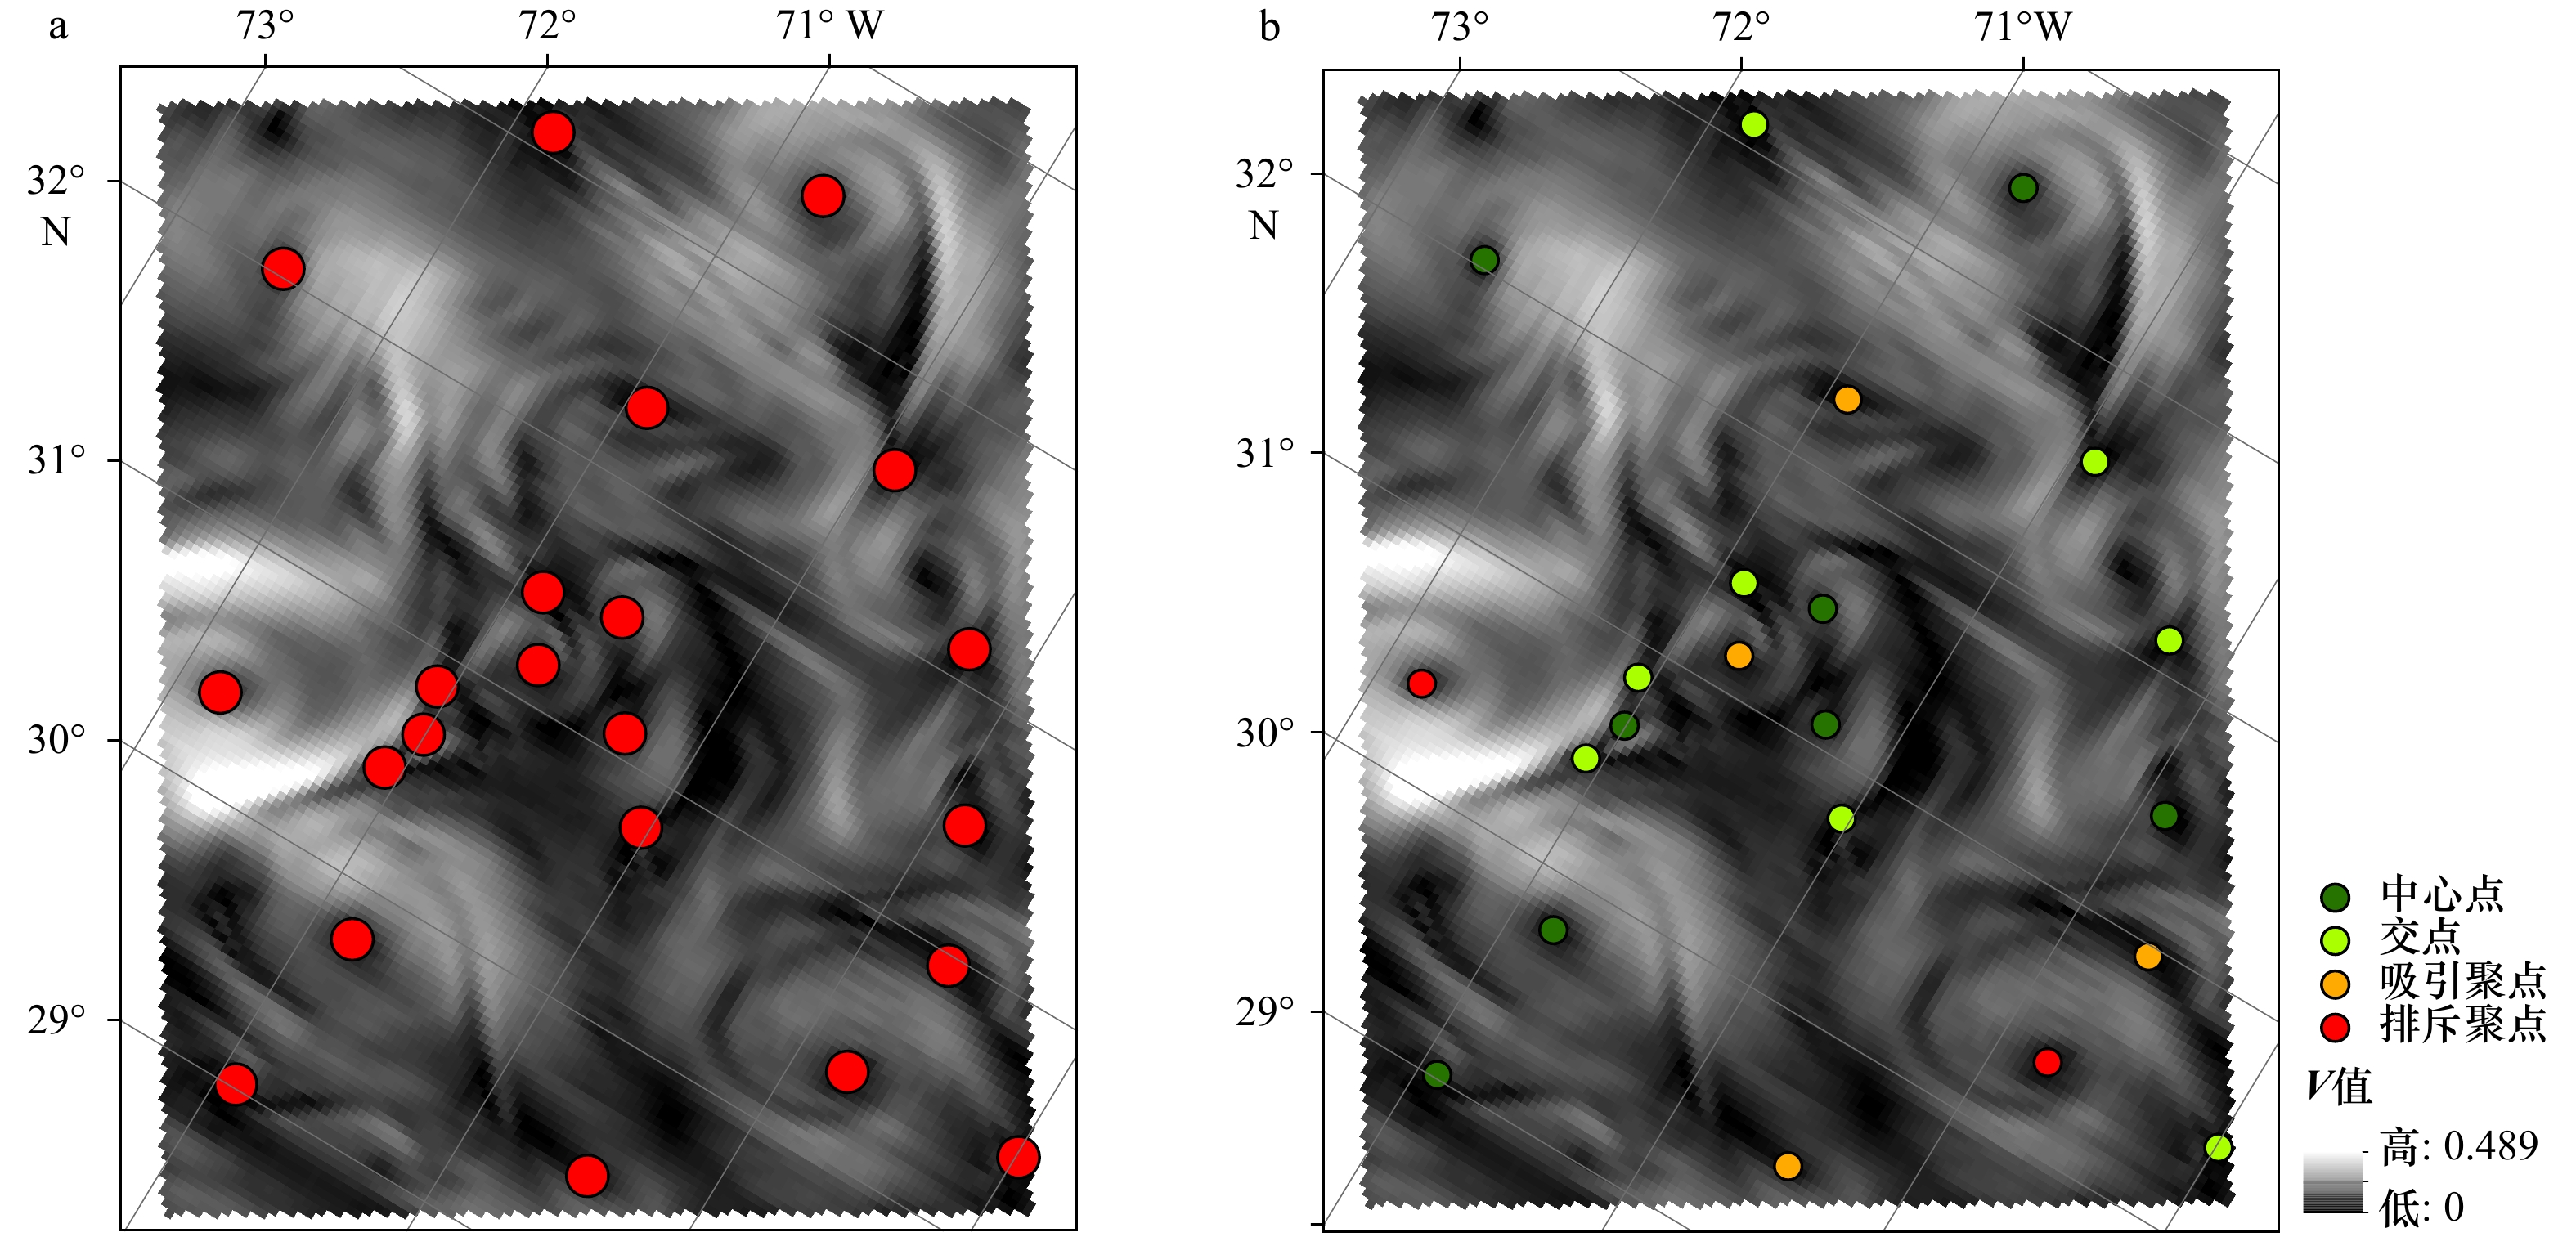
图 7 基于双线性插值的临界点提取(a)与分类(b)结果
Fig. 7 Extraction (a) and classification (b) of critical points based on bilinear interpolation
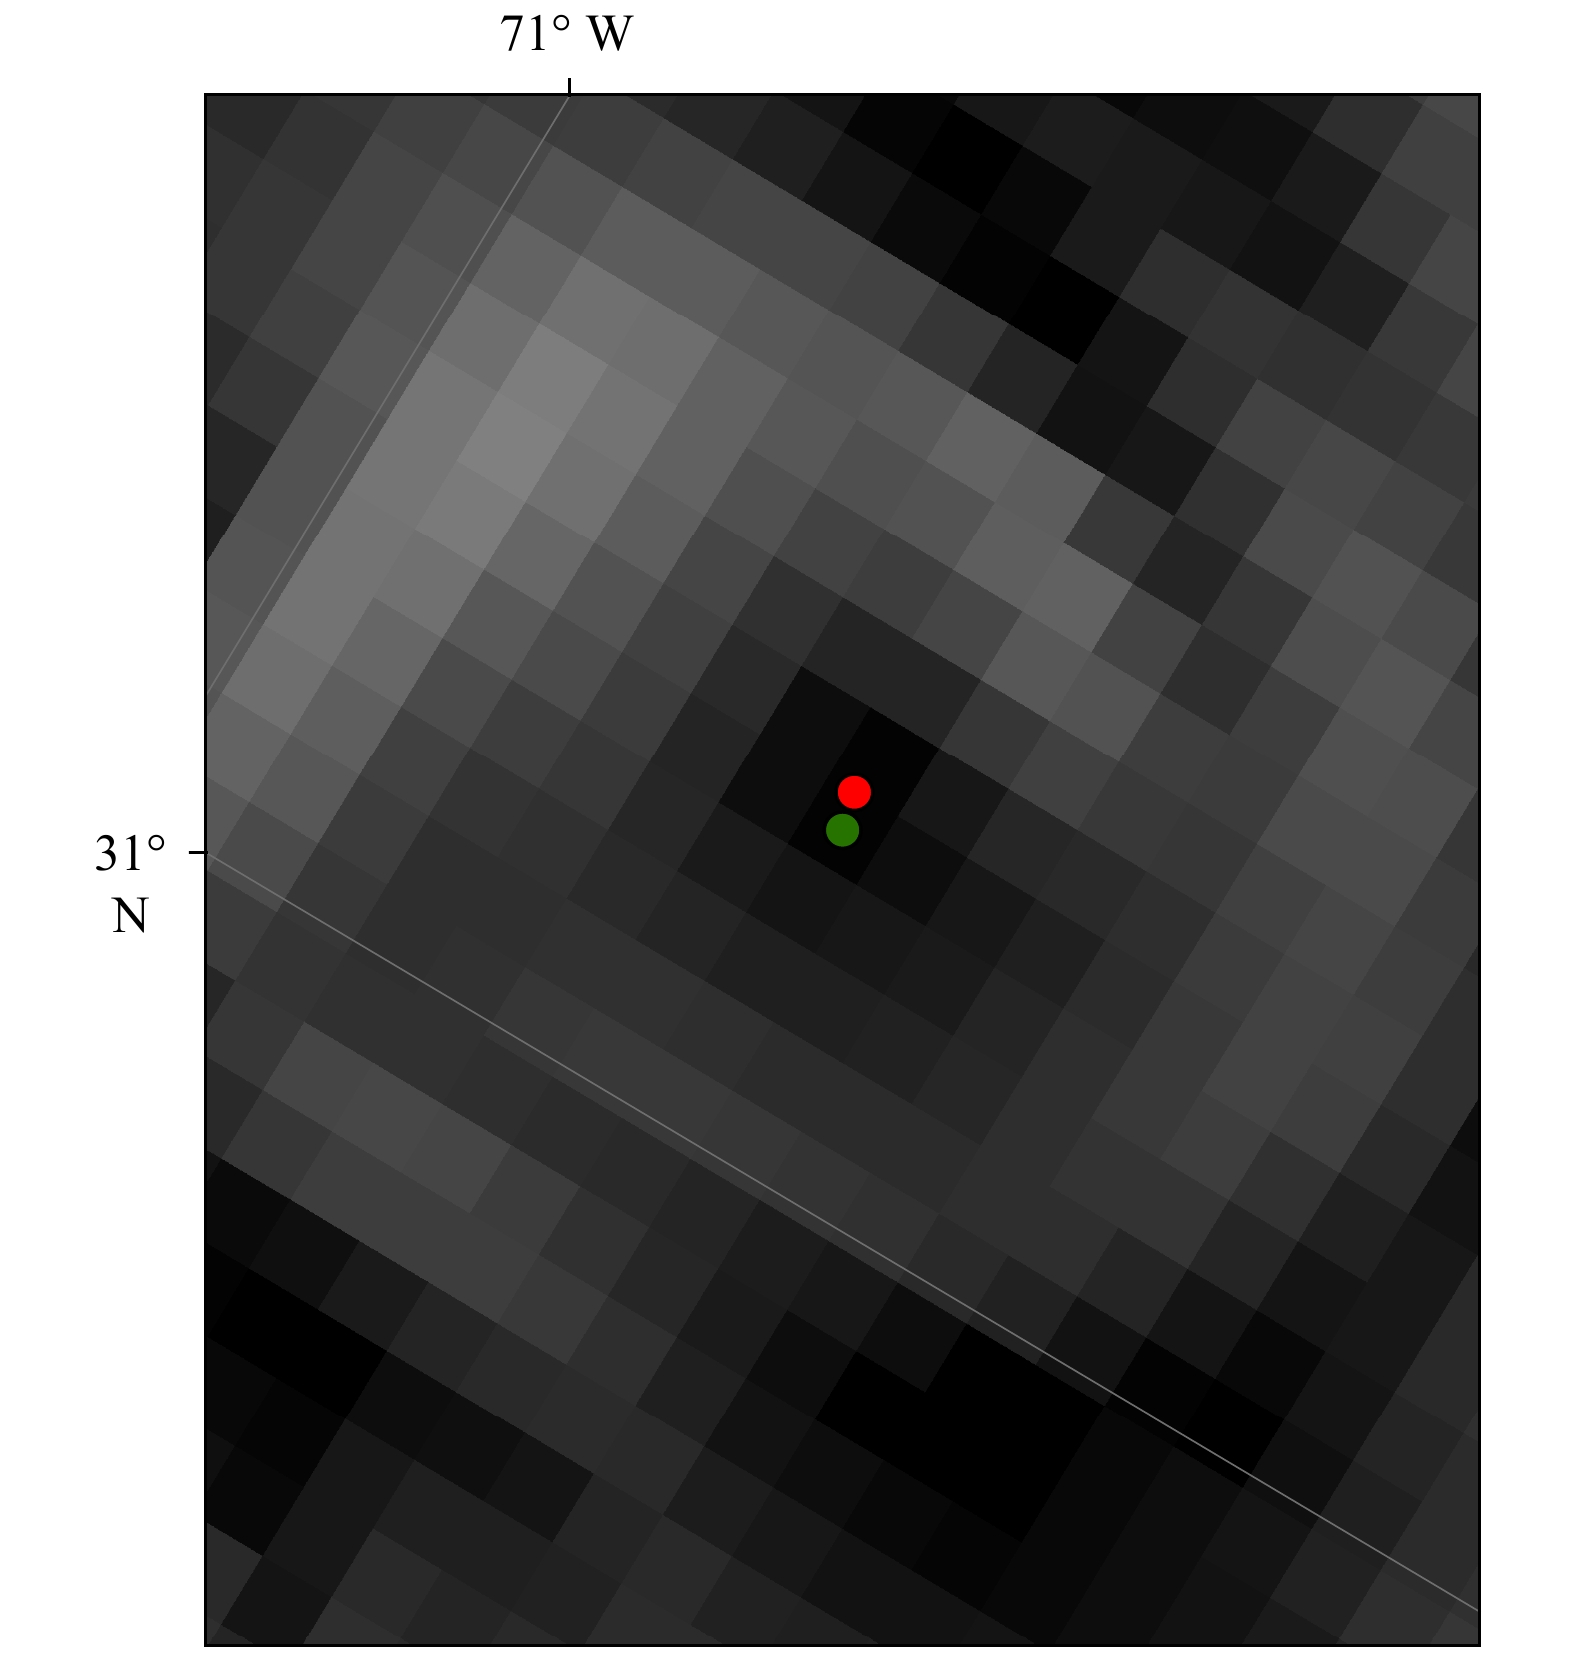
图 8 插值与最小值法提取结果对比
Fig. 8 Comparison between the results of interpolation and minimum method
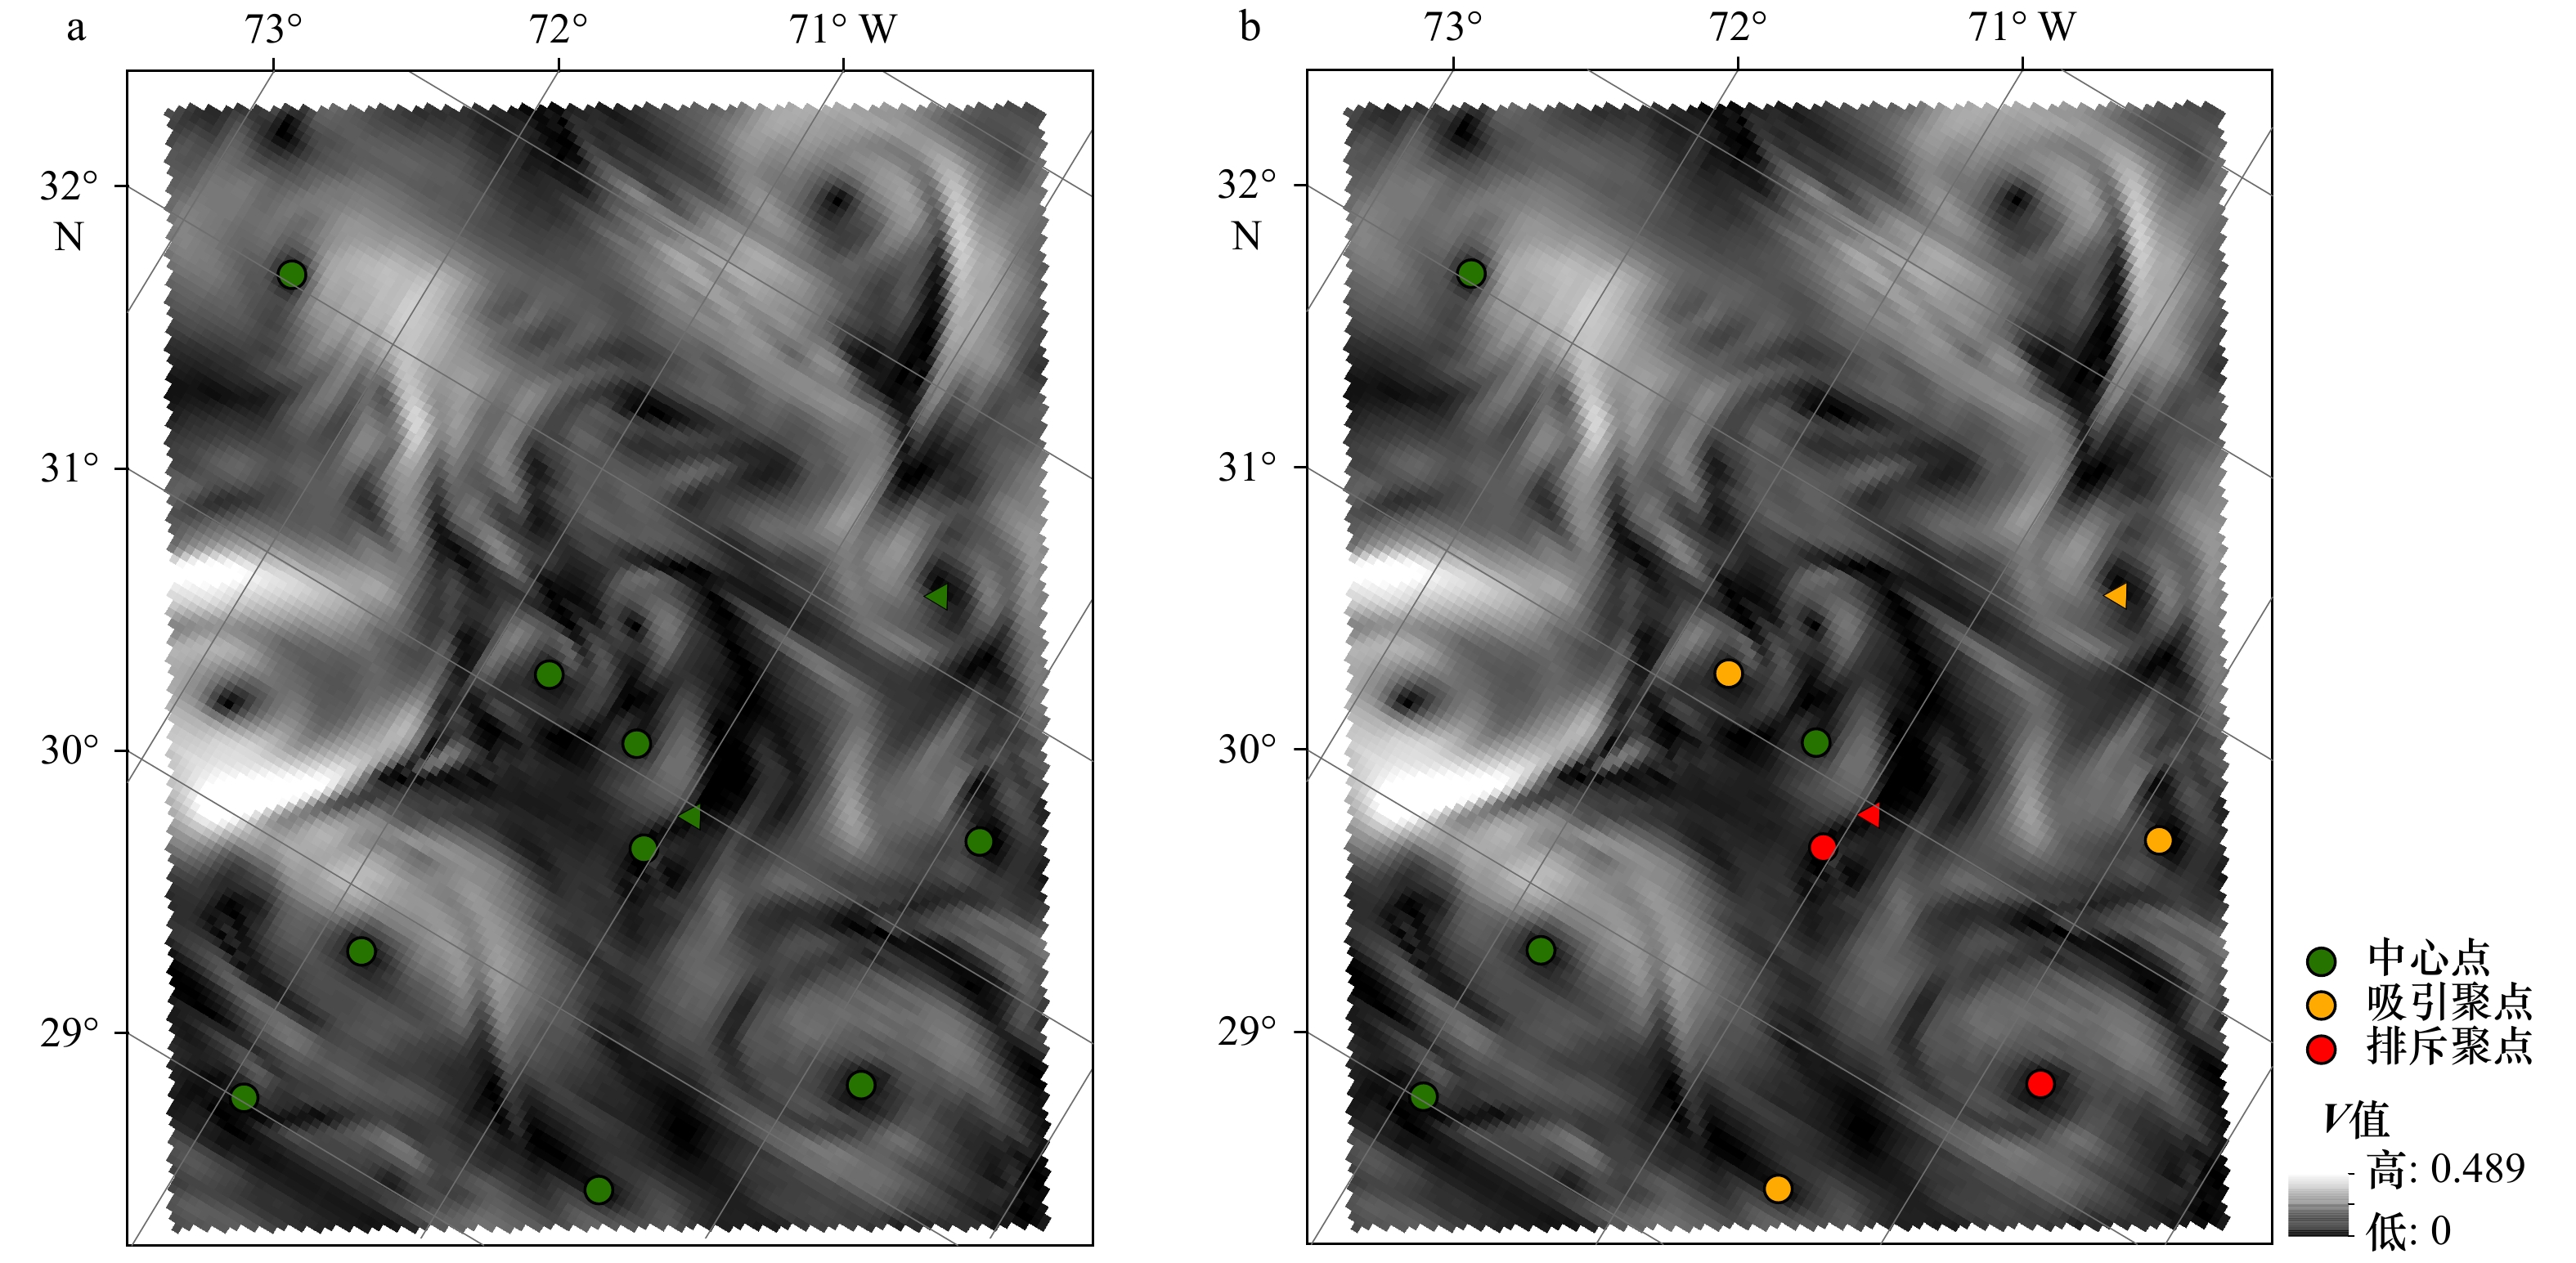
图 9 基于Sperner完全标号的临界点提取(a)与分类(b)结果
三角符号为双线性插值法未提出的临界点
Fig. 9 Extraction (a) and classification (b) of critical points based on Sperner fully labeled
Trigonometric symbols are the critical points not extracted by bilinear interpolation

图 10 综合提取分类结果
b中的三角符号为Sperner完全标号提取双线性插值未提取的临界点
Fig. 10 Comprehensive extraction and classification result chart
In figure b, the triangle symbol represents the critical points extracted by Sperner complete labeling, which are not extracted by bilinear interpolation
表 1 两种方法分类结果统计表
Tab. 1 Statistical table of classification results of two methods
中心点 鞍点 交点 排斥聚点 吸引聚点 双线性插值分类结果 8 0 8 2 4 Sperner分类结果 4 0 0 3 4  下载: 导出CSV
表 2 不同数据验证结果
Tab. 2 Different data validation results
美国沿海 5 000 m 大西洋 2 500 m 太平洋 3 000 m 双线性插值 


Sperner完全标号 


综合结果 


 中心点;
中心点; 交点;
交点; 吸引聚点;
吸引聚点; 排斥聚点
下载: 导出CSV
排斥聚点
下载: 导出CSV
-
[1] Helman J L, Hesselink L. Visualizing vector field topology in fluid flows[J]. IEEE Computer Graphics and Applications, 1991, 11(3): 36−46. doi: 10.1109/38.79452 [2] Helman J L, Hesselink L. Surface representations of two-and three-dimensional fluid flow topology[C]//Proceedings of the First IEEE Conference on Visualization: Visualization 90. San Francisco: IEEE, 1990: 6–13. [3] Lavin Y M, Batra R, Hesselink L. Feature comparisons of vector fields using Earth Mover’s distance[C]//Proceedings of the Conference on Visualization '98. Washington: IEEE, 1998: 103–109. [4] Batra R, Hesselink L. Feature comparisons of 3-d vector fields using Earth Mover’s distance[C]//Proceedings of the Conference on Visualization’99: Celebrating Ten Years. San Francisco: IEEE Computer Society Press, 1999: 105–114. [5] Bhatia H, Gyulassy A, Wang Hao, et al. Robust detection of singularities in vector fields[M]//Bremer P T, Hotz I, Pascucci V, et al. Topological Methods in Data Analysis and Visualization III. Mathematics and Visualization. Cham: Springer, 2014: 3−18. [6] 王文涛. 非结构化网格分片线性矢量场高效可视化技术研究[D]. 长沙: 国防科学技术大学, 2016.Wang Wentao. Efficient visualization techniques for piecewise linear vector fields on unstructured grids[D]. Changsha: National University of Defense Technology, 2016. [7] 吴晓莉, 史美萍, 贺汉根. 基于特征提取的三维流线分布算法[J]. 国防科技大学学报, 2008, 30(2): 102−106. doi: 10.3969/j.issn.1001-2486.2008.02.021Wu Xiaoli, Shi Meiping, He Hangen. Feature extracting based 3D streamline placement algorithm[J]. Journal of National University of Defense Technology, 2008, 30(2): 102−106. doi: 10.3969/j.issn.1001-2486.2008.02.021 [8] Polthier K. Preuß E. Variational approach to vector field decomposition[C]//de Leeuw W C, van Liere R. Data Visualization 2000. Eurographics. Vienna: Springer, 2000: 147−155. [9] Polthier K, Preuß E. Identifying vector field singularities using a discrete Hodge decomposition[C]//Hege H C, Polthier K. Visualization and mathematics Ⅲ. Mathematics and Visualization. Berlin, Heidelberg: Springer, 2003: 113−134. [10] Chen Guoning, Mischaikow K, Laramee R S, et al. Efficient Morse decompositions of vector fields[J]. IEEE Transactions on Visualization and Computer Graphics, 2008, 14(4): 848−862. doi: 10.1109/TVCG.2008.33 [11] 管倩倩. 基于拓扑分析的海洋特征结构的提取研究——海洋水团自动划分的Morse-Smale分解途径[D]. 青岛: 中国海洋大学, 2006.Guan Qianqian. Extract and research based on the topological analysis for ocean feature structure−a Morse-Smale decomposition approach for automatical partition of ocean water masses[D]. Qingdao: Ocean University of China, 2006. [12] 廖忠云. 基于拓扑学理论的海洋流场时空特征分析与可视化表达研究[D]. 青岛: 山东科技大学, 2017.Liao Zhongyun. The research of spatio-temporal feature analysis and visualization on marine flow field based on topological theory[D]. Qingdao: Shandong University of Science and Technology, 2017. [13] 王辉赞, 郭芃, 倪钦彪, 等. 基于密度峰值聚类的中尺度涡轨迹自动追踪方法[J]. 海洋学报, 2018, 40(8): 1−9.Wang Huizan, Guo Peng, Ni Qinbiao, et al. A CFSFDP clustering-based eddy trajectory tracking method[J]. Haiyang Xuebao, 2018, 40(8): 1−9. [14] 牛婵, 梁猛, 高瑞波, 等. 基于信息熵的流场特征提取及可视化研究[J]. 燕山大学学报, 2019, 43(4): 364−369. doi: 10.3969/j.issn.1007-791X.2019.04.012Niu Chan, Liang Meng, Gao Ruibo, et al. Research on feature extracting of flow field based on information entropy and visualization[J]. Journal of Yanshan University, 2019, 43(4): 364−369. doi: 10.3969/j.issn.1007-791X.2019.04.012 [15] 李晓聪. 海洋流场涡旋特征提取及可视化研究[D]. 青岛: 中国海洋大学, 2009.Li Xiaocong. Feature extraction of ocean field vortices and visualization research[D]. Qingdao: Ocean University of China, 2009. [16] Scheuermann G, Hagen H, Kruger H, et al. Visualization of higher order singularities in vector fields[C]//Proceedings of the 8th conference on Visualization '97. Washington: IEEE, 1997: 67−74. [17] Mann S, Rockwood A. Computing singularities of 3D vector fields with geometric algebra[C]//Proceedings of the Conference on Visualization’02. Boston, Massachusetts: IEEE, 2002: 283−290. [18] 颜廷华. 基于物理特征的海洋流场可视化技术研究[D]. 青岛: 中国海洋大学, 2008.Yan Tinghua. Research on marine flow visualization technology based on the physical characteristics[D]. Qingdao: Ocean University of China, 2008. [19] Tricoche X, Garth C, Sanderson A. Visualization of topological structures in area-preserving maps[J]. IEEE Transactions on Visualization and Computer Graphics, 2011, 17(12): 1765−1774. doi: 10.1109/TVCG.2011.254 [20] Tricoche X, Garth C, Sanderson A, et al. Visualizing invariant manifolds in area-preserving maps[C]//Topological Methods in Data Analysis and Visualization II: Theory, Algorithms, and Applications. Berlin, Heidelberg: Springer, 2012: 109−124. [21] Schechter E. Handbook of Analysis and its Foundations[M]. San Diego: Academic Press, 1997. [22] 吴晓莉. 面向空间遥科学实验的流场可视化技术研究[D]. 长沙: 国防科学技术大学, 2007.Wu Xiaoli. Flow visualization research for space Tele-Science experiment[D]. Changsha: National University of Defense Technology, 2007. [23] 陈晓芬. 平面向量场源、汇特征检测及可视化研究[D]. 青岛: 中国海洋大学, 2009.Chen Xiaofen. Research on feature detection and visualization of sources and sinks in a planar vector field[D]. Qingdao: Ocean University of China, 2009. -

计量
- 文章访问数: 349
- HTML全文浏览量: 174
- PDF下载量: 21
- 被引次数: 0
