

Seasonal variability of the M2 constituent in the Bohai Bay: Application of enhanced harmonic analysis
-
摘要: M2分潮的季节变化对沿海的海洋环境有着重要影响。增强调和分析(EHA)既可以提取主要分潮时变的振幅和迟角,同时可以得到其他分潮不随时间变化的振幅和迟角。本文利用EHA分析渤海湾两个站点的水位数据,研究了渤海湾M2分潮的季节变化。为了评估EHA方法的准确性,在理想实验中设计了人造“水位数据”。利用EHA分析得到的M2分潮时变振幅和迟角以及S2、K1、O1分潮不随时间变化的振幅和迟角均比其他方法得到的结果更接近给定值,表明了EHA的有效性和可用性。当使用EHA分析渤海湾实际海平面观测数据时,得到的M2分潮振幅具有明显的季节变化特征:夏季较大,冬季较小。敏感性实验表明,分析所得渤海湾M2分潮振幅的季节变化趋势不受实验设置的影响,是鲁棒的,能够反映该海域真实的M2分潮季节变化。此外,渤海湾M2分潮振幅的季节变化可能是东亚季风通过影响平均海平面、层化和涡动黏性系数的季节变化而引起的。Abstract: The seasonal variability of M2 constituent exerts a major influence on the coastal ocean environment. The enhanced harmonic analysis (EHA) can synchronously extract the temporally varying amplitudes and phase lags of significant constituent and the constant values of the other constituents. In this study, the seasonal variability of the M2 constituent in the Bohai Bay, China, is investigated by analyzing one-year sea level observations at two stations with EHA. In order to evaluate the accuracy of EHA, artificial "sea level" is designed in the ideal experiment. Both the estimated temporally varying amplitude and phase lag of the M2 constituent and constant values of the S2, K1 and O1 constituents using EHA were much closer to the prescribed values than those obtained using the other methods, indicating the capability and efficacy of EHA. When the real sea level observations were analyzed using EHA, the estimated M2 constituent amplitude has significant seasonal variability, with large values in summer and small values in winter. The sensitivity experiments show that the trend of seasonal variation of M2 amplitude in Bohai Bay is not affected by the experimental settings, and it is robust and can reflect the real seasonal variation of M2 constituent. The seasonal variations in the M2 amplitude is possibly induced by the seasonally alternating Asia monsoon, as the Asia monsoon dominates the seasonality of mean sea level, stratification and eddy viscosity, which are main influence factors summarized in the previous studies.
-
Key words:
- the M2 constituent /
- seasonal variability /
- enhanced harmonic analysis /
- Bohai Bay
-
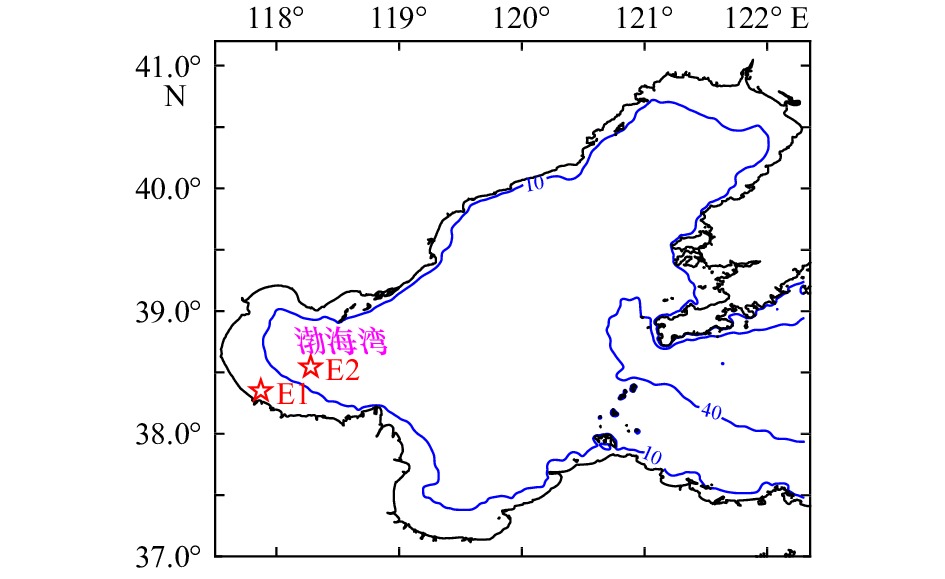
图 1 渤海湾观测站E1和E2的位置(红星),以及10 m和40 m水深线
Fig. 1 The locations of the observation stations (E1 and E2, red stars) in the Bohai Bay, and the isobathymetric lines at 10 m and 40 m

图 2 E1(a)和E2(b)站的水位观测数据
洋红色实线描述了观测的时间段
Fig. 2 The observed sea level at E1(a) and E2(b) stations
The magenta solid lines describe the temporal locations of the observations
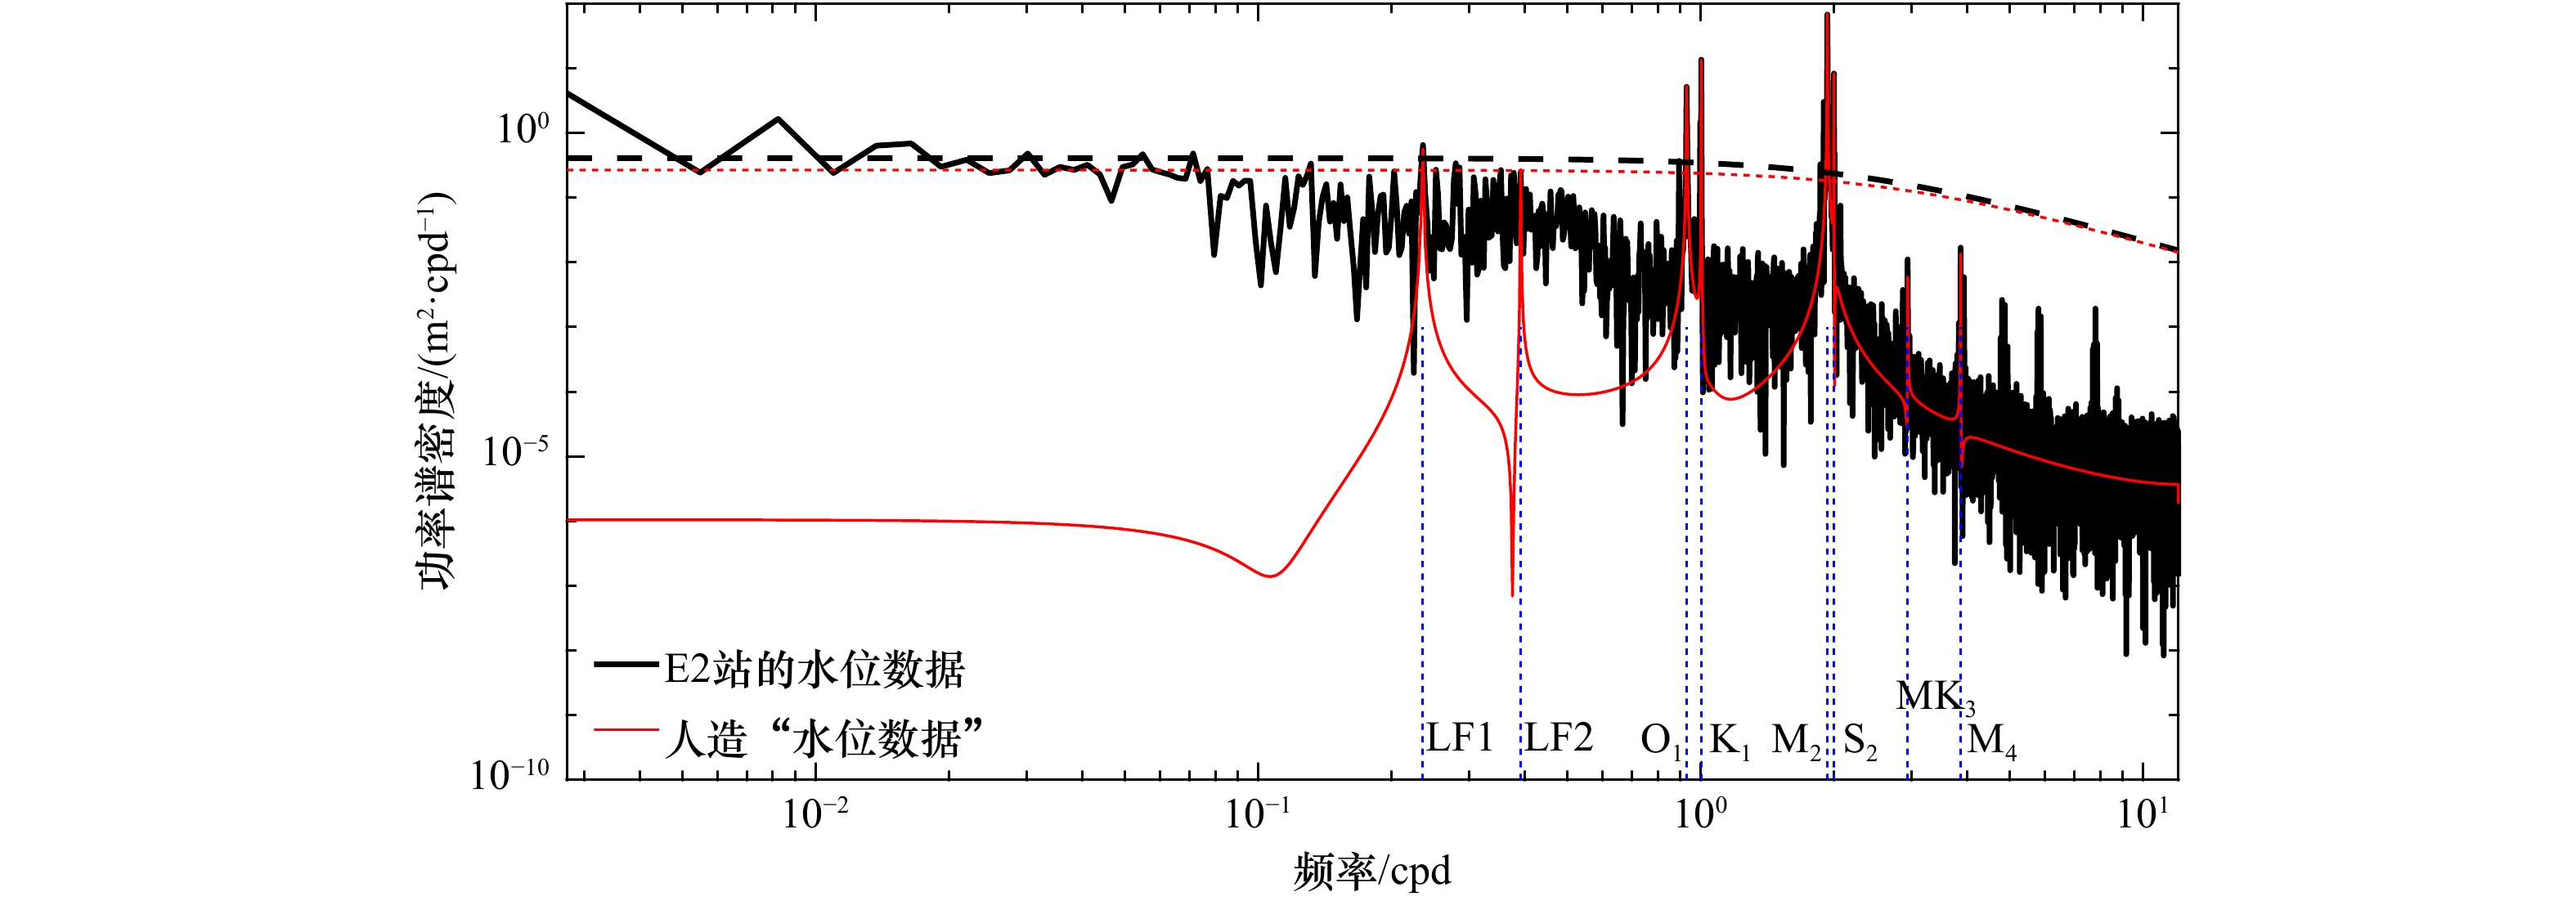
图 3 E2站水位数据和人造“水位数据”的功率谱密度
黑色和红色虚线表示相应的95%置信值
Fig. 3 The power spectral densities of the observed sea level at E2 Station and the artificial sea level
The black and red dashed lines designate the corresponding 95% significance level against red noise
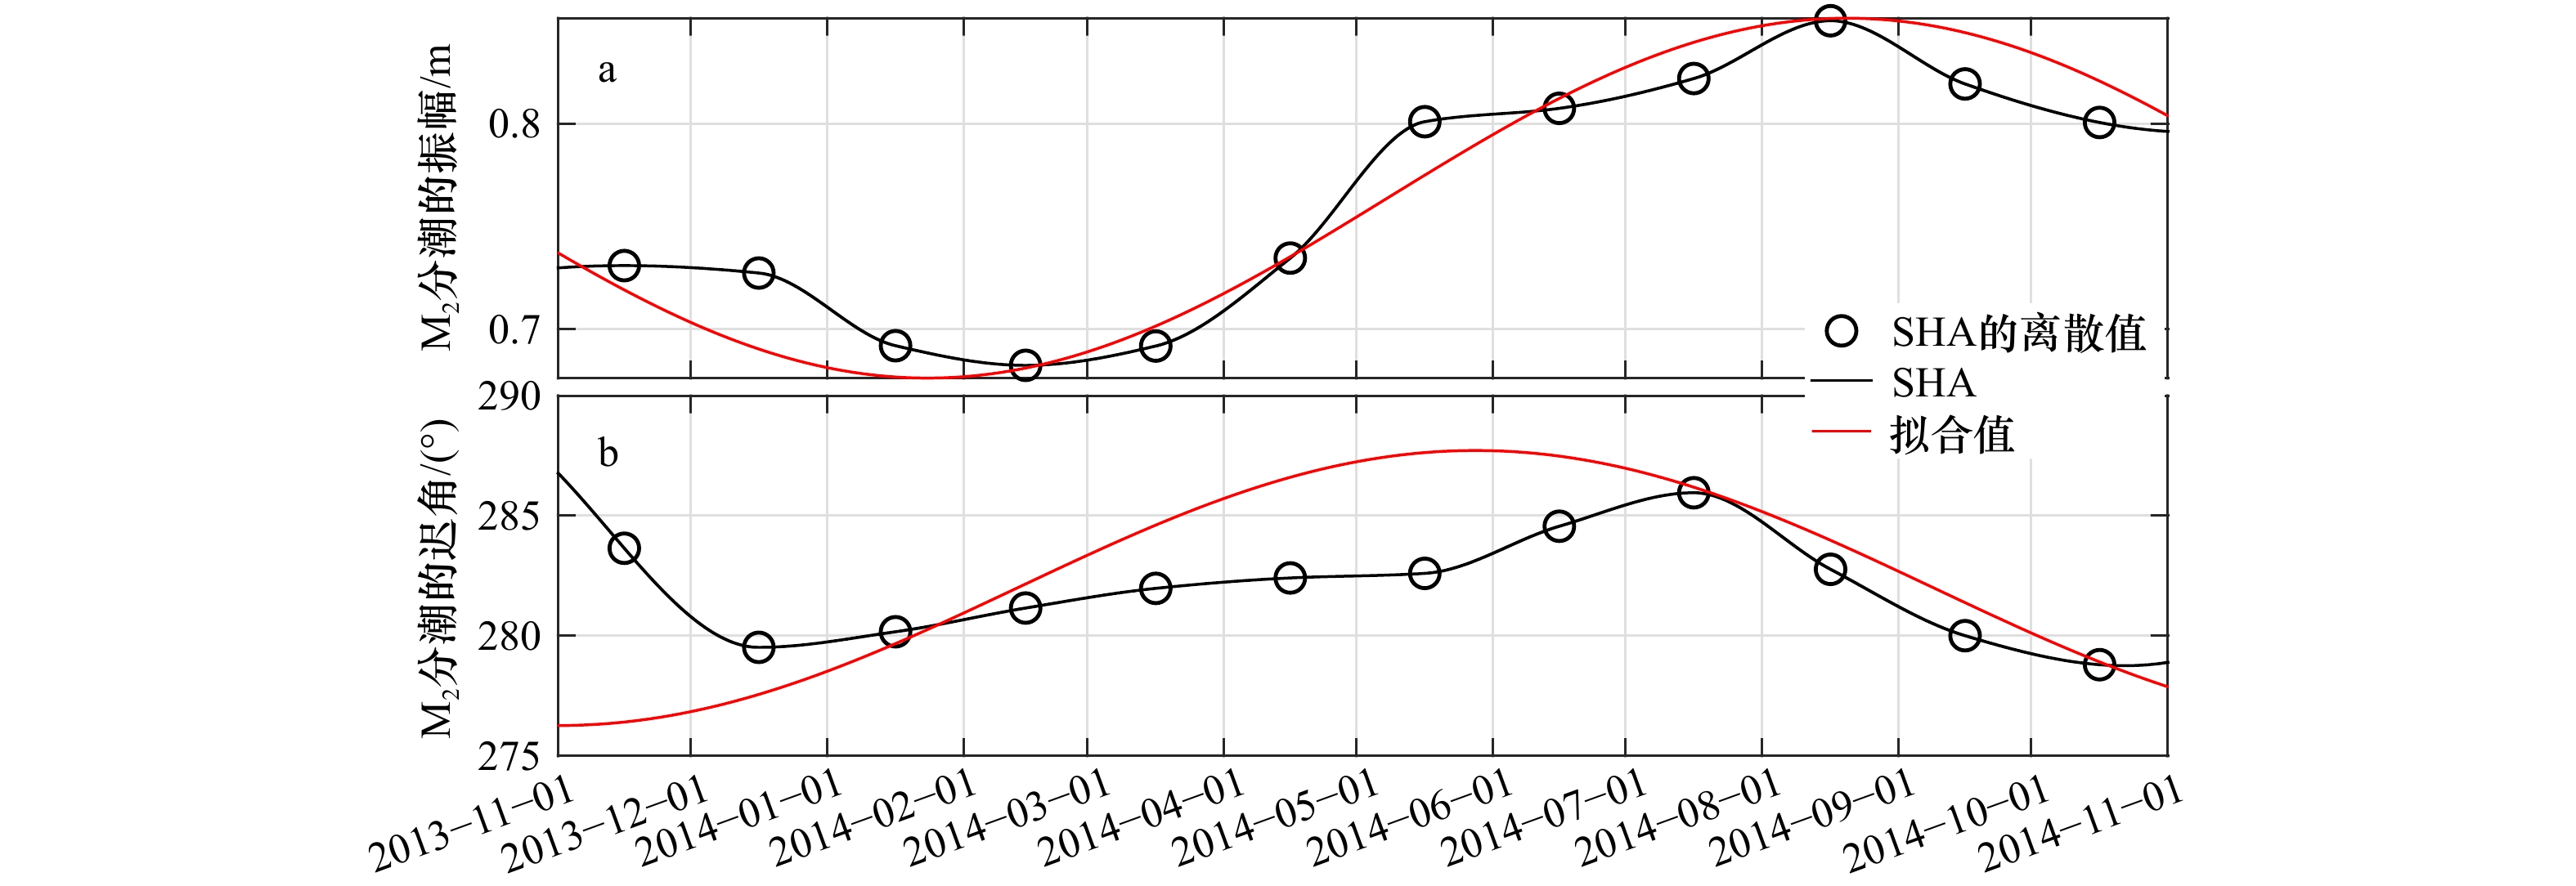
图 4 使用SHA分析E2站水位观测数据所获得M2分潮时变的振幅(a)和迟角(b)及其拟合值
Fig. 4 The temporally varying amplitude (a) and phase lag (b) of the M2 constituent obtained by analyzing the observed sea level at E2 Station using SHA and their fitting values
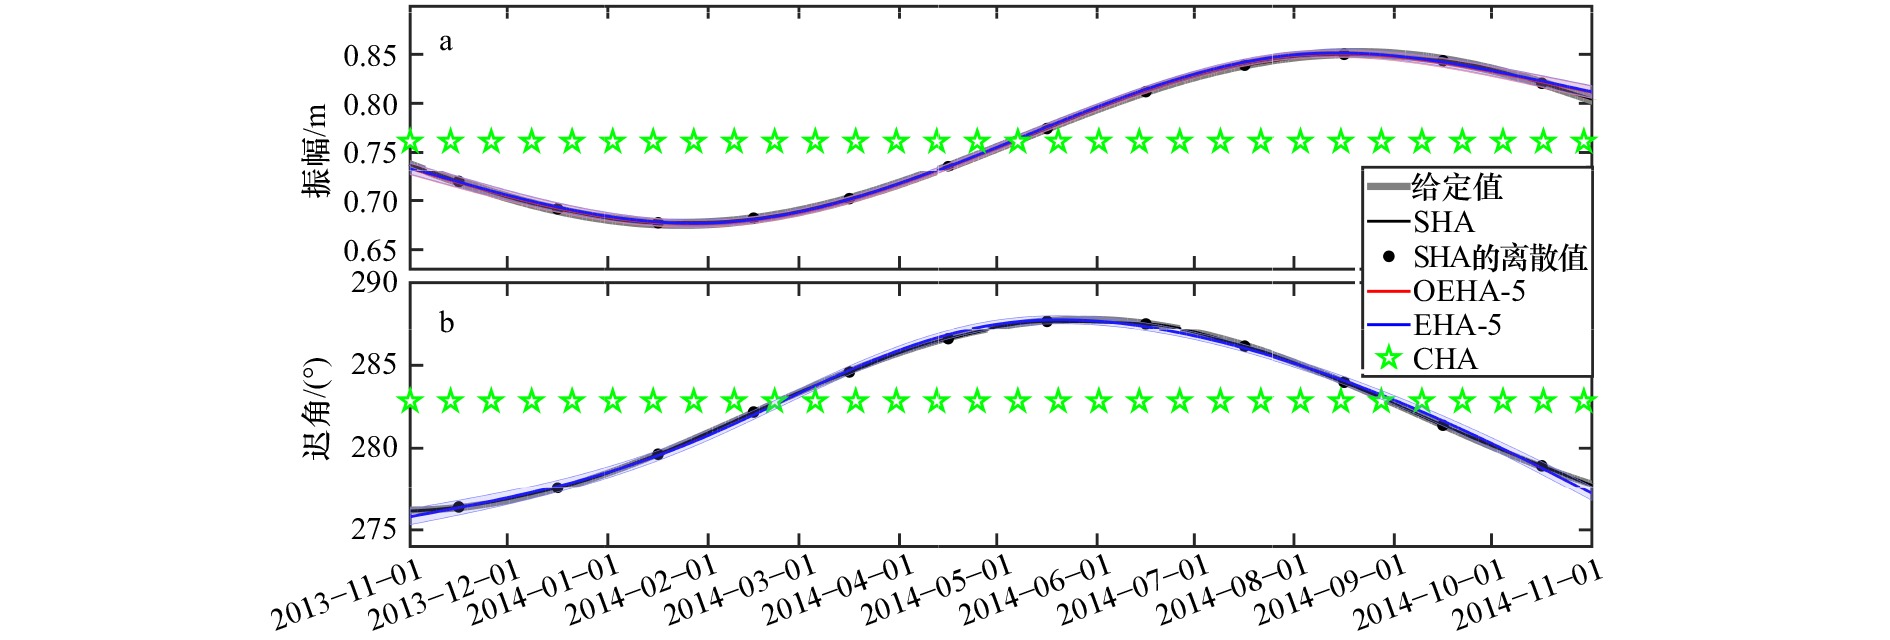
图 5 理想实验中给定的M2分潮振幅(a)和迟角(b),以及使用SHA、采用5个独立点的OEHA、采用5个独立点的EHA和CHA得到的结果
Fig. 5 The amplitude (a) and phase lag (b) of the M2 constituent prescribed in ideal experiments and the estimated values using SHA, OEHA with 5 independent points, EHA with 5 independent points, and CHA
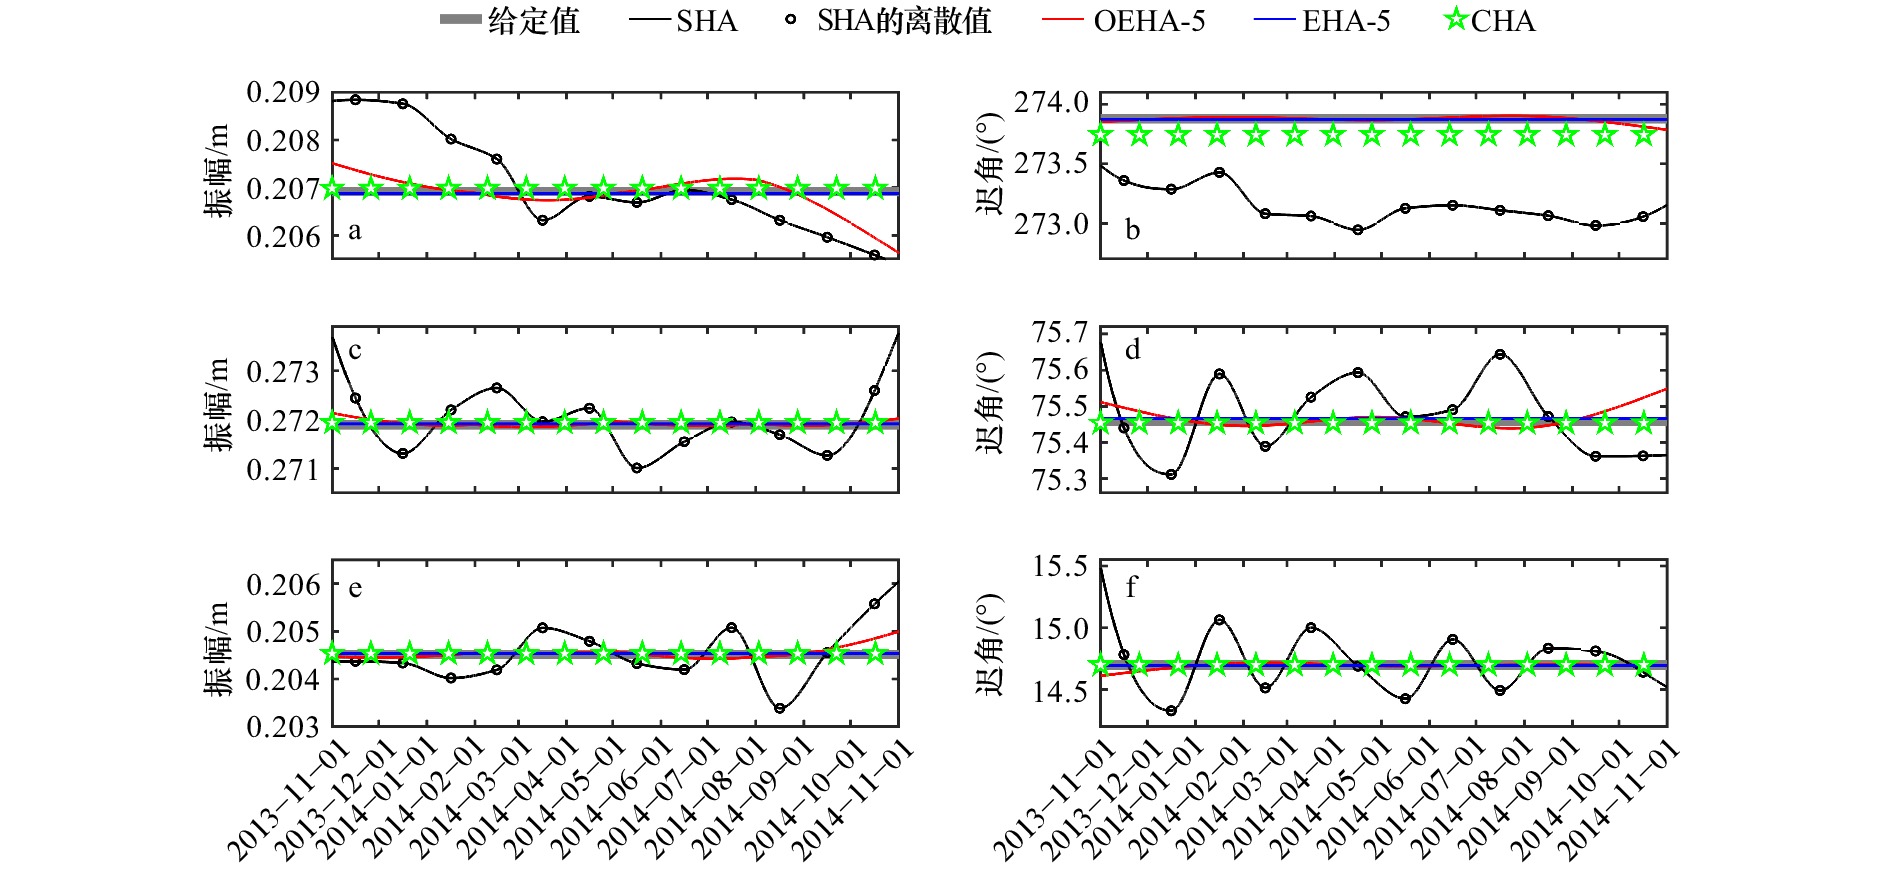
图 6 理想实验中给定的S2分潮(a,b)、K1分潮(c,d)和O1分潮(e,f)的振幅和迟角,以及使用SHA、采用5个独立点的OEHA、采用5个独立点的EHA和CHA得到的结果
Fig. 6 The amplitude and phase lag of the S2 (a, b), K1 (c, d) and O1 (e, f) constituent prescribed in ideal experiments and the estimated values using SHA, OEHA with 5 independent points, EHA with 5 independent points, and CHA

图 7 理想敏感实验中给定的M2分潮振幅(a)和迟角(b),以及使用SHA、采用5个独立点的OEHA、采用5个独立点的EHA和CHA得到的结果
b中的洋红色实线描述了理想敏感实验中人造“水位数据”的时间段
Fig. 7 The amplitude (a) and phase lag (b) of the M2 constituent prescribed in ideal sensitivity experiments and the estimated values using SHA, OEHA with 5 independent points, EHA with 5 independent points, and CHA
The magenta solid line in b describes the temporal locations of the artificial sea level observations in the ideal sensitivity experiment

图 8 理想敏感实验中给定的S2分潮(a, b)、K1分潮(c, d)和O1分潮(e, f)的振幅和迟角,以及使用SHA、采用5个独立点的OEHA、采用5个独立点的EHA和CHA得到的结果
每个子图中的洋红色实线描述了理想敏感实验中人造“水位数据”的时间段
Fig. 8 The amplitude and phase lag of the S2 (a, b), K1 (c, d) and O1 (e, f) constituent prescribed in ideal sensitivity experiments and the estimated values using SHA, OEHA with 5 independent points, EHA with 5 independent points, and CHA
The magenta solid lines in each panels describe the temporal locations of the artificial sea level observations in the ideal sensitivity experiment
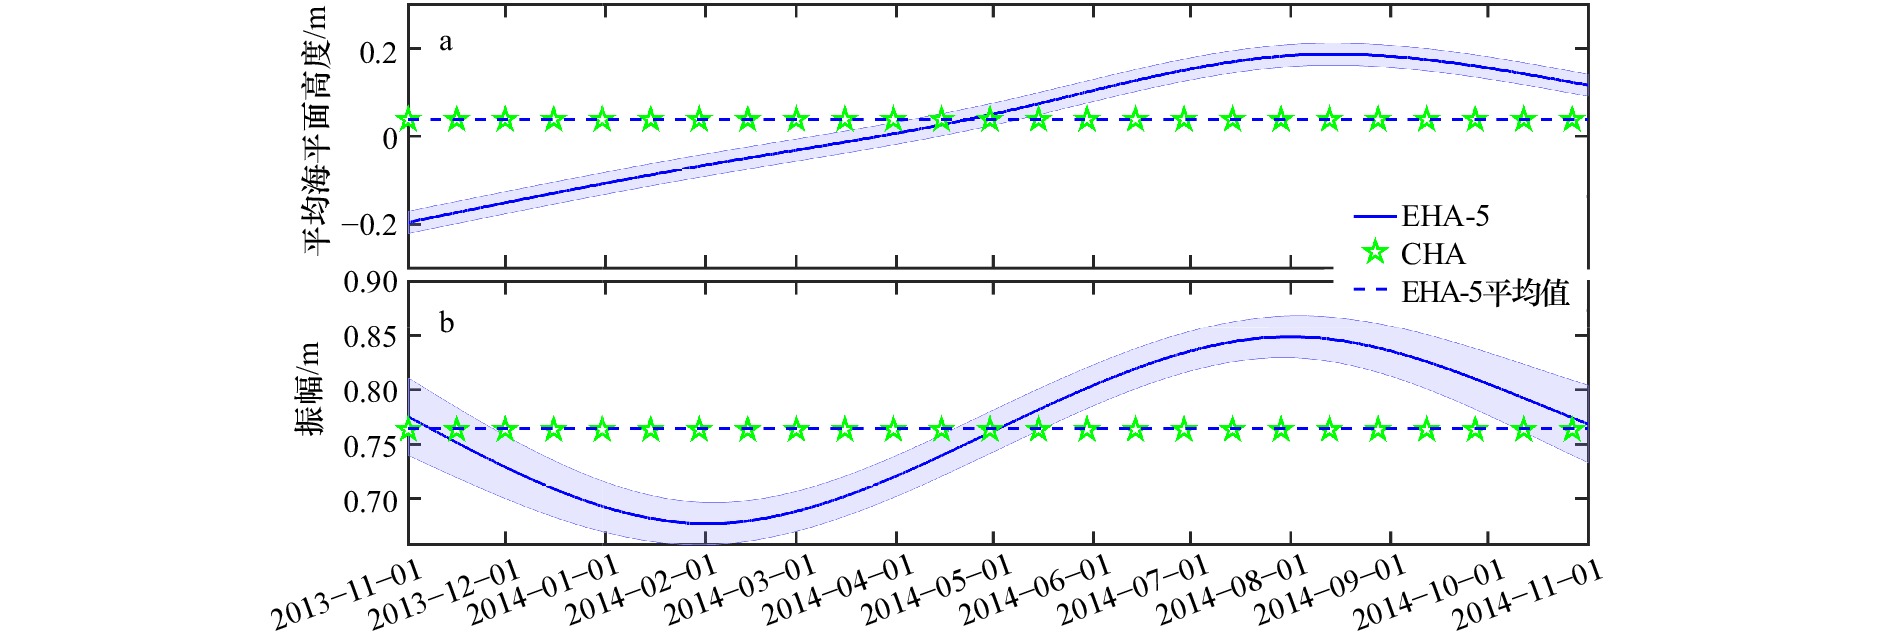
图 9 E2站基准实验的实验结果
蓝色实线展示了采用5个独立点的EHA得到的平均海平面高度(a)和M2分潮振幅(b)的时变值,蓝色虚线为采用5个独立点的EHA得到的平均海平面高度(a)和M2分潮振幅(b)的平均值,绿色星号表示常数形式的平均海平面高度(a)和M2分潮振幅(b),蓝色阴影表示相应的95%置信区间
Fig. 9 The results of benchmark experiment at E2 Station
The blue solid line shows the time-varying values of mean sea level (a) and M2 constituent amplitude (b) obtained by EHA at 5 independent points, the blue dotted line shows the average value of mean sea level (a) and M2 constituent amplitude (b) obtained by EHA at 5 independent points, and the green stars describe the constant mean sea level (a) and M2 constituent amplitude (b), the blue shadings indicate the corresponding 95% confidence intervals
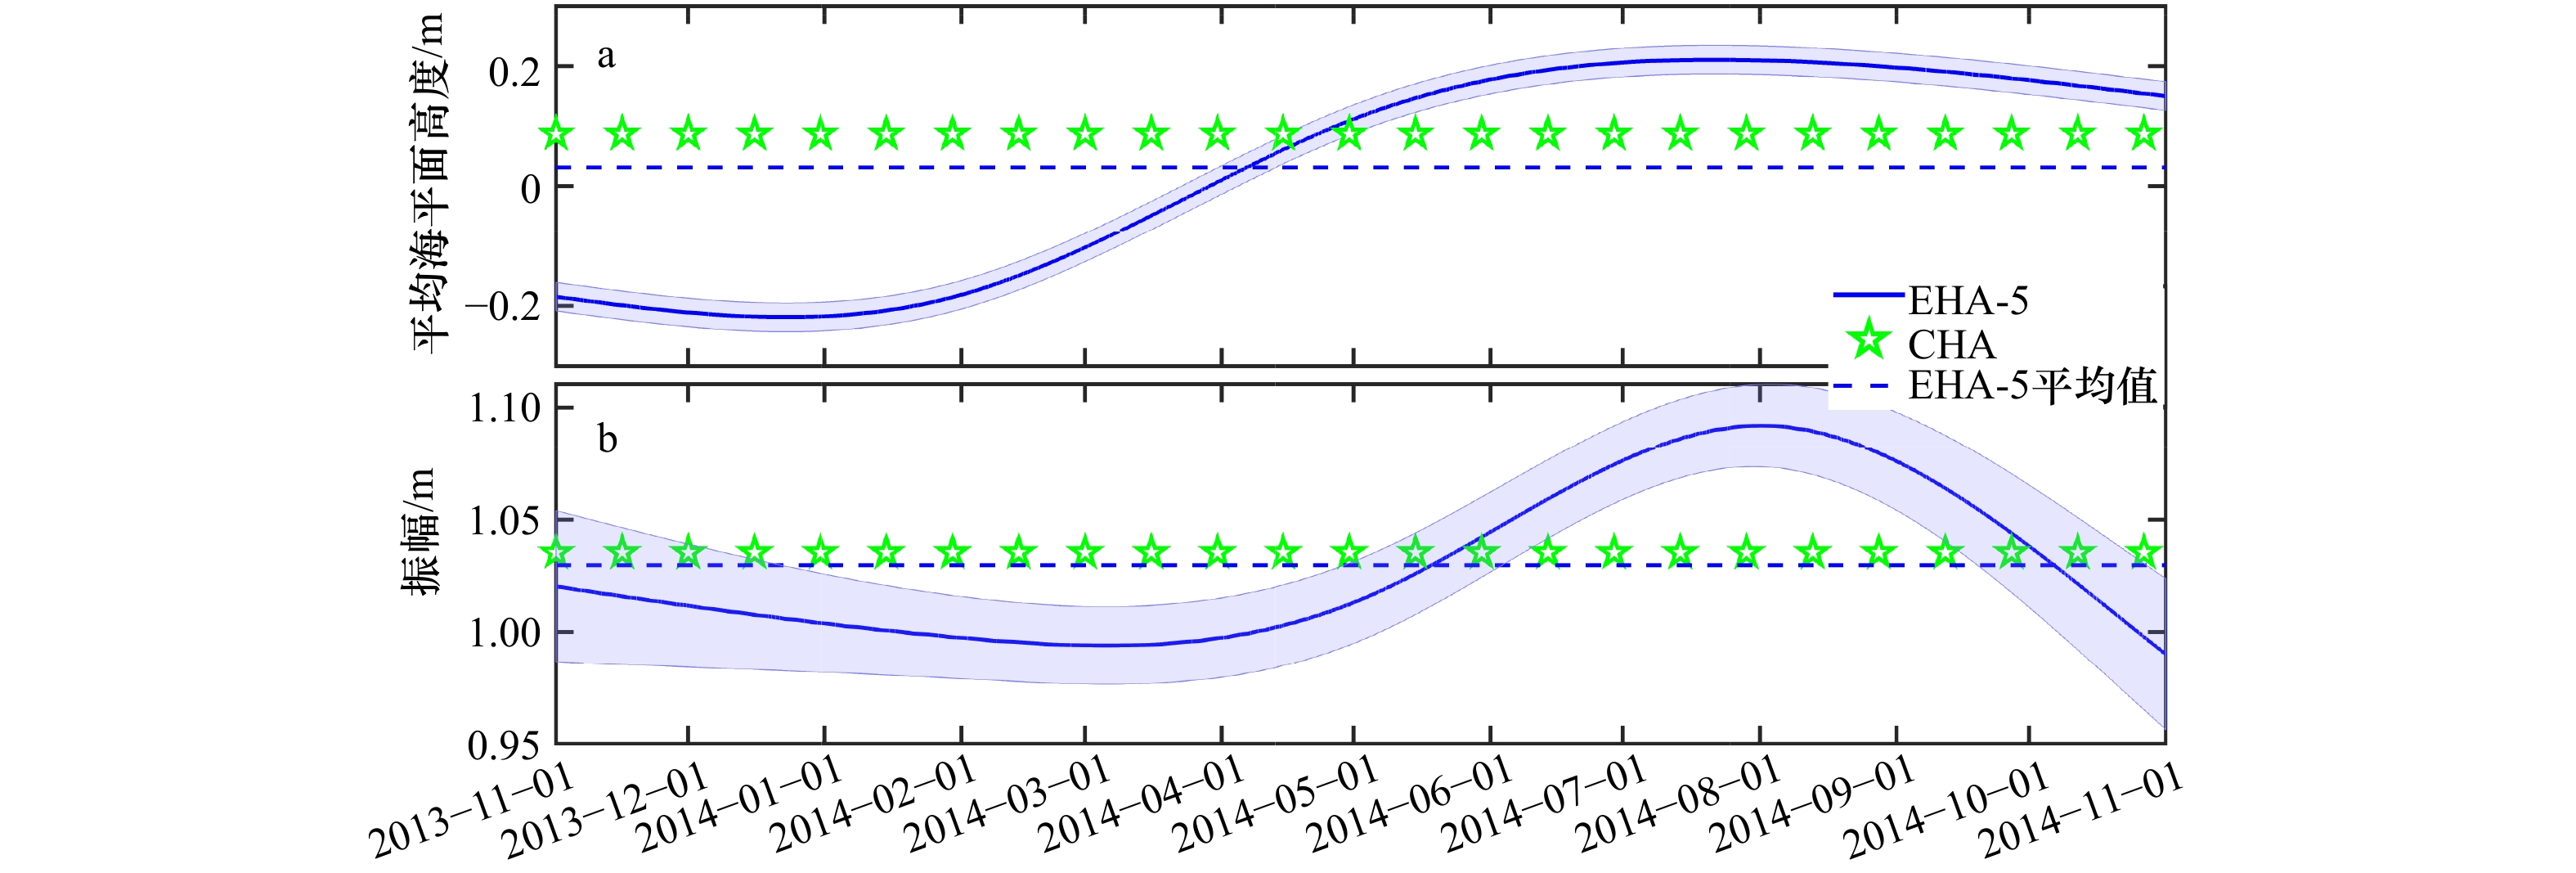
图 10 E1站基准实验的实验结果
蓝色实线展示了采用5个独立点的EHA得到的平均海平面高度(a)和M2分潮振幅(b)的时变值,蓝色虚线为采用5个独立点的EHA得到的平均海平面高度(a)和M2分潮振幅(b)的平均值,绿色星号表示常数形式的平均海平面高度(a)和M2分潮振幅(b),蓝色阴影表示相应的95%置信区间
Fig. 10 The results of benchmark experiment at E1 Station
The blue solid line shows the time-varying values of mean sea level (a) and M2 constituent amplitude (b) obtained by EHA at 5 independent points, the blue dotted line shows the average value of mean sea level (a) and M2 constituent amplitude (b) obtained by EHA at 5 independent points, and the green stars describe the constant mean sea level (a) and M2 constituent amplitude (b), the blue shadings indicate the corresponding 95% confidence intervals
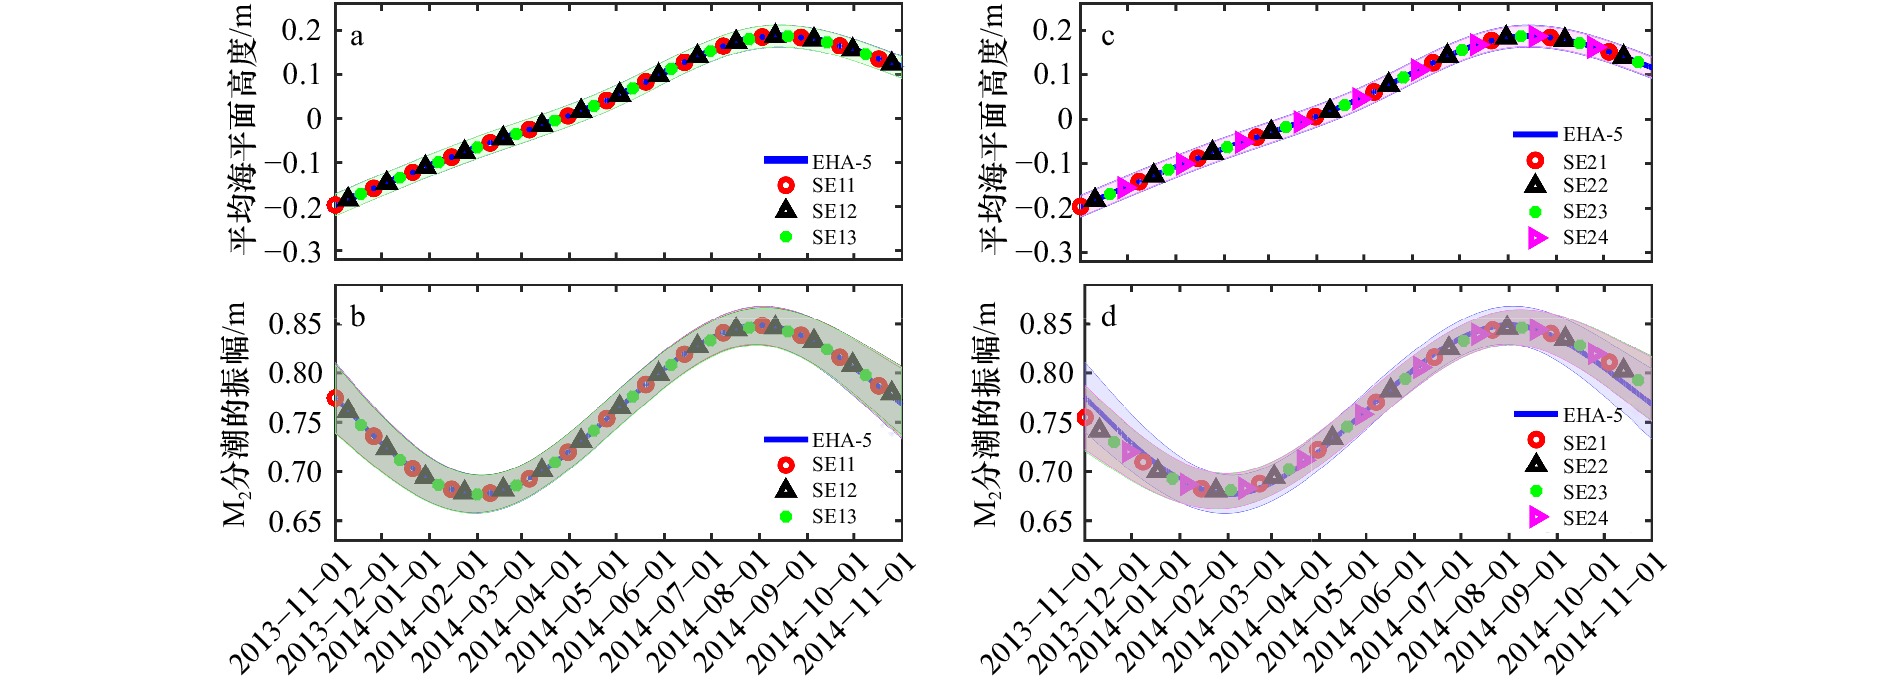
图 11 分潮选择的敏感性实验结果
蓝色实线表示采用5个独立点的EHA在基准实验中的结果。带颜色的阴影表示相应的95%置信区间
Fig. 11 The results on the sensitivity of tidal constituent selection
The blue solid line represents the results of EHA with 5 independent points in the benchmark experiment. The shadings with colors indicate the corresponding 95% confidence intervals

图 12 数据缺失和独立点数的敏感性实验结果
蓝色实线表示采用5个独立点的EHA在基准实验的结果。带颜色的阴影表示相应的95%置信区间
Fig. 12 The results on the sensitivity of missing data and independent points
The blue solid line indicates the results of EHA with 5 independent points in the benchmark experiment. The shadings with colors indicate the corresponding 95% confidence intervals

图 13 北太平洋季风指数(WNPMI)与E1站和E2站M2分潮振幅的相关性
黑点表示每天的WNPMI,黑圈表示WNPMI的月平均值,黑线为使用三次样条插值法对WNPMI的月平均值进行拟合的结果,蓝线为采用5个独立点的EHA得到的M2分潮振幅,黑色竖线和蓝色阴影表示相应的95%置信区间
Fig. 13 The correlation between WNPMI and M2 constituent amplitude of E1 and E2 stations
The black dot represents the daily WNPMI, the black circle represents the monthly average value of WNPMI, the black line is the result of fitting the monthly average value of WNPMI using cubic spline interpolation method, and the blue line is the M2 constituent amplitude obtained by EHA with 5 independent points, the black vertical bars and the blue shadings indicate the corresponding 95% confidence intervals
表 1 理想实验中的潮汐成分及其常数形式的振幅和迟角
Tab. 1 The prescribed constant amplitudes and phase lags of the constituents in ideal twin experiments
分潮 给定值 振幅/cm 迟角/(°) S2 20.69 273.88 K1 27.19 75.46 O1 20.45 14.70 MK3 0.83 314.20 M4 1.02 246.79 LF1 6.00 161.73 LF2 4.00 161.73  下载: 导出CSV
表 2 基准实验中CHA和EHA分析所得4个主要分潮的振幅(单位:cm)
Tab. 2 The amplitudes of four main tidal constituents obtained by CHA and EHA in the benchmark experiment (unit: cm)
站点 分潮 CHA EHA E1 M2 103.53 102.96 K1 29.04 29.14 S2 29.49 29.50 O1 22.89 22.90 E2 M2 76.33 76.46 K1 27.19 27.21 S2 20.69 20.62 O1 20.45 20.44 注:由于M2分潮的振幅是假定随时间变化的,因此使用EHA时列出其平均值。
下载: 导出CSV
表 3 实际实验中的详细实验设置
Tab. 3 The detailed experimental settings of the practical experiments
实验名 分析的分潮 具有时变特征的分潮 有无缺测 基准实验 M2, K1, S2, O1 M2 无 SE11 M2, K1, S2, O1 M2, K1 无 SE12 M2, K1, S2, O1 M2, K1, S2 无 SE13 M2, K1, S2, O1 M2, K1, S2, O1 无 SE21 M2, K1, S2, O1, N2, K2, P1, Q1 M2 无 SE22 M2, K1, S2, O1, N2, K2, P1, Q1 M2, K1 无 SE23 M2, K1, S2, O1, N2, K2, P1, Q1 M2, K1, S2 无 SE24 M2, K1, S2, O1, N2, K2, P1, Q1 M2, K1, S2, O1 无 SE31 M2, K1, S2, O1 M2 有(同E1) SE32−SE35 M2, K1, S2, O1 M2 有(大约占1/4)
下载: 导出CSV
-
[1] Devlin A T, Zaron E D, Jay D A, et al. Seasonality of tides in Southeast Asian waters[J]. Journal of Physical Oceanography, 2018, 48(5): 1169−1190. doi: 10.1175/JPO-D-17-0119.1 [2] Müller M, Cherniawsky J Y, Foreman M G G, et al. Seasonal variation of the M2 tide[J]. Ocean Dynamics, 2014, 64(2): 159−177. doi: 10.1007/s10236-013-0679-0 [3] Corkan R H. An annual perturbation in the range of tide[J]. Proceedings of the Royal Society of London. Series A, Containing Papers of a Mathematical and Physical Character, 1934, 144(853): 537−559. doi: 10.1098/rspa.1934.0067 [4] Huess V, Andersen O B. Seasonal variation in the main tidal constituent from altimetry[J]. Geophysical Research Letters, 2001, 28(4): 567−570. doi: 10.1029/2000GL011921 [5] Kang S K, Foreman M G G, Lie H J, et al. Two-layer tidal modeling of the Yellow and East China Seas with application to seasonal variability of the M2 tide[J]. Journal of Geophysical Research: Oceans, 2002, 107(C3): 6-1−6-18. [6] Georgas N. Large seasonal modulation of tides due to ice cover friction in a midlatitude Estuary[J]. Journal of Physical Oceanography, 2012, 42(3): 352−369. doi: 10.1175/JPO-D-11-063.1 [7] Mofjeld H O. Observed tides on the northeastern Bering Sea shelf[J]. Journal of Geophysical Research: Oceans, 1986, 91(C2): 2593−2606. doi: 10.1029/JC091iC02p02593 [8] Kagan B A, Sofina E V. Ice-induced seasonal variability of tidal constants in the Arctic Ocean[J]. Continental Shelf Research, 2010, 30(6): 643−647. doi: 10.1016/j.csr.2009.05.010 [9] Pawlowicz R, Beardsley B, Lentz S. Classical tidal harmonic analysis including error estimates in MATLAB using T_TIDE[J]. Computers & Geosciences, 2002, 28(8): 929−937. [10] Jin Guangzhen, Pan Haidong, Zhang Qilin, et al. Determination of harmonic parameters with temporal variations: an enhanced harmonic analysis algorithm and application to internal tidal currents in the South China Sea[J]. Journal of Atmospheric and Oceanic Technology, 2018, 35(7): 1375−1398. doi: 10.1175/JTECH-D-16-0239.1 [11] Foreman M G G, Walters R A, Henry R F, et al. A tidal model for eastern Juan de Fuca Strait and the southern Strait of Georgia[J]. Journal of Geophysical Research: Oceans, 1995, 100(C1): 721−740. doi: 10.1029/94JC02721 [12] Kang S K, Chung J Y, Lee S R, et al. Seasonal variability of the M2 tide in the seas adjacent to Korea[J]. Continental Shelf Research, 1995, 15(9): 1087−1113. doi: 10.1016/0278-4343(94)00066-V [13] Tazkia A R, Krien Y, Durand F, et al. Seasonal modulation of M2 tide in the northern Bay of Bengal[J]. Continental Shelf Research, 2017, 137: 154−162. doi: 10.1016/j.csr.2016.12.008 [14] Pan Haidong, Lü Xianqing, Wang Yingying, et al. Exploration of tidal-fluvial interaction in the Columbia River Estuary using S_TIDE[J]. Journal of Geophysical Research: Oceans, 2018, 123(9): 6598−6619. doi: 10.1029/2018JC014146 [15] Woodworth P L. A survey of recent changes in the main components of the ocean tide[J]. Continental Shelf Research, 2010, 30(15): 1680−1691. doi: 10.1016/j.csr.2010.07.002 [16] Wang Daosheng, Pan Haidong, Jin Guangzhen, et al. Seasonal variation of the principal tidal constituents in the Bohai Sea[J]. Ocean Science, 2020, 16(1): 1−14. doi: 10.5194/os-16-1-2020 [17] Kurapov A L, Erofeeva S Y, Myers E. Coastal sea level variability in the US West Coast Ocean Forecast System (WCOFS)[J]. Ocean Dynamics, 2017, 67(1): 23−36. doi: 10.1007/s10236-016-1013-4 [18] Lü Xianqiing, Wang Daosheng, Yan Bing, et al. Coastal sea level variability in the Bohai Bay: influence of atmospheric forcing and prediction[J]. Journal of Oceanology and Limnology, 2019, 37(2): 486−497. doi: 10.1007/s00343-019-7383-y [19] Xu Zhenhua, Yin Baoshu, Hou Yijun, et al. Variability of internal tides and near-inertial waves on the continental slope of the northwestern South China Sea[J]. Journal of Geophysical Research: Oceans, 2013, 118(1): 197−211. doi: 10.1029/2012JC008212 [20] Holly F M, Yang J C, Schwarz P, et al. Numerical simulation of unsteady water and sediment movement in multiply connected networks of mobile-bed channels[R]. Iowa institute of Hydraulic Research: The University of Iowa, 1990. [21] Cao Anzhou, Wang Daosheng, Lü Xianqing. Harmonic analysis in the simulation of multiple constituents: determination of the optimum length of time series[J]. Journal of Atmospheric and Oceanic Technology, 2015, 32(5): 1112−1118. doi: 10.1175/JTECH-D-14-00148.1 [22] Matte P, Jay D A, Zaron E D. Adaptation of classical tidal harmonic analysis to nonstationary tides, with application to river tides[J]. Journal of Atmospheric and Oceanic Technology, 2013, 30(3): 569−589. doi: 10.1175/JTECH-D-12-00016.1 [23] Chen Xianyao, Zhang Xuebin, Church J A, et al. The increasing rate of global mean sea-level rise during 1993–2014[J]. Nature Climate Change, 2017, 7(7): 492−495. doi: 10.1038/nclimate3325 [24] Quartly G D, Legeais J F, Ablain M, et al. A new phase in the production of quality-controlled sea level data[J]. Earth System Science Data, 2017, 9(2): 557−572. doi: 10.5194/essd-9-557-2017 [25] Wang Qiang, Guo Xinyu, Takeoka H. Seasonal variations of the Yellow River plume in the Bohai Sea: a model study[J]. Journal of Geophysical Research: Oceans, 2008, 113(C8): C08046. [26] Jeon C, Park J H, Varlamov S M, et al. Seasonal variation of semidiurnal internal tides in the East/Japan Sea[J]. Journal of Geophysical Research: Oceans, 2014, 119(5): 2843−2859. doi: 10.1002/2014JC009864 [27] Bi Naishuang, Yang Zuosheng, Wang Houjie, et al. Seasonal variation of suspended-sediment transport through the southern Bohai Strait[J]. Estuarine, Coastal and Shelf Science, 2011, 93(3): 239−247. doi: 10.1016/j.ecss.2011.03.007 [28] Wang Houjie, Wang Aimei, Bi Naishuang, et al. Seasonal distribution of suspended sediment in the Bohai Sea, China[J]. Continental Shelf Research, 2014, 90: 17−32. doi: 10.1016/j.csr.2014.03.006 [29] Shi Wei, Wang Menghua. Satellite views of the Bohai Sea, Yellow Sea, and East China Sea[J]. Progress in Oceanography, 2012, 104: 30−45. doi: 10.1016/j.pocean.2012.05.001 [30] Wang Bin, Fan Zhen. Choice of South Asian summer monsoon indices[J]. Bulletin of the American Meteorological Society, 1999, 80(4): 629−638. doi: 10.1175/1520-0477(1999)080<0629:COSASM>2.0.CO;2 [31] 刘锡清. 中国海洋环境地质学[M]. 北京: 海洋出版社, 2006.Liu Xiqing. Marine Environmental Geology of China[M]. Beijing: China Ocean Press, 2006. [32] Wang Houjie, Yang Zuosheng, Li Yunhai, et al. Dispersal pattern of suspended sediment in the shear frontal zone off the Huanghe (Yellow River) mouth[J]. Continental Shelf Research, 2007, 27(6): 854−871. doi: 10.1016/j.csr.2006.12.002 [33] 中华人民共和国水利部. 中国水利统计年鉴2014[M]. 北京: 中国水利水电出版社, 2014.Ministry of Water Resources of the People’s Republic of China. Bulletin of Chinese Rivers and Sediments 2014[M]. Beijing: China Water Power Press, 2014. [34] Li Fuxing, Zhang Shiyan, Chen Dong, et al. Inter-decadal variability of the East Asian summer monsoon and its impact on hydrologic variables in the Haihe River Basin, China[J]. Journal of Resources and Ecology, 2017, 8(2): 174−184. doi: 10.5814/j.issn.1674-764X.2017.02.008 [35] Yanagi T, Sachoemar S I, Takao T, et al. Seasonal variation of stratification in the Gulf of Thailand[J]. Journal of Oceanography, 2001, 57(4): 461−470. doi: 10.1023/A:1021237721368 [36] Van Haren H. Properties of vertical current shear across stratification in the North Sea[J]. Journal of Marine Research, 2000, 58(3): 465−491. doi: 10.1357/002224000321511115 [37] Huang Daji, Su Jilan, Backhaus J O. Modelling the seasonal thermal stratification and baroclinic circulation in the Bohai Sea[J]. Continental Shelf Research, 1999, 19(11): 1485−1505. doi: 10.1016/S0278-4343(99)00026-6 [38] Pohlmann T. Calculating the annual cycle of the vertical eddy viscosity in the North Sea with a three-dimensional baroclinic shelf sea circulation model[J]. Continental Shelf Research, 1996, 16(2): 147−161. doi: 10.1016/0278-4343(94)E0037-M [39] Maas L R M, Van Haren J J M. Observations on the vertical structure of tidal and inertial currents in the central North Sea[J]. Journal of Marine Research, 1987, 45(2): 293−318. doi: 10.1357/002224087788401106 [40] Howarth M J. The effect of stratification on tidal current profiles[J]. Continental Shelf Research, 1998, 18(11): 1235−1254. doi: 10.1016/S0278-4343(98)00042-9 [41] Müller M. The influence of changing stratification conditions on barotropic tidal transport and its implications for seasonal and secular changes of tides[J]. Continental Shelf Research, 2012, 47: 107−118. doi: 10.1016/j.csr.2012.07.003 [42] Kang S K, Lee S R, Lie H J. Fine grid tidal modeling of the Yellow and East China Seas[J]. Continental Shelf Research, 1998, 18(7): 739−772. doi: 10.1016/S0278-4343(98)00014-4 -

计量
- 文章访问数: 590
- HTML全文浏览量: 178
- PDF下载量: 42
- 被引次数: 0
