

Spatial assessment of cumulative impact on China’s marine ecosystems
-
摘要: 海洋生态系统累积影响评估是科学认知该系统对外界扰动响应与反馈规律的生态学方法。为了探索和揭示其中的内在规律,本文以我国部分近陆海域为研究范围,选取海洋渔业、海洋航运、陆源及近海、气候变化4种类型下的16个生态压力因子,通过空间量化和标准化,在1 km×1 km空间格栅尺度下,针对研究范围内9种海洋生境类型,进行了累积暴露度和累积影响度评估。结果显示:研究海域累积暴露度总体呈现近岸高于远海,并向外海一侧逐步递减;陆源污染、渔业捕捞对近岸海域生态系统影响度较大,总体来看气候变化影响度最大;我国近海分别有22.8%和7.6%的海域受影响程度较高和极高,其中长三角海域受人类活动影响度最高。Abstract: The cumulative human impact assessment of marine ecosystems is an ecological method to scientifically recognize the response and feedback laws of the system to external disturbances. In order to explore and reveal the inherent mechanisms, the region of coastal seas of China as the research scope in this article, selecting 16 ecological factors in four aspects, marine fishery, marine shipping, land-based and offshore pressures, and climate change. And by spatial quantization and standardization, the cumulative exposure and impact assessment of the 9 marine habitat types in the study area are carried out under the 1 km×1 km spatial grid scale. The results show that the cumulative exposure in the study area is generally higher in the coastal seas than in the pelagic, and gradually decreases to the far ocean; the coastal seas ecosystem is mainly affected by land-based pollution and fishing, and overall climate change contributes the most; 22.8% and 7.6% of China’s coastal seas are respectively highly and extremely highly affected, among which the Changjiang River Delta is the most affected by human activities.
-
Key words:
- China coastal seas /
- human activities /
- marine ecosystems /
- spatial cumulative effects
-
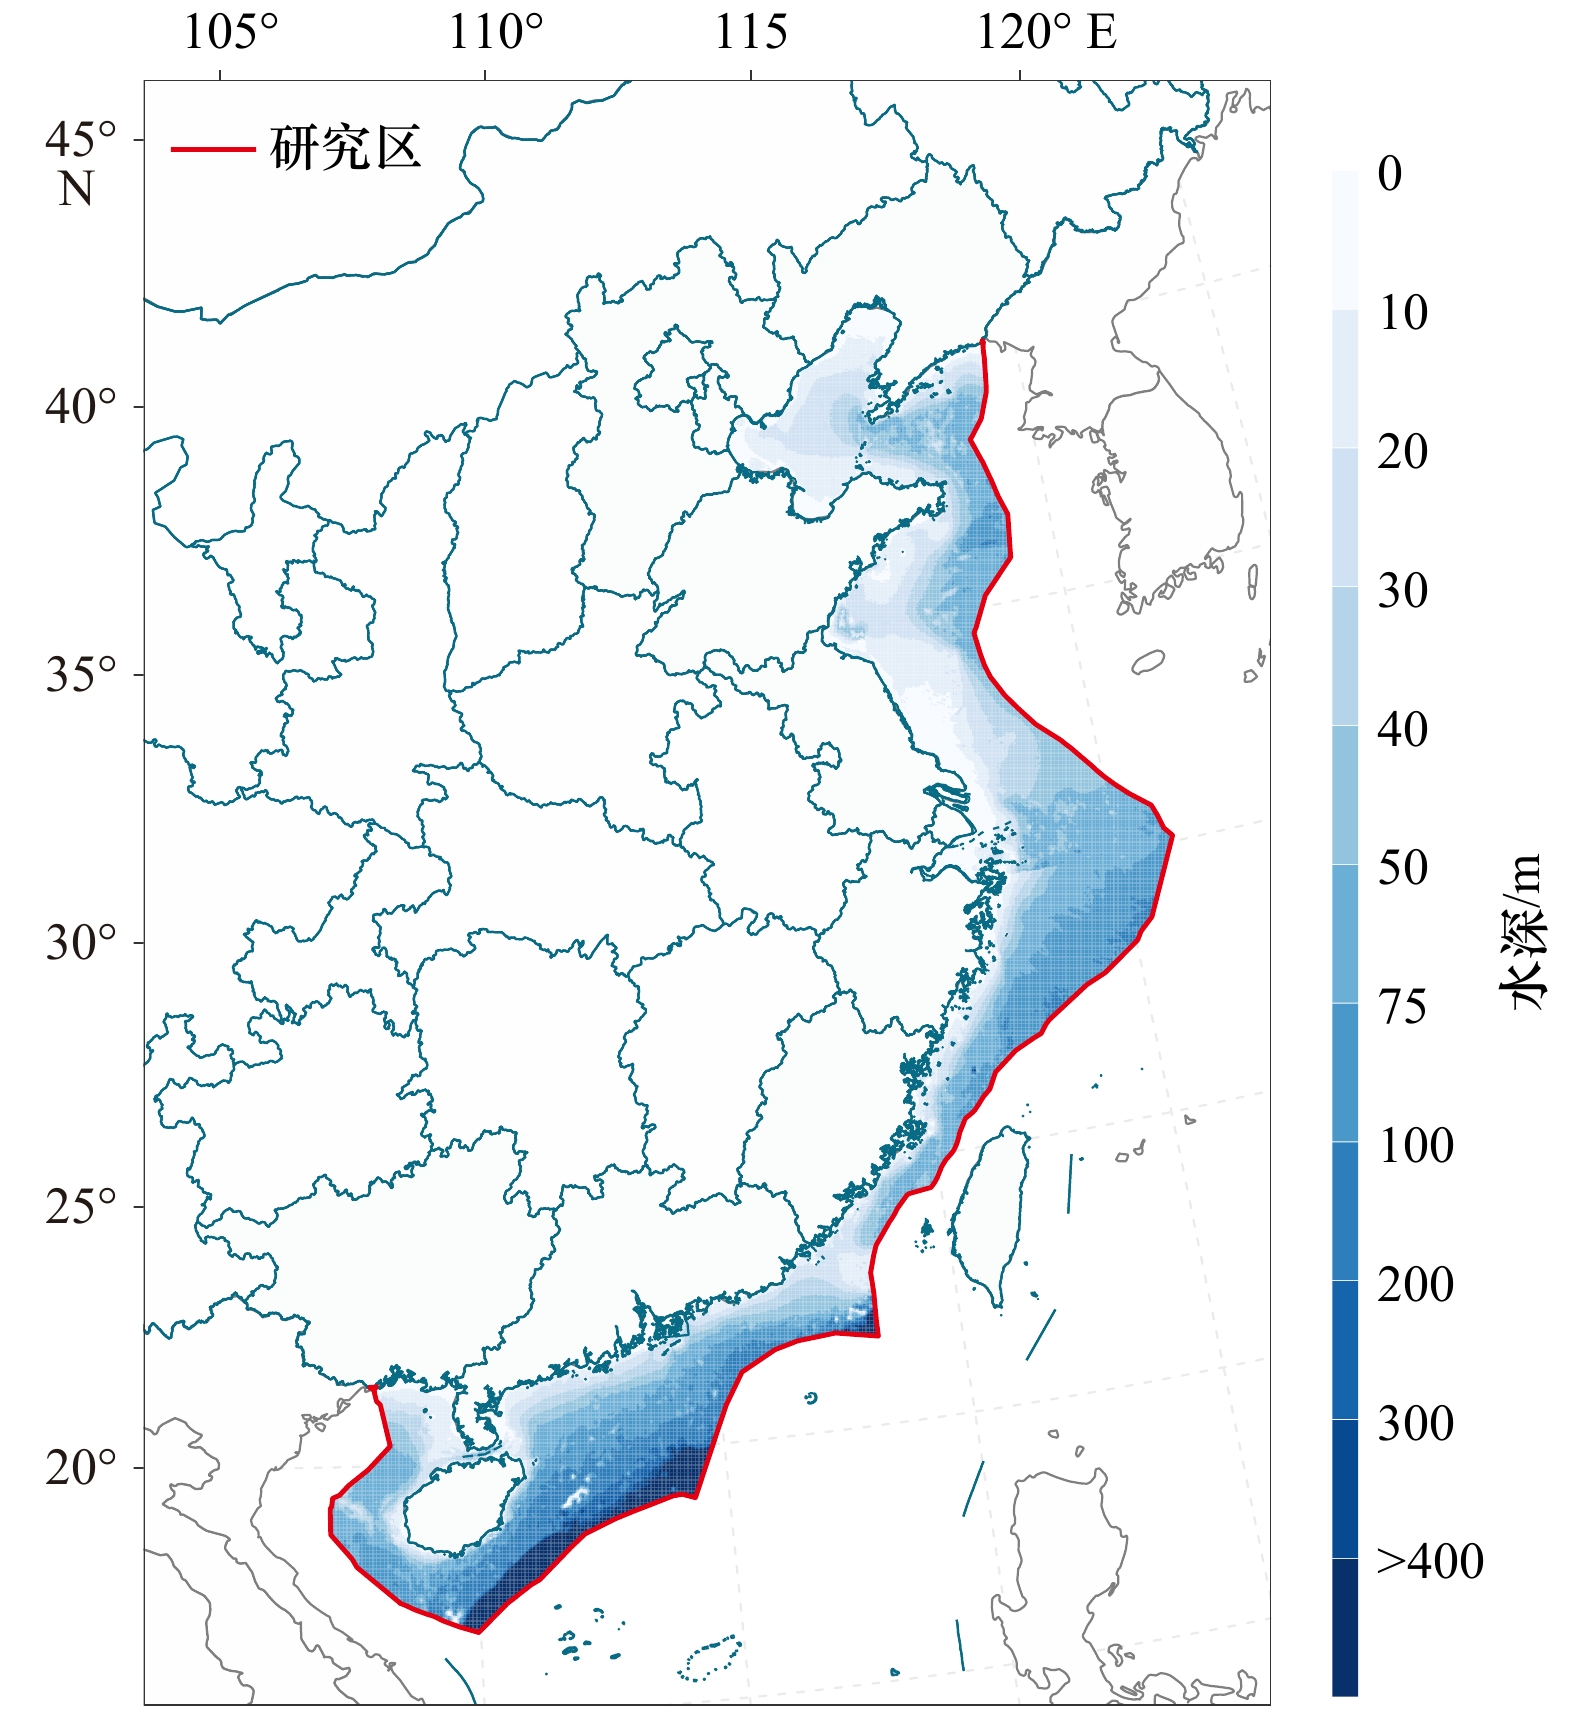
图 1 中国部分近陆海域人类活动累积影响研究区域
Fig. 1 Study on the cumulative impact of human activities in some coastal seas of China
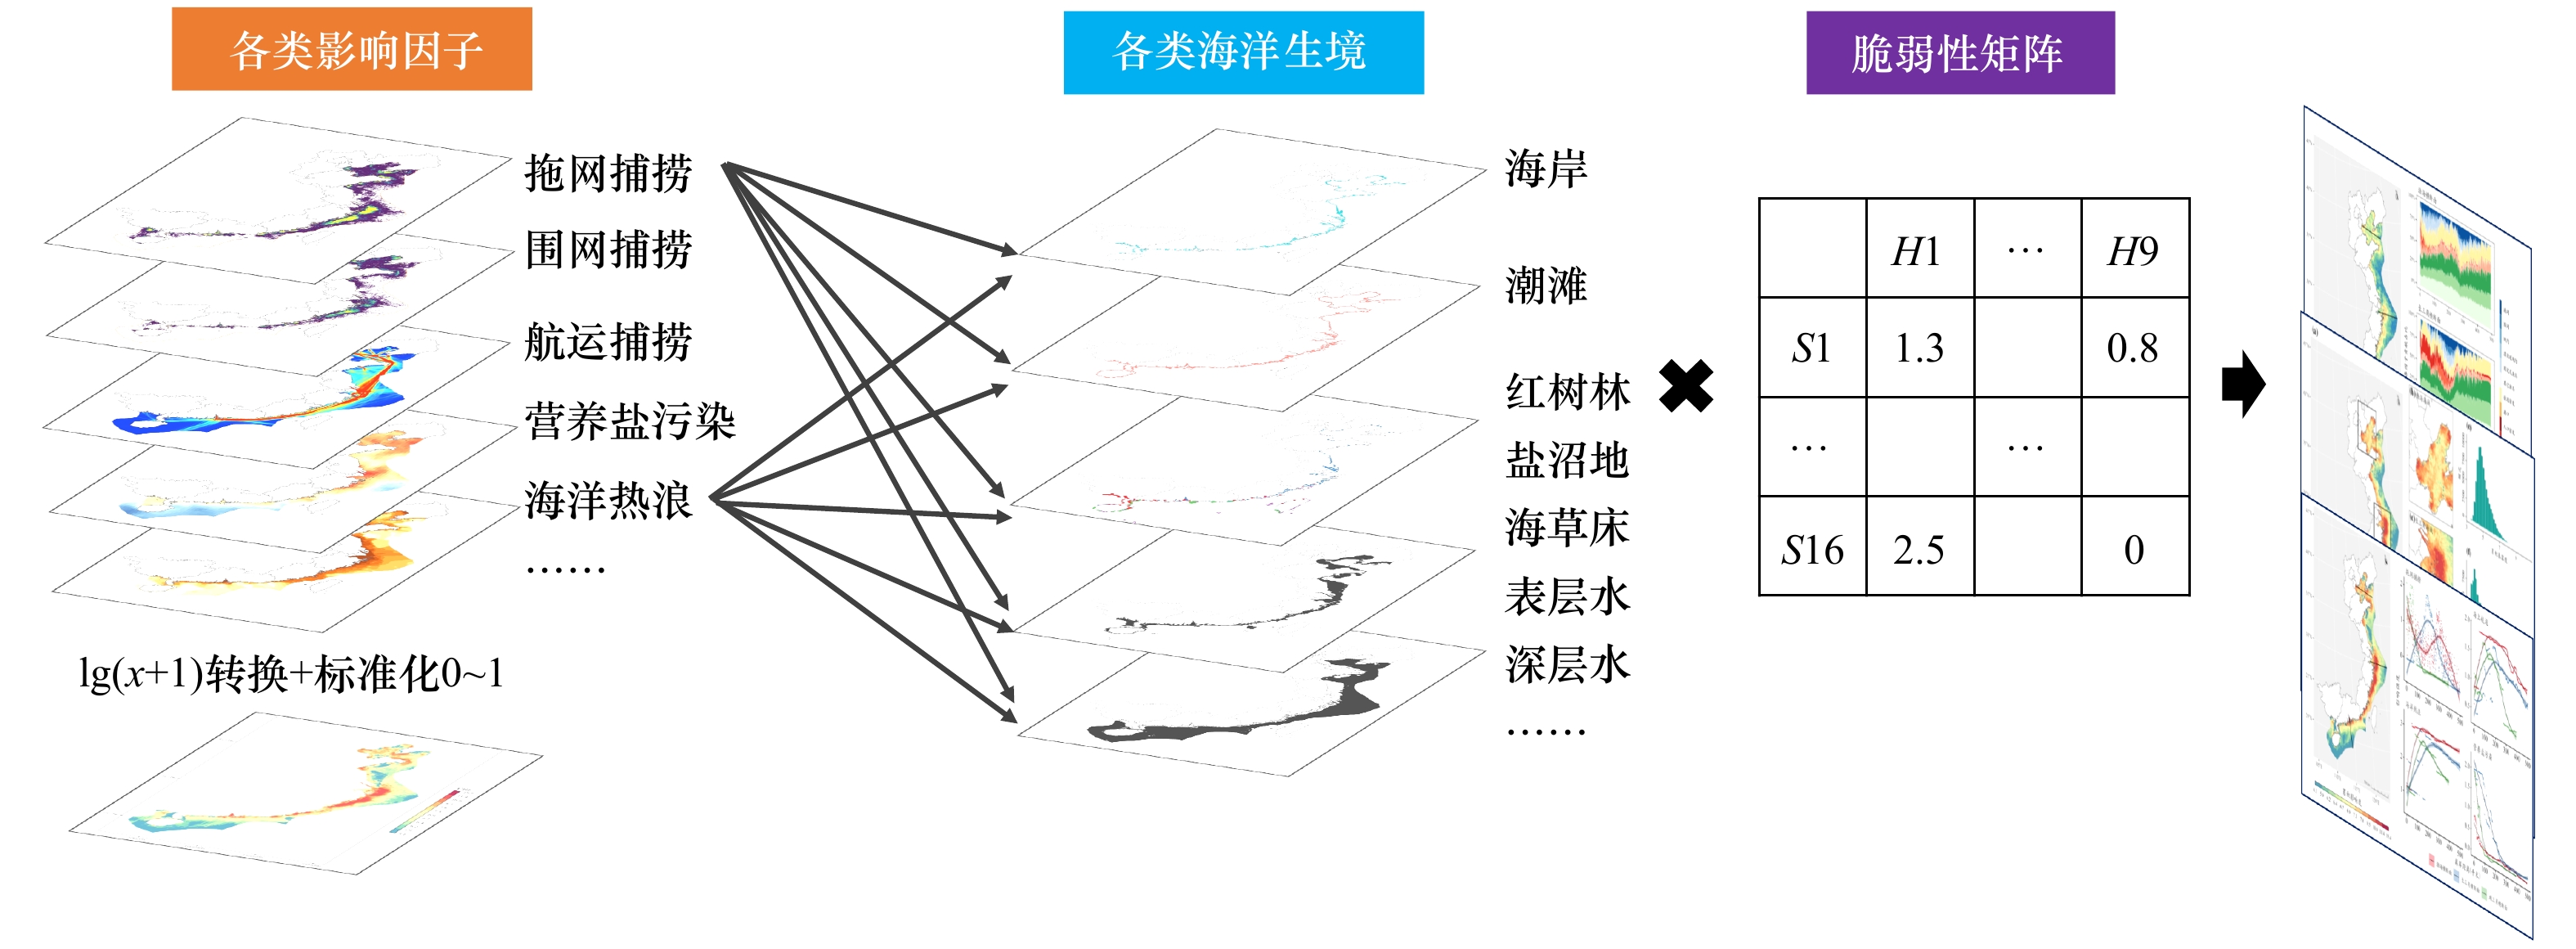
图 2 累积影响空间化评估示意图
Fig. 2 The schematic diagram of spatial assessment of cumulative impact
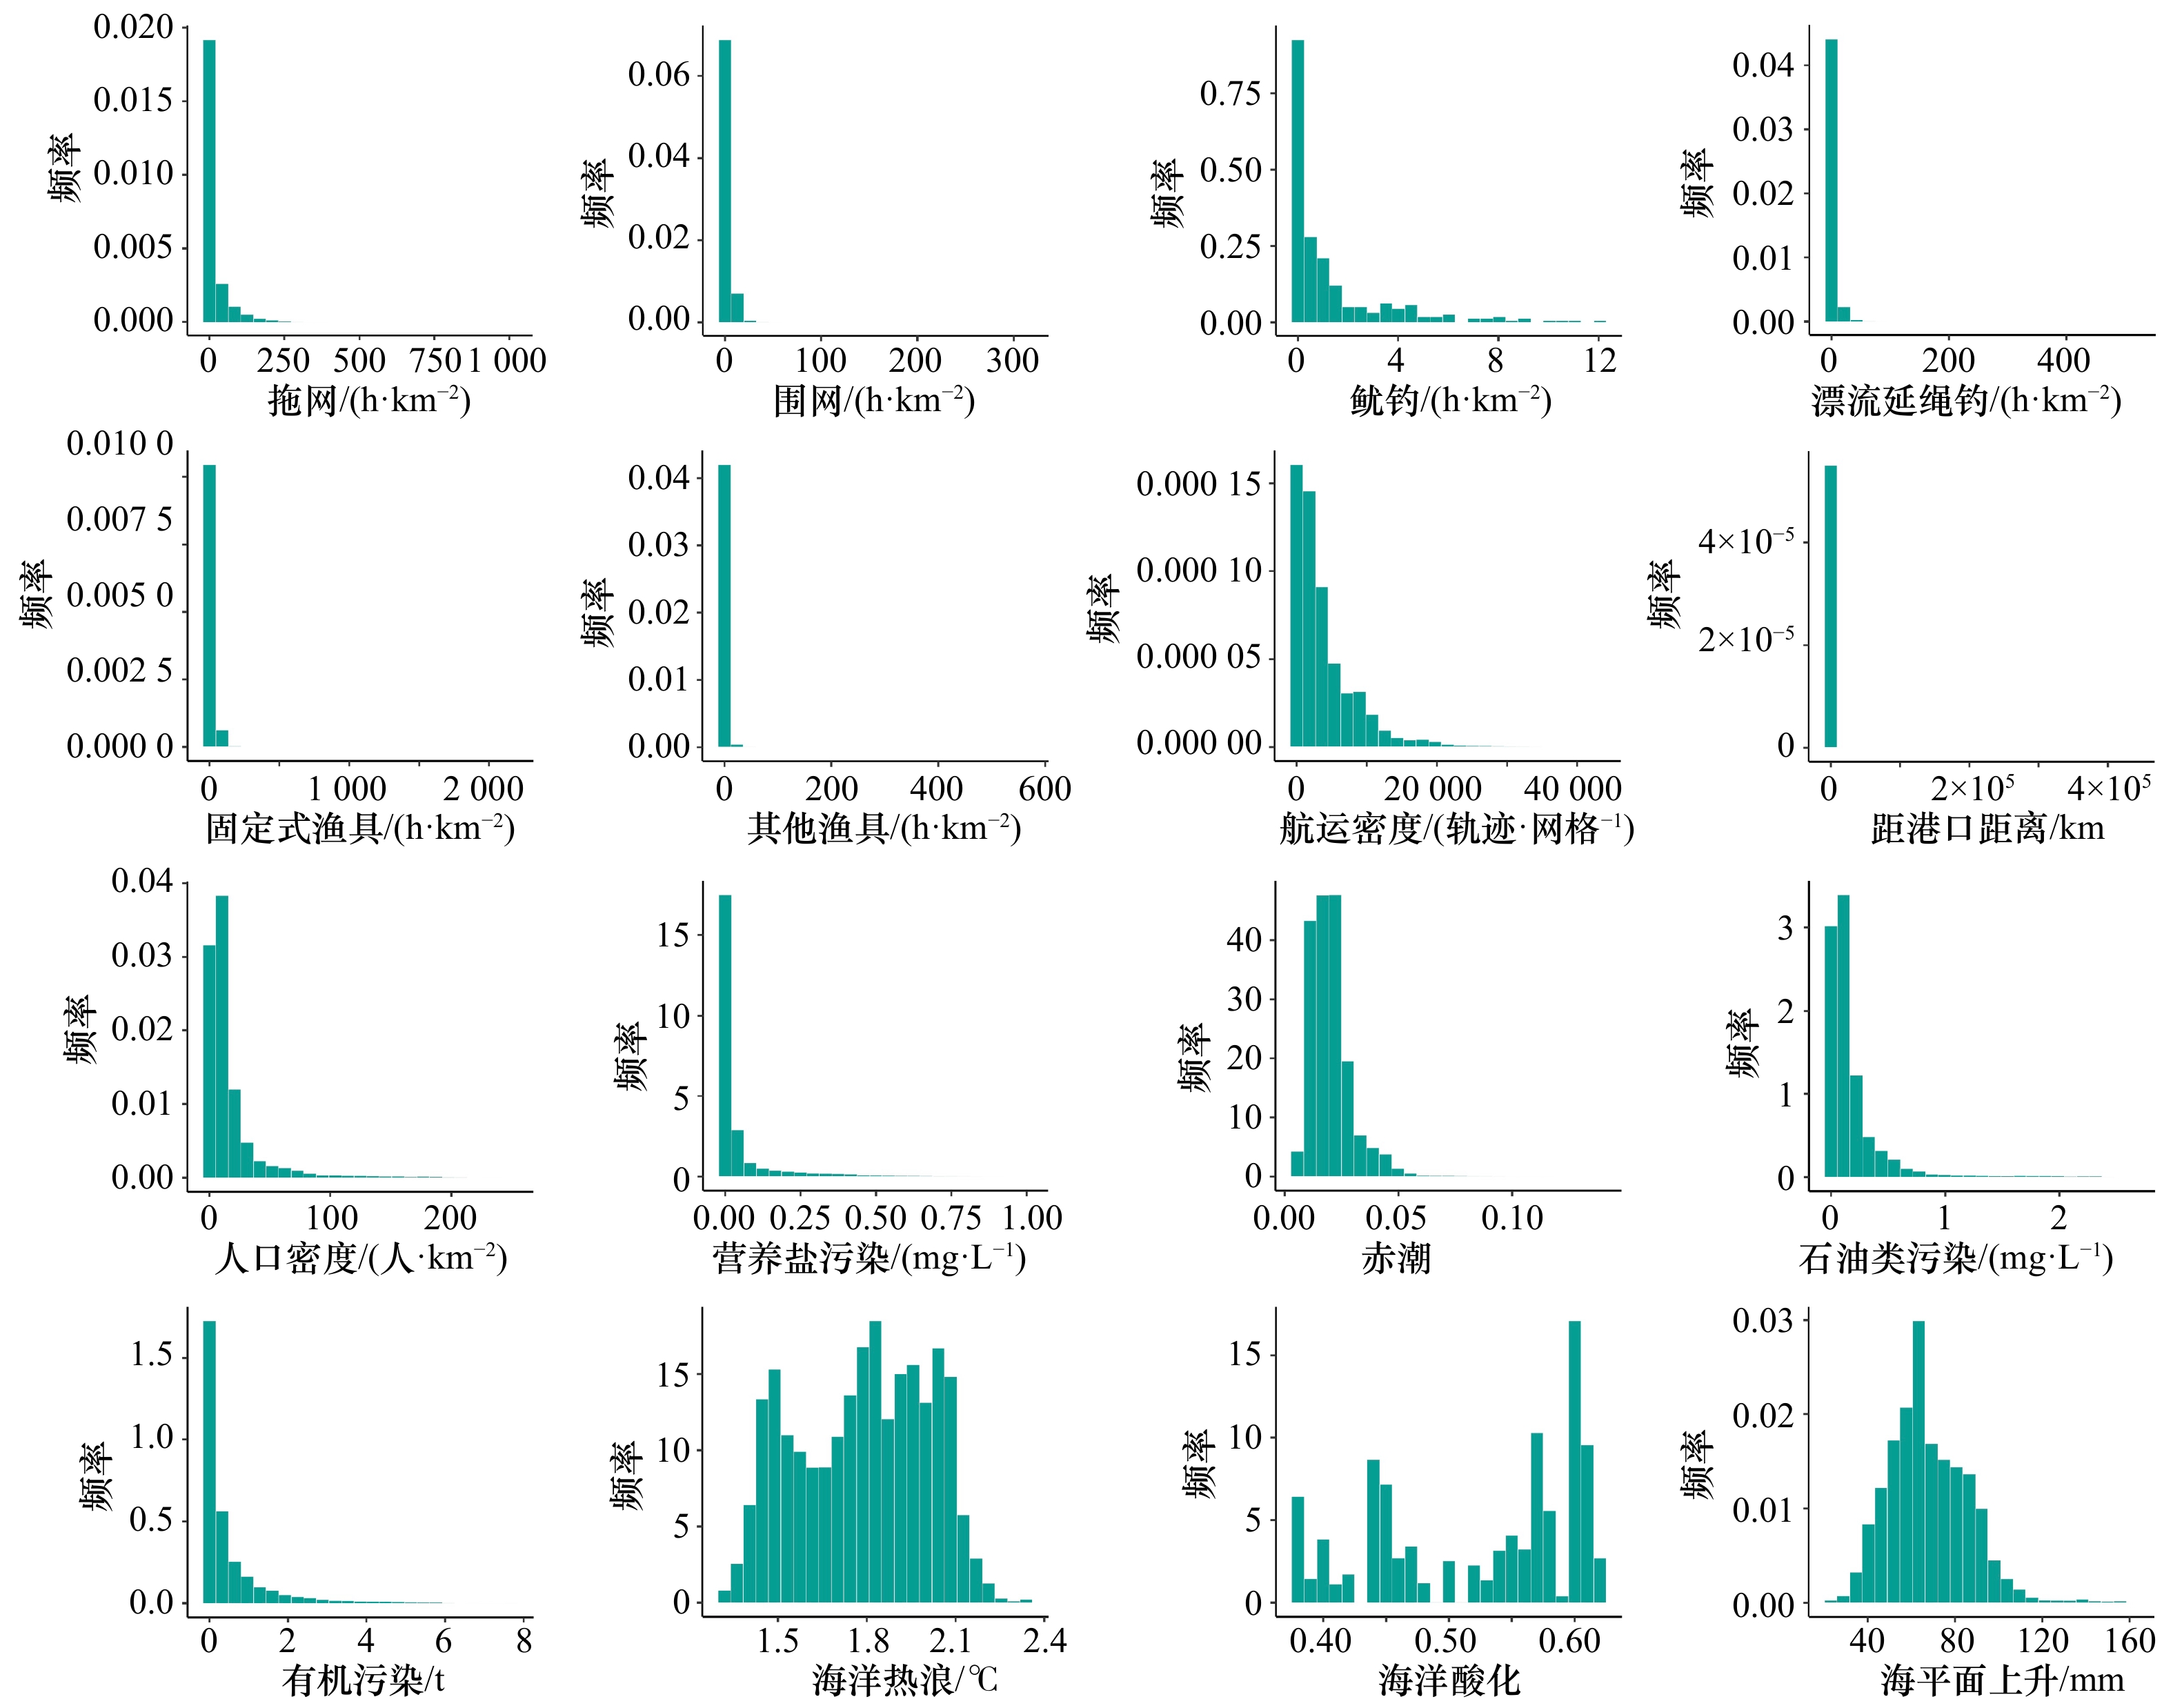
图 3 16个生态压力因子未转换前数值分布频率直方图
Fig. 3 Frequency histogram of the numerical distribution of 16 pressure factors before conversion

图 5 我国近海人类活动压力累积暴露度(a)、渤海海域(b)、长三角海域(c)、珠三角海域(d)的局部放大图以及其压力值频次分布(e−g)
Fig. 5 Accumulated exposure to pressure from human activities in the coastal seas of China (a), and the Bohai Sea (b), the Changjiang River Delta (c), a partial enlarged view of the Zhujiang River Delta (d), and represent the frequency distribution of pressure values(e−g), respectively
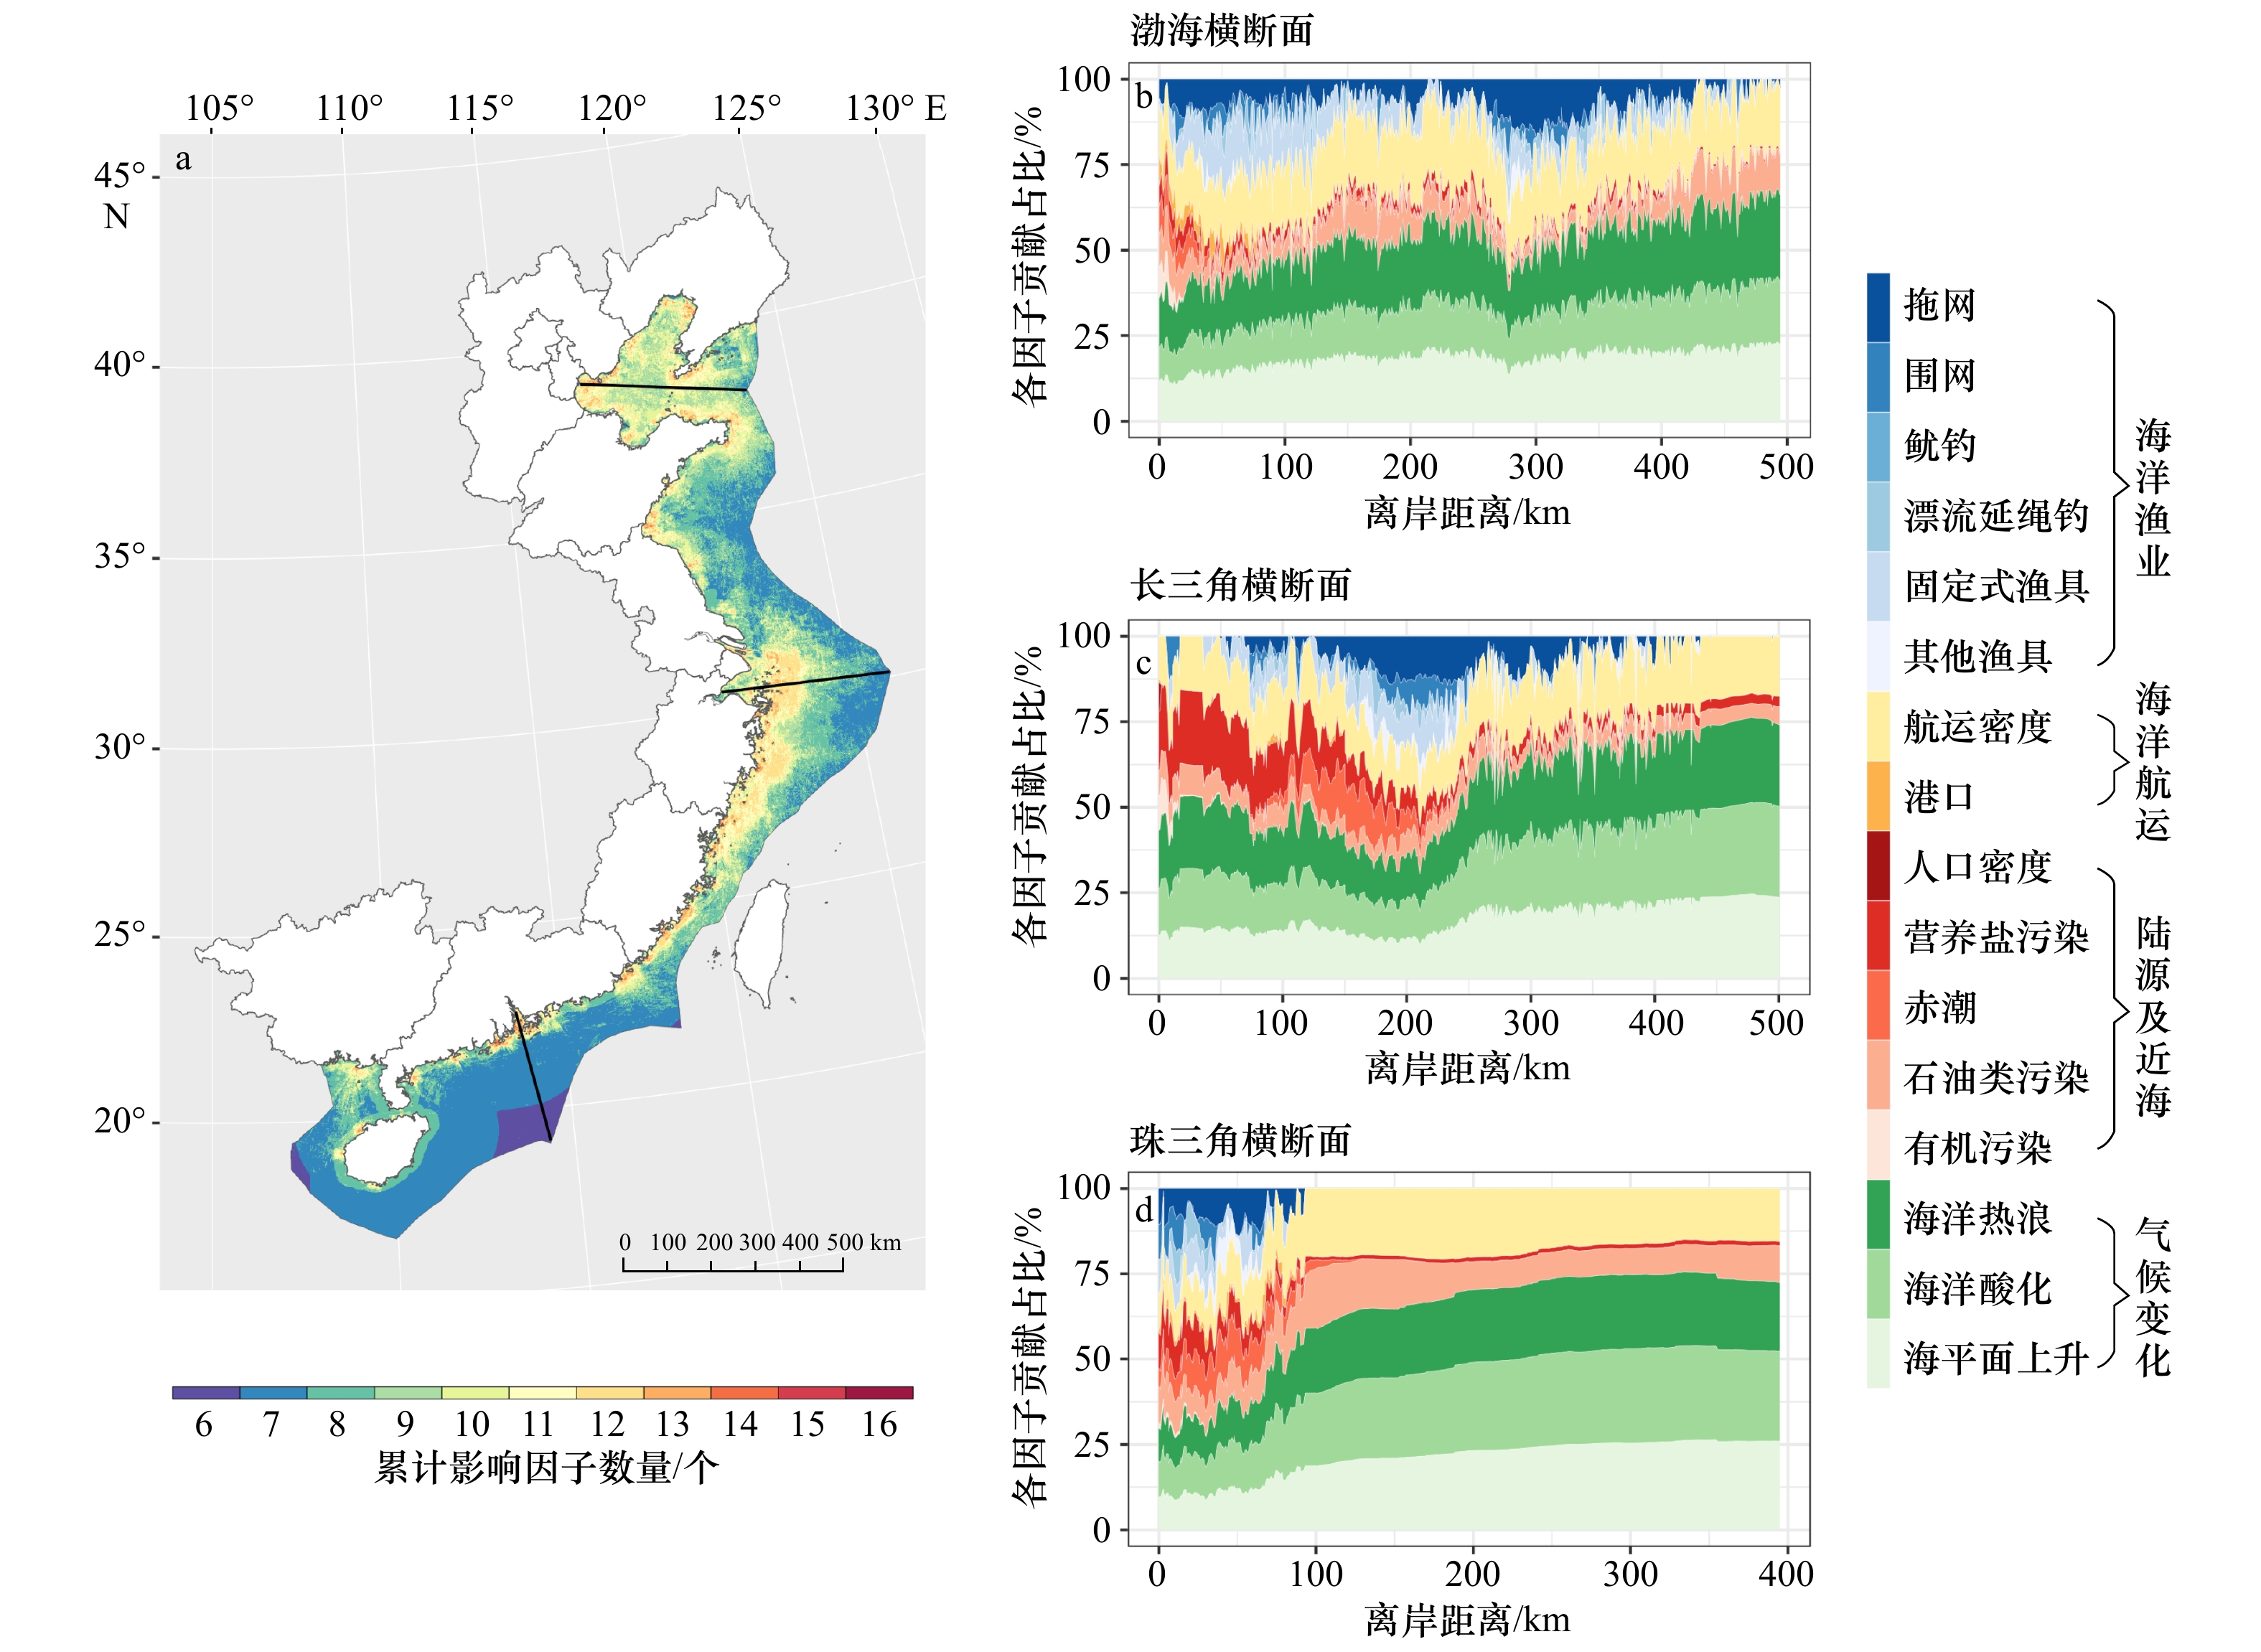
图 6 我国近海人类活动压力累积影响因子数量(a)及其对总累积暴露度的贡献百分比(b−d)
Fig. 6 The cumulative number of factors affecting the pressure of human activities in the coastal seas of China (a) and their contribution to the total cumulative exposure (b−d)
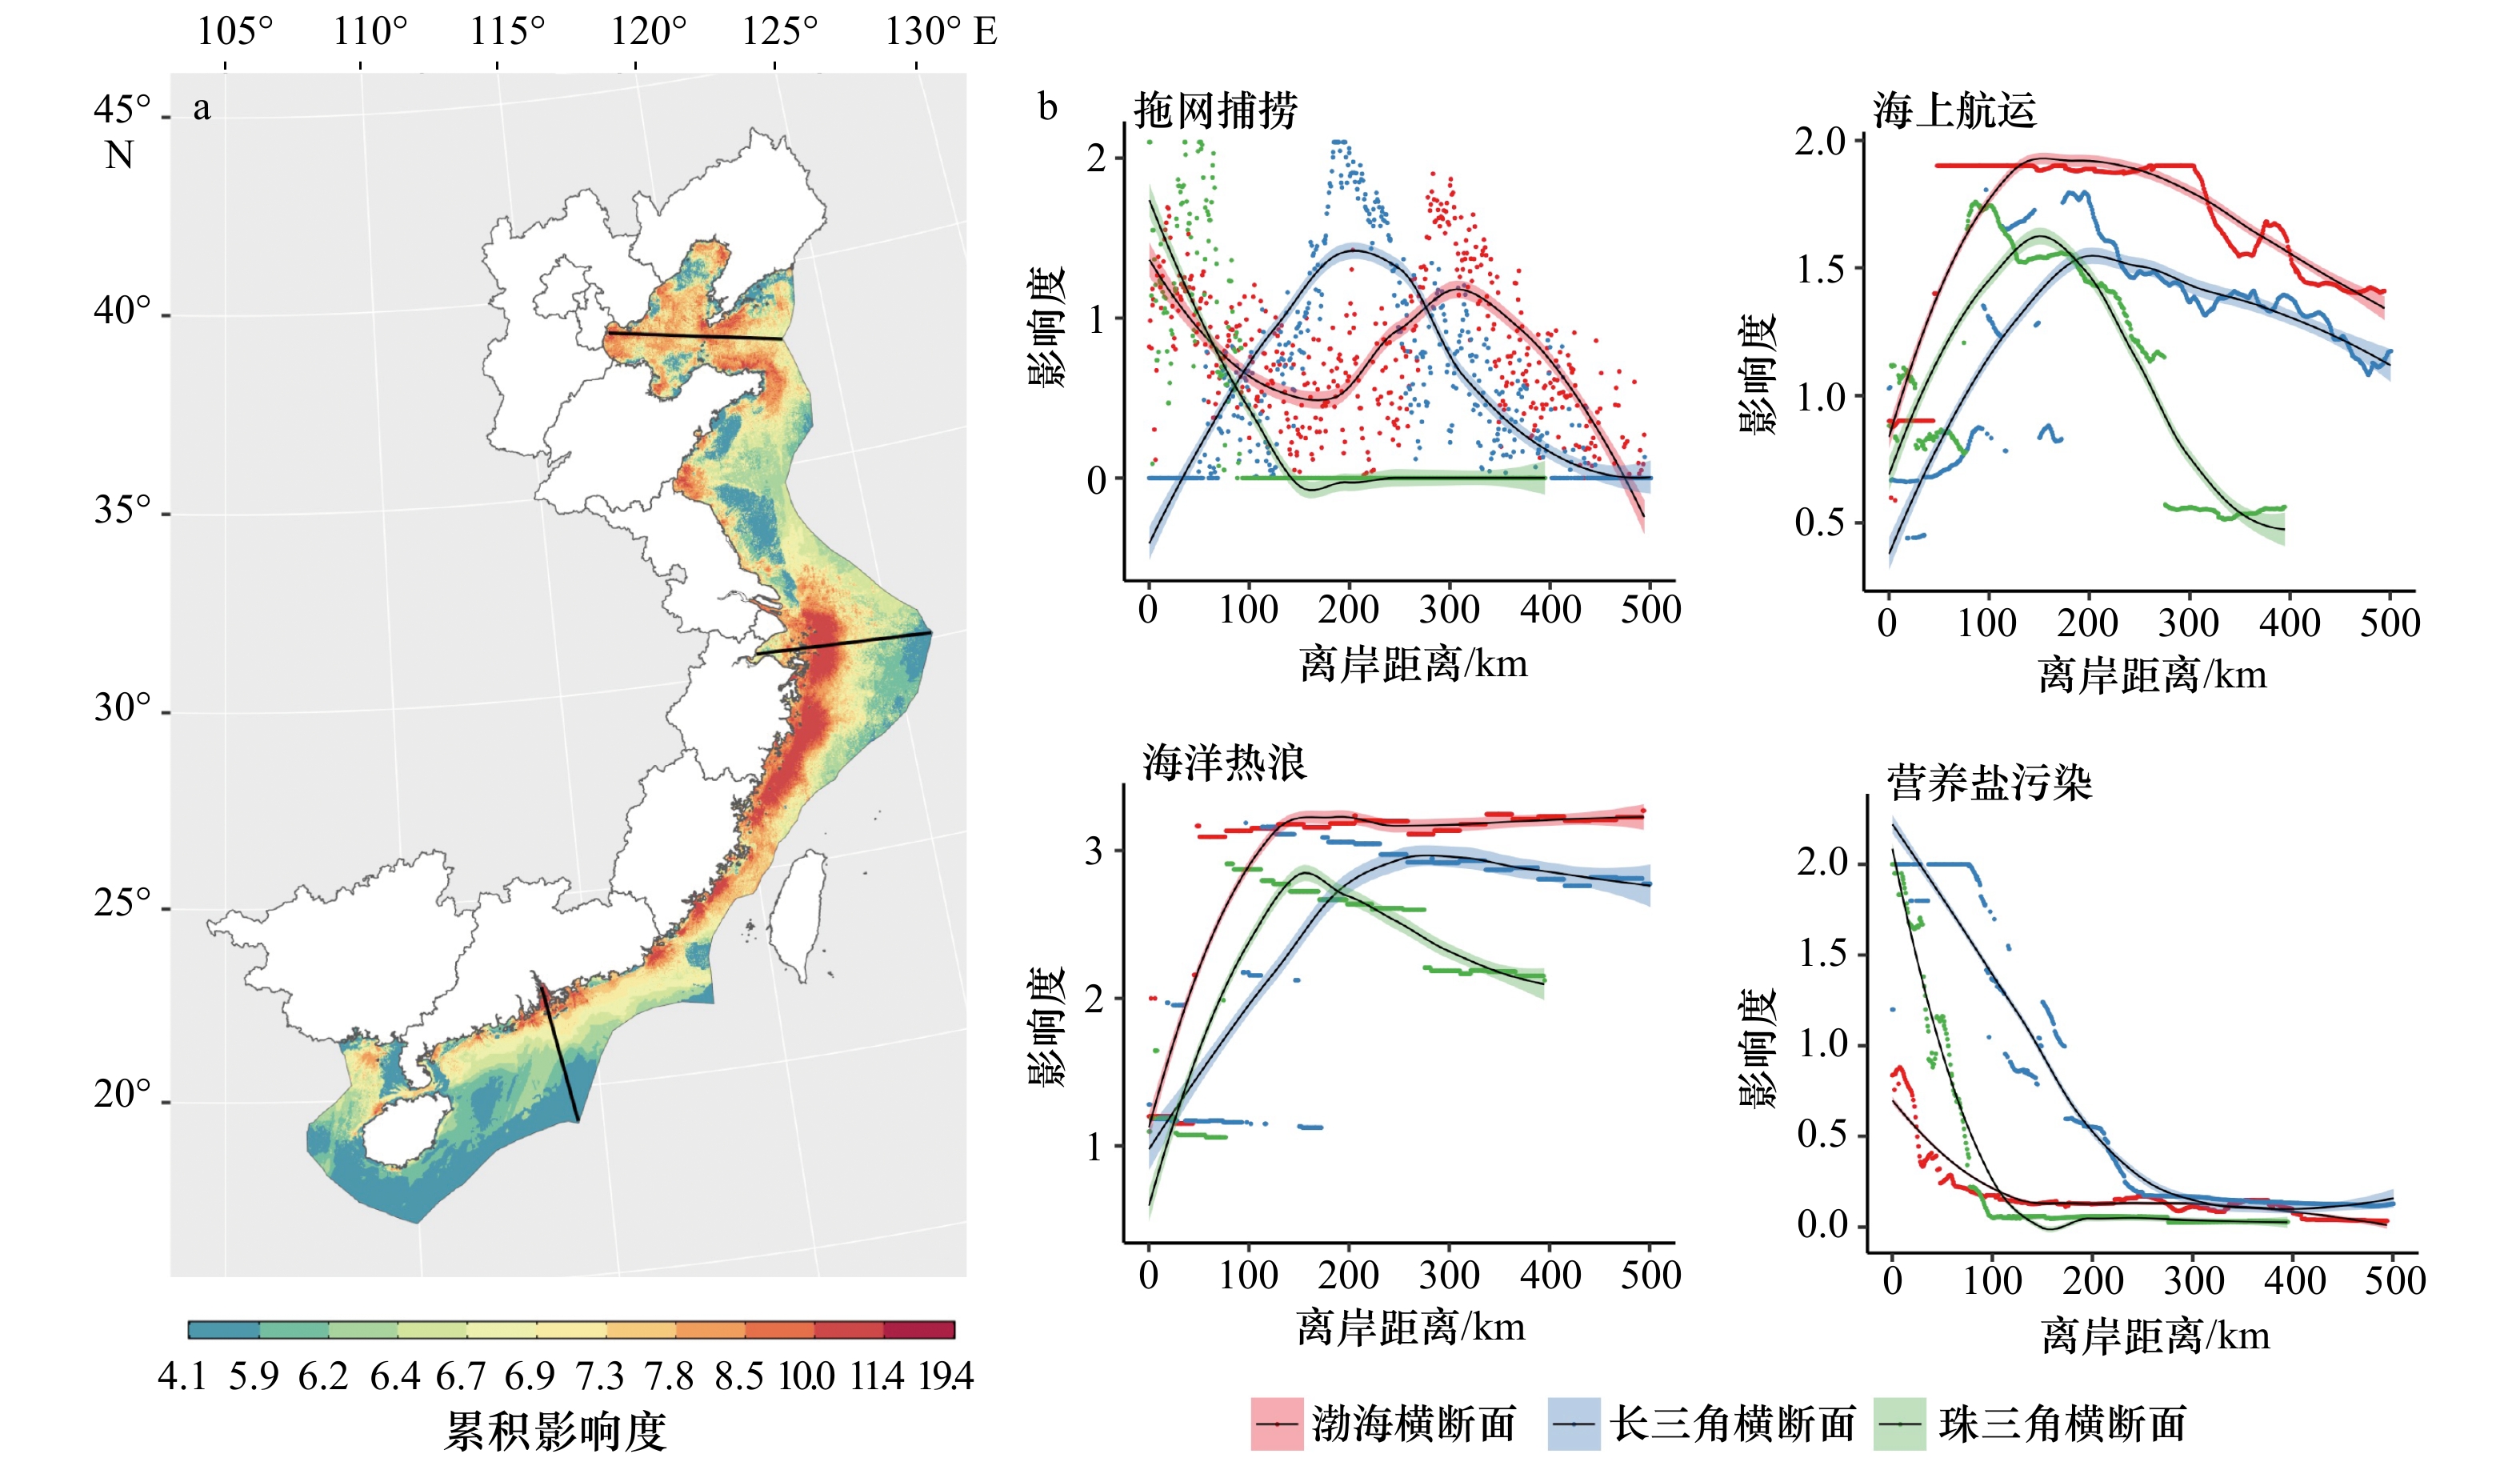
图 7 人类活动压力对我国近海海洋生态系统的累积影响度(a)和4种特定人类活动压力因子(拖网捕捞、海上航运、海洋热浪及营养盐污染)的横断面图(b)
散点为各网格点得分,各趋势线为局部加权回归拟合线
Fig. 7 The cumulative impact of human activity pressure on China’s coastal marine ecosystems (a), and a cross-sectional view of four specific human activity pressure factors (trawling fishing, maritime navigation, ocean heat waves, and nutrient pollution) (b)
The point is the score of each grid point, and each trend line is the locally weighted regression fitting line
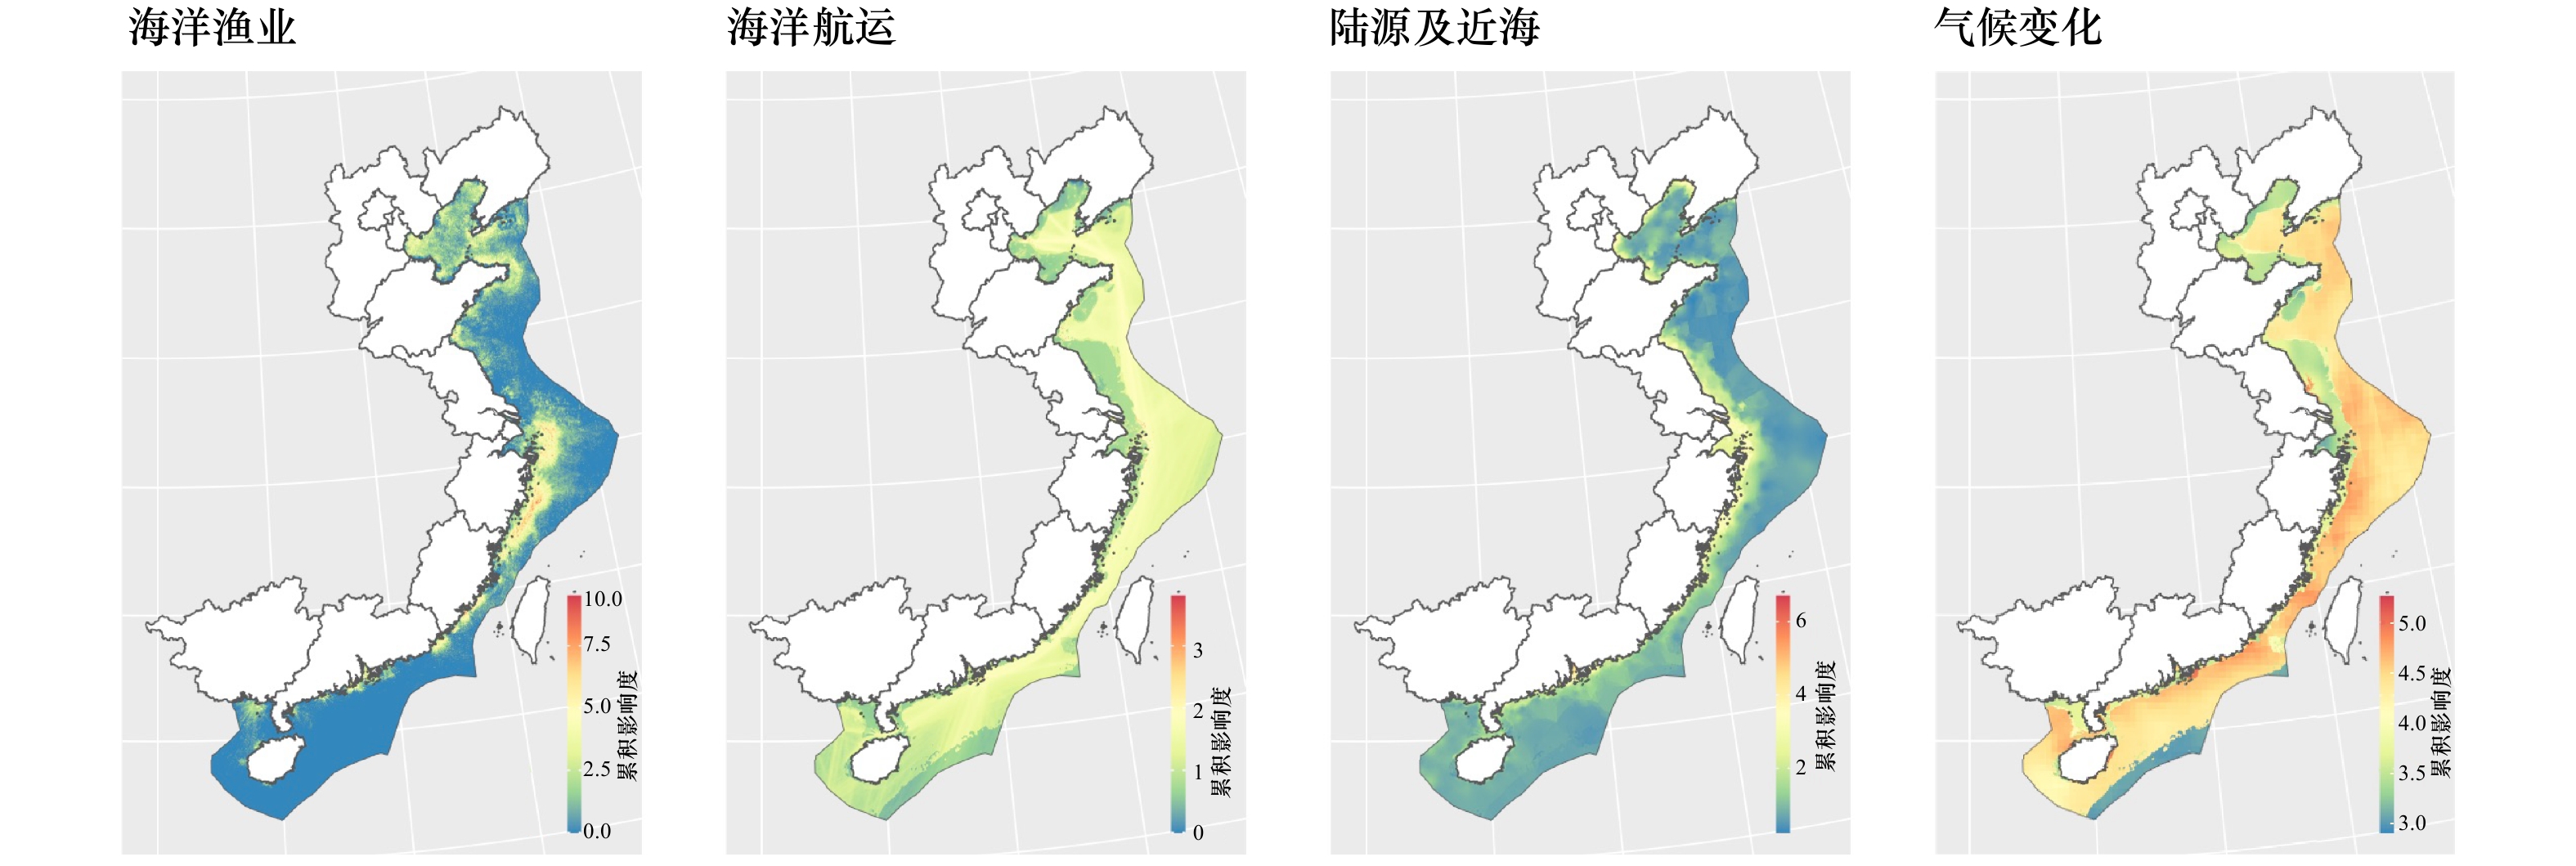
图 8 海洋渔业(压力因子数目为6)、海洋航运(压力因子数目为2)、陆源及近海(压力因子数目为5)及气候变化(压力因子数目为3)累积影响度空间分布
Fig. 8 Spatial distribution of cumulative influence of marine fisheries (number of pressure factors is 6), ocean shipping (number of pressure factors is 2), land-source and offshore (number of pressure factors is 5), and climate change (number of pressure factors is 3)
表 1 生态压力因子(N=16)描述及数据来源
Tab. 1 Description of each stress factor (N=16) and data source
类别 压力因子 空间 时间 压力量化 来源 海洋渔业 S1拖网 0.01°×0.01° 2015年 基于每日各栅格点捕捞努力量计算不同类型捕捞方式的年均值(单位:h/km2) 文献[15] S2围网 0.01°×0.01° 2015年 基于每日各栅格点捕捞努力量计算不同类型捕捞方式的年均值(单位:h/km2) 文献[15] S3鱿钓 0.01°×0.01° 2015年 基于每日各栅格点捕捞努力量计算不同类型捕捞方式的年均值(单位:h/km2) 文献[15] S4漂流延绳钓 0.01°×0.01° 2015年 基于每日各栅格点捕捞努力量计算不同类型捕捞方式的年均值(单位:h/km2) 文献[15] S5固定式渔具 0.01°×0.01° 2015年 基于每日各栅格点捕捞努力量计算不同类型捕捞方式的年均值(单位:h/km2) 文献[15] S6其他渔具 0.01°×0.01° 2015年 基于每日各栅格点捕捞努力量计算不同类型捕捞方式的年均值(单位:h/km2) 文献[15] 海洋航运 S7航运 0.1°×0.1° 2013年 由航运轨迹密度确定(单位:轨迹/网格) 文献[5] S8港口 0.01°×0.01° − 基于距港口远近,取倒数(单位:km) 文献[16] 陆源及近海 S9人口密度 1 km×1 km 2015年 以离岸1 km海域网格点为中心,计算其10 km半径缓冲区内人口数量(单位:人/km2) 文献[17] S10营养盐污染 站点监测 2015年 监测点数据来源于生态环境部(单位:mg/L) 文献[18] S11赤潮 位置点 2005−2015年 基于近10年间赤潮累积发生位置点,做核密度估计(无量纲) 文献[19] S12石油类污染 站点监测 2015年 监测点数据来源于生态环境部(单位:mg/L) 文献[20] S13有机污染 1 km×1 km 2013年 主要基于农药、杀虫剂用量模拟得到(单位:t) 文献[5] 气候变化 S14海表热浪 0.25°×0.25° 2015年 基于最优插值海表温度产品OISST获得(单位:℃) 文献[21] S15海洋酸化 1°×1° 2013年 基于月均文石饱和度状况获得(无量纲) 文献[5] S16海平面上升 0.25°×0.25° 1992−2012年 基于AVISO卫星高度计产品获得(单位:mm) 文献[22] 注: −代表无年份区别。  下载: 导出CSV
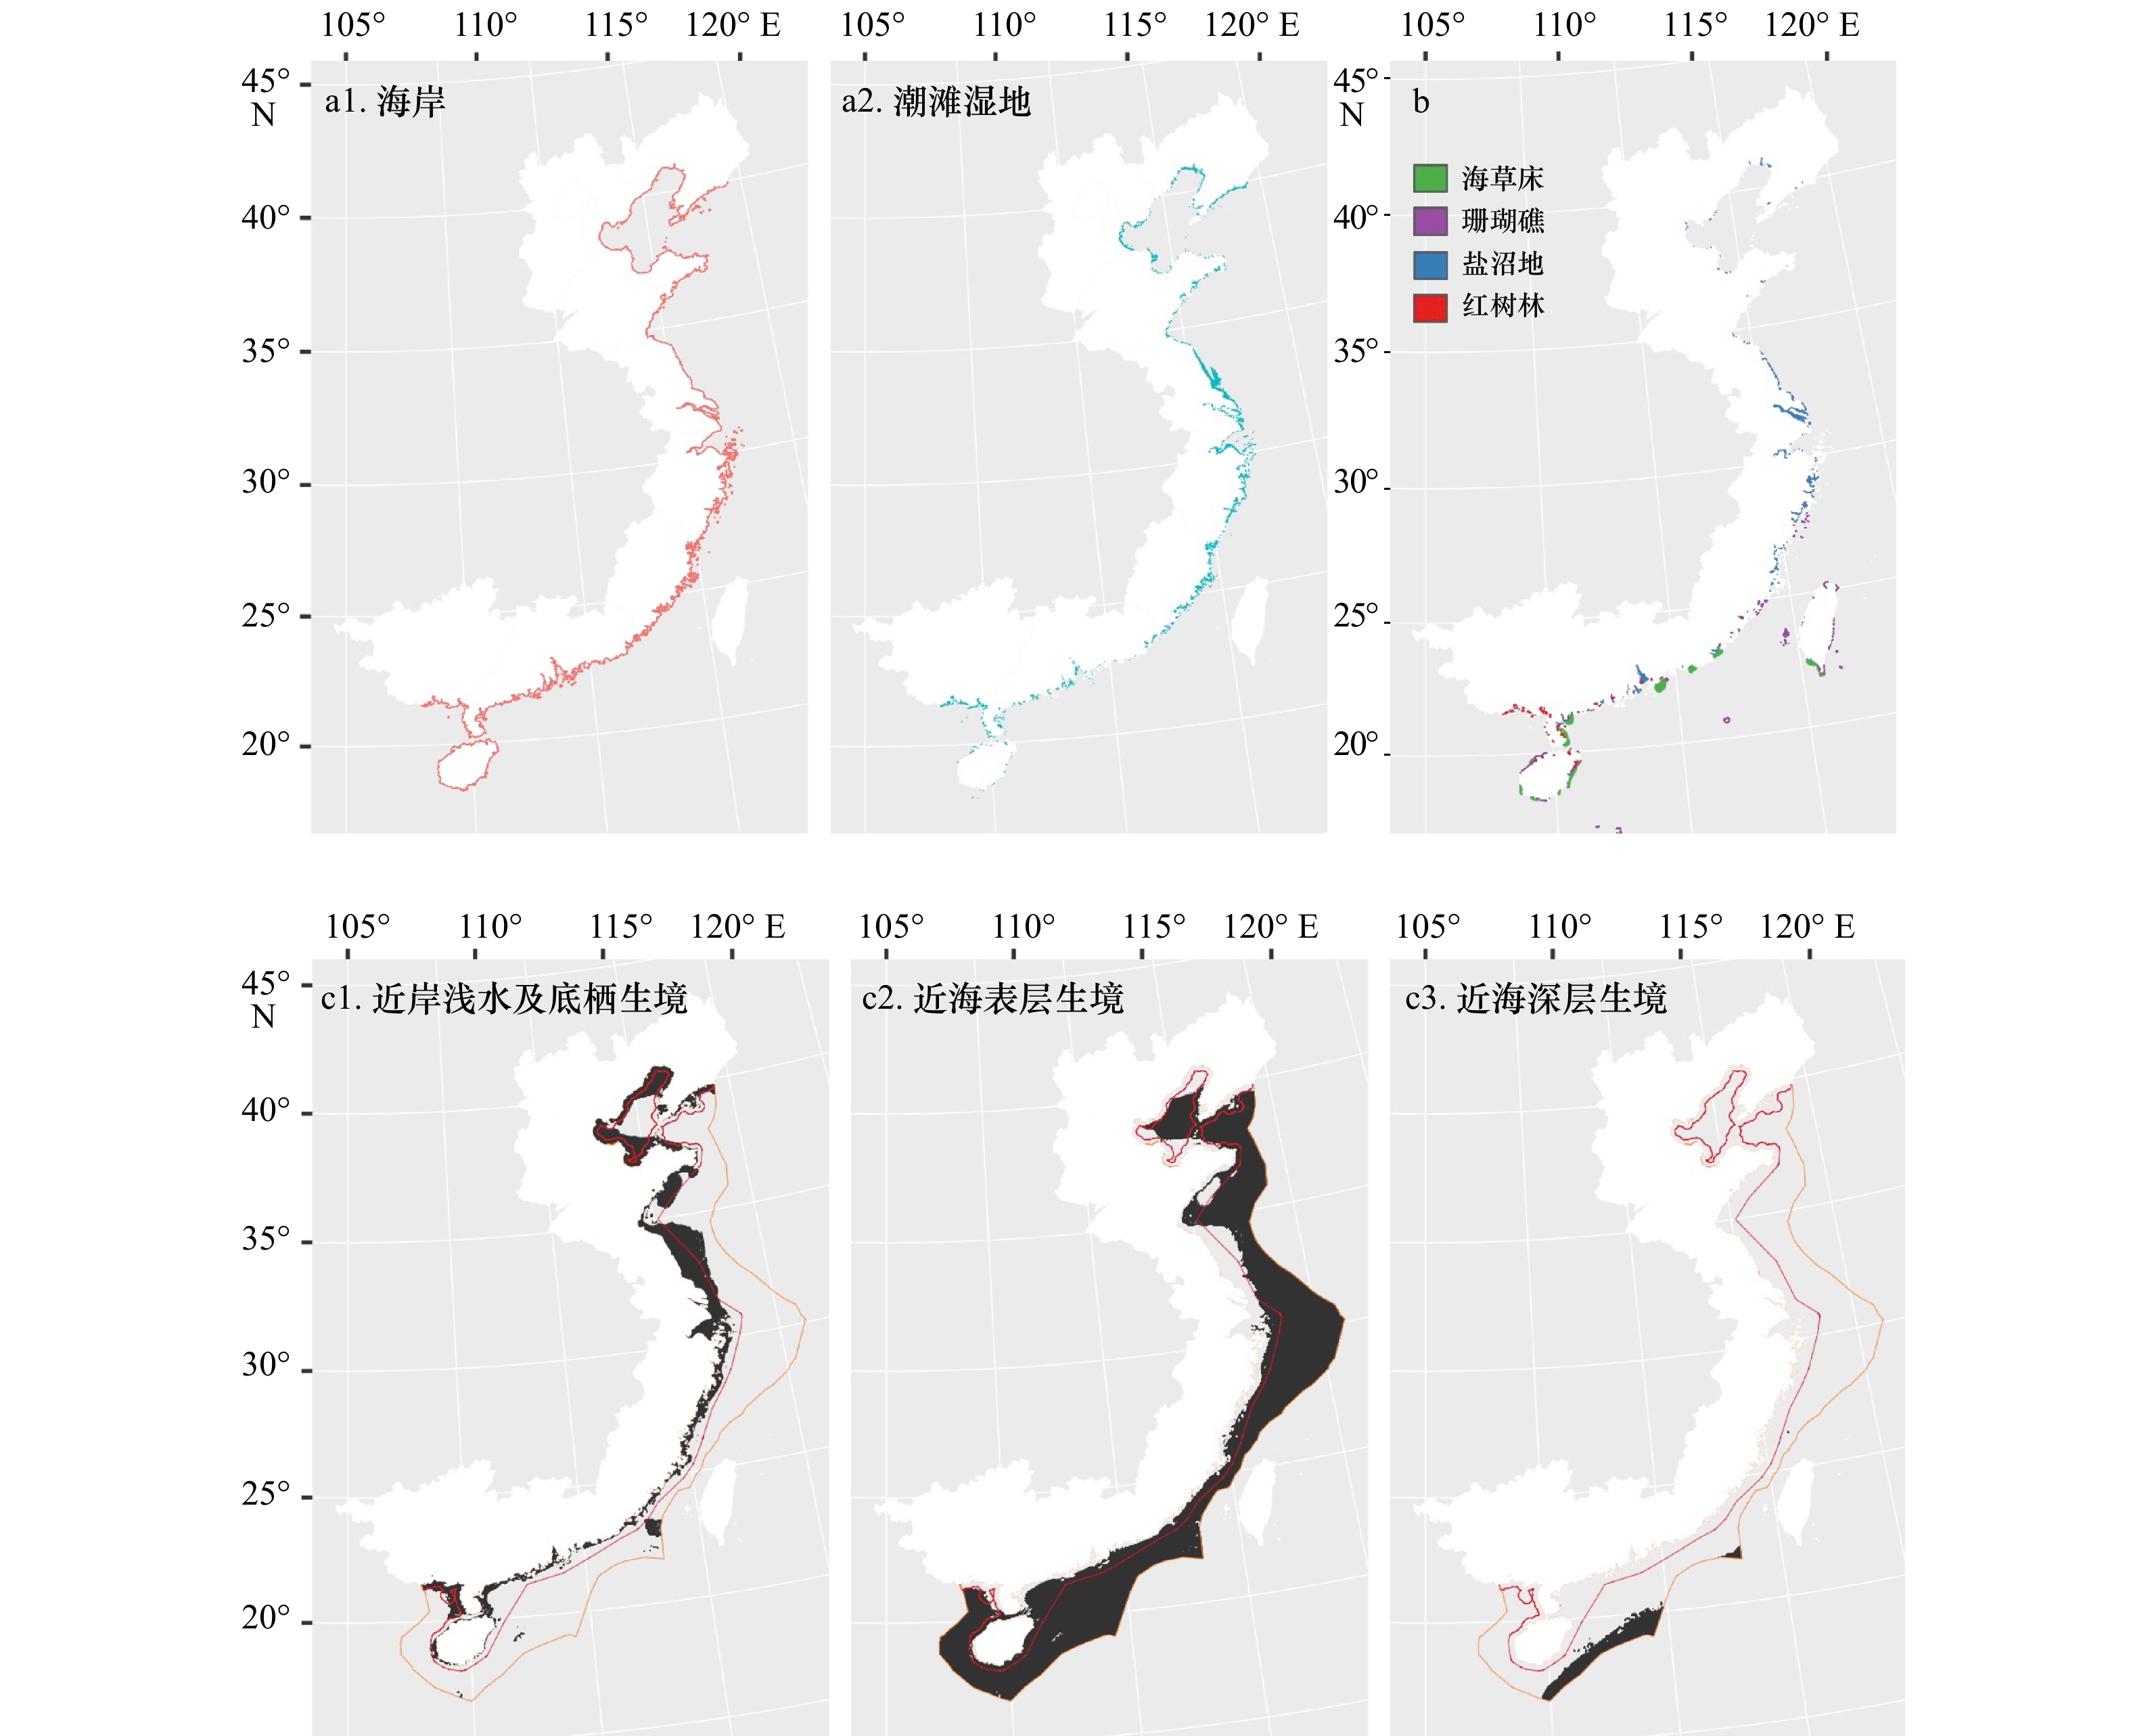
表 2 海洋生境(N=9)分类及数据来源
Tab. 2 Classification and source of various marine habitats (N=9)
序号 生境类型 描述 来源 H1 海岸 根据大陆地边界向外延伸1 km的区域 文献[23] H2 潮滩湿地 根据卫星遥感影像反演的2014−2016年的均值分布区域 文献[24] H3 红树林 2015年我国沿海红树林分布 文献[25] H4 盐沼地 根据全球盐沼地分布数据截取我国近岸盐沼地分布区域 文献[26] H5 海草床 根据全球盐沼地分布数据截取我国近岸海草床分布区域 文献[26] H6 珊瑚礁 根据全球盐沼地分布数据截取我国近岸珊瑚礁分布区域 文献[26] H7 近岸浅水及底栖生境 水深小于20 m的区域,以浅水和底栖环境为主 文献[26] H8 近海表层生境 水深大于20 m的表层水环境 文献[27] H9 近海深层生境 水深大于200 m的深层水环境 文献[27]
下载: 导出CSV
表 3 不同生境对应不同压力因子的脆弱性矩阵
Tab. 3 Vulnerability matrix corresponding to different stress factors in different habitats
H1 H2 H3 H4 H5 H6 H7 H8 H9 S1 0.2 1.3 0 1 0.2 1.2 2.1 2.1 0.8 S2 0 0 0 0.4 0 0.7 0.6 2.2 0.6 S3 0 0 0 0.4 0 0.7 0.6 2.2 0.6 S4 0.1 0 0 0.5 0 0.5 0 3 2.2 S5 0.9 1.9 0.9 1 1.1 1.6 2.1 1.6 0 S6 0.7 0.6 0.7 0.8 0.8 1.2 1.6 1.2 0 S7 1.9 0.3 2 1.4 1.9 1.5 0.3 1.9 0 S8 1 2 2 1.4 1.9 1.5 2 1.9 0 S9 2.7 2.8 3.3 1.6 2.5 2.3 2 0.9 0 S10 0.4 1.6 1.8 1.9 2.1 1.8 2 1.2 0 S11 0.4 1.6 1.8 1.9 2.1 1.8 2 1.2 0 S12 0.1 2.1 1.4 1.7 1 1.2 1.2 1.9 1.6 S13 0.1 2.1 1.4 1.7 1 1.2 1.2 1.9 1.6 S14 1.4 2.8 2.4 1.4 2.1 2.8 0.5 3.3 2.3 S15 0 0.9 1.2 1.3 1.4 1.1 0.1 1.8 0 S16 1.9 2.5 3 3.1 2.6 2.4 2.2 0 0
下载: 导出CSV
-
[1] Chen Dongsheng, Wang Xiaotong, Li Yue, et al. High-spatiotemporal-resolution ship emission inventory of China based on AIS data in 2014[J]. Science of the Total Environment, 2017, 609: 776−787. doi: 10.1016/j.scitotenv.2017.07.051 [2] 刘子飞. 我国近海捕捞渔业管理政策困境、逻辑与取向[J]. 生态经济, 2018, 34(11): 47−53.Liu Zifei. Research on management policies of marine capture fishery resources: issues, logic and choice[J]. Ecological Economy, 2018, 34(11): 47−53. [3] 陈石泉, 王道儒, 吴钟解, 等. 海南岛东海岸海草床近10 a变化趋势探讨[J]. 海洋环境科学, 2015, 34(1): 48−53.Chen Shiquan, Wang Daoru, Wu Zhongjie, et al. Discussion of the change trend of the seagrass beds in the east coast of Hainan Island in nearly a decade[J]. Marine Environmental Science, 2015, 34(1): 48−53. [4] 余克服. 南海珊瑚礁及其对全新世环境变化的记录与响应[J]. 中国科学: 地球科学, 2012, 55(8): 1217−1229. doi: 10.1007/s11430-012-4449-5Yu Kefu. Coral reefs in the South China Sea: their response to and records on past environmental changes[J]. Science China Earth Science, 2012, 55(8): 1217−1229. doi: 10.1007/s11430-012-4449-5 [5] Sun Zhigao, Sun Wenguang, Tong Chuan, et al. China’s coastal wetlands: conservation history, implementation efforts, existing issues and strategies for future improvement[J]. Environment International, 2015, 79: 25−41. doi: 10.1016/j.envint.2015.02.017 [6] Halpern B S, Walbridge S, Selkoe K A, et al. A global map of human impact on marine ecosystems[J]. Science, 2008, 319(5865): 948−952. doi: 10.1126/science.1149345 [7] Halpern B S, Frazier M, Potapenko J, et al. Spatial and temporal changes in cumulative human impacts on the world’s ocean[J]. Nature Communications, 2015, 6: 7615. doi: 10.1038/ncomms8615 [8] Micheli F, Halpern B S, Walbridge S, et al. Cumulative human impacts on Mediterranean and Black Sea marine ecosystems: assessing current pressures and opportunities[J]. PLoS One, 2013, 8(12): e79889. doi: 10.1371/journal.pone.0079889 [9] Andersen J H, Al-Hamdani Z, Harvey E T, et al. Relative impacts of multiple human stressors in estuaries and coastal waters in the North Sea–Baltic Sea transition zone[J]. Science of the Total Environment, 2020, 704: 135316. doi: 10.1016/j.scitotenv.2019.135316 [10] Beauchesne D, Daigle R M, Vissault S, et al. Characterizing exposure to and sharing knowledge of drivers of environmental change in the St. Lawrence system in Canada[J]. Frontiers in Marine Science, 2020, 7: 383. doi: 10.3389/fmars.2020.00383 [11] Foden J, Rogers S I, Jones A P. Human pressures on UK seabed habitats: a cumulative impact assessment[J]. Marine Ecology Progress Series, 2011, 428: 33−47. doi: 10.3354/meps09064 [12] Parravicini V, Rovere A, Vassallo P, et al. Understanding relationships between conflicting human uses and coastal ecosystems status: a geospatial modeling approach[J]. Ecological Indicators, 2012, 19: 253−263. doi: 10.1016/j.ecolind.2011.07.027 [13] Knights A M, Piet G J, Jongbloed R H, et al. An exposure-effect approach for evaluating ecosystem-wide risks from human activities[J]. ICES Journal of Marine Science, 2015, 72(3): 1105−1115. doi: 10.1093/icesjms/fsu245 [14] Halpern B S, Frazier M, Afflerbach J, et al. Recent pace of change in human impact on the world’s ocean[J]. Scientific Reports, 2019, 9: 11609. doi: 10.1038/s41598-019-47201-9 [15] Kroodsma D A, Mayorga J, Hochberg T, et al. Tracking the global footprint of fisheries[J]. Science, 2018, 359(6378): 904−908. doi: 10.1126/science.aao5646 [16] Global Fishing Watch[EB/OL]. [2020−10−13]. https://globalfishingwatch.org/map-and-data/. [17] 徐新良. 中国人口空间分布公里网格数据集[EB/OL]. [2020−10−13]. 中国科学院资源环境科学数据中心数据注册与出版系统(http://www.resdc.cn/DOI).https://doi.org/10.12078/2017121101.Xu Xinliang. China’s population spatial distribution kilometer grid dataset[EB/OL]. [2020−10−13]. Data Registration and Publishing System of the Resource and Environmental Science Data Center of the Chinese Academy of Sciences (http://www.resdc.cn/DOI). https://doi.org/10.12078/2017121101. [18] Jiang Qutu, He Junyu, Wu Jiaping, et al. Space-time characterization and risk assessment of nutrient pollutant concentrations in China’s near seas[J]. Journal of Geophysical Research: Oceans, 2019, 124(7): 4449−4463. doi: 10.1029/2019JC015038 [19] Xiao Xi, Agustí S, Pan Yaoru, et al. Warming amplifies the frequency of harmful algal blooms with eutrophication in Chinese coastal waters[J]. Environmental Science & Technology, 2019, 53(22): 13031−13041. [20] 中华人民共和国自然资源部. 2015年海水水质监测信息 [EB/OL]. [2020−10−13]. http://gc.mnr.gov.cn/201806/t20180614_1794781.html.Ministry of Natural Resources of the People’s Republic of China. Sea water quality monitoring information 2015 [EB/OL]. [2020−10−13]. http://gc.mnr.gov.cn/201806/t20180614_1794781.html. [21] Schlegel R W, Oliver E C J, Wernberg T, et al. Nearshore and offshore co-occurrence of marine heatwaves and cold-spells[J]. Progress in Oceanography, 2017, 151: 189−205. doi: 10.1016/j.pocean.2017.01.004 [22] AVISO Satellite Altimetry Data [EB/OL]. [2020−10−13]. https://www.aviso.altimetry.fr/en/data/products.html. [23] Marineregions. org [EB/OL]. [2020−10−13]. https://www.marineregions.org/downloads.php. [24] Murray N J, Phinn S R, DeWitt M, et al. The global distribution and trajectory of tidal flats[J]. Nature, 2019, 565(7738): 222−225. doi: 10.1038/s41586-018-0805-8 [25] Chen Bangqian, Xiao Xiangming, Li Xiangping, et al. A mangrove forest map of China in 2015: analysis of time series Landsat 7/8 and Sentinel-1A imagery in Google Earth Engine cloud computing platform[J]. ISPRS Journal of Photogrammetry and Remote Sensing, 2017, 131: 104−120. doi: 10.1016/j.isprsjprs.2017.07.011 [26] UNEP-WCMC [EB/OL]. [2020−10−13]. https://www.unep-wcmc.org/resources-and-data. [27] NOAA National Centers for Environmental Information (NCEI). ETOPO1 data sources [EB/OL]. [2020−10−13]. https://www.ngdc.noaa.gov/mgg/global/etopo1sources.html. [28] Feist B E, Levin P S. Novel indicators of anthropogenic influence on marine and coastal ecosystems[J]. Frontiers in Marine Science, 2016, 3: 113. [29] Halpern B S, Fujita R. Assumptions, challenges, and future directions in cumulative impact analysis[J]. Ecosphere, 2013, 4(10): 1−11. [30] Smale D A, Wernberg T, Oliver E C J, et al. Marine heatwaves threaten global biodiversity and the provision of ecosystem services[J]. Nature Climate Change, 2019, 9: 306−312. doi: 10.1038/s41558-019-0412-1 [31] Fernandes M D L, Quintela A, Alves F L. Identifying conservation priority areas to inform maritime spatial planning: a new approach[J]. Science of the Total Environment, 2018, 639: 1088−1098. doi: 10.1016/j.scitotenv.2018.05.147 [32] Batista M I, Henriques S, Pais M P, et al. Assessment of cumulative human pressures on a coastal area: integrating information for MPA planning and management[J]. Ocean & Coastal Management, 2014, 102: 248−257. [33] Kelly C, Gray L, Shucksmith R J, et al. Investigating options on how to address cumulative impacts in marine spatial planning[J]. Ocean & Coastal Management, 2014, 102: 139−148. [34] Wang Junjie, Beusen A H W, Liu Xiaochen, et al. Aquaculture production is a large, spatially concentrated source of nutrients in Chinese freshwater and coastal seas[J]. Environmental Science & Technology, 2020, 54(3): 1464−1474. [35] Bugnot A B, Mayer-Pinto M, Airoldi L, et al. Current and projected global extent of marine built structures[J]. Nature Sustainability, 2021, 4: 33−41. doi: 10.1038/s41893-020-00595-1 -

计量
- 文章访问数: 594
- HTML全文浏览量: 234
- PDF下载量: 34
- 被引次数: 0
