

Numerical simulation of the migration path during the growth period of Ulva prolifera in the sea near northern Jiangsu and the thermohaline environment
-
摘要: 基于已验证的有限体积海岸海洋模型(FVCOM)和拉格朗日粒子离线追踪模块,模拟了潮、风、环流、温盐、波等外界强迫不同组合下苏北海域水面粒子的5种运移路径,通过实际漂流瓶轨迹验证,并进行路径间的差异与对应单强迫流场对比研究,探讨发端于苏北的浒苔运移路径及其影响因素。结果表明:浒苔运移路径先沿着苏北沿岸向北运移至废黄河口附近海域,之后向东北方向偏转继续运移,一直到山东半岛南部海域;影响苏北浒苔运移路径的外界强迫主要是风,其次是温盐、波浪、环流,潮流可以引起浒苔在局地的旋转往复运动,不能使其向北远距离漂移。漂流期间,苏北沿岸海域表层温度为18~24℃、盐度为28~31,温盐条件在浒苔最宜生长条件范围,是浒苔能边漂移边大面积暴发的原因之一。Abstract: A high resolution numerical model based on a proven FVCOM with a Lagrangian particle tracking module was introduced to simulate water particle movement under differences controlling conditions, including the tide, wind, boundary circulation flow, temperature, salinity, wave coupling etc. Combined with simulate results and the actual drift bottles movement paths, factors influencing Ulva prolifera were discussed. The results showed that the migration path of U. prolifera firstly migrated northward along the coast of northern Jiangsu to the sea area near the abandoned Huanghe River
Estuary and then continued its migration to the sea area south of Shandong Peninsula. The external forces that affecting the migration of U. prolifera is mainly wind. It is an order of magnitude higher than anything else and followed by temperature-salinity, wave, tidal, circulation, the tidal current can cause the cyclic movement of U. prolifera in the local area, and it has no influence on Enteromorpha for drifting to the north more distant. During the simulation period, the surface temperature, salinity of drifting sea area were between 18−24℃, 28−31, respectively. These temperature and salinity conditions are close to the most suitable growth conditions of U. prolifera, indicating that U. prolifera would fast reproduce during its drifting. -


图 2 研究区网格布设及验证站位
蓝色三角形为网格;红色点为验证站点;红色字体为站位名称
Fig. 2 Research area with grid layout and verification stations
The blue triangles stand for grids; the red dots are the verification sites; the red fonts are the station names
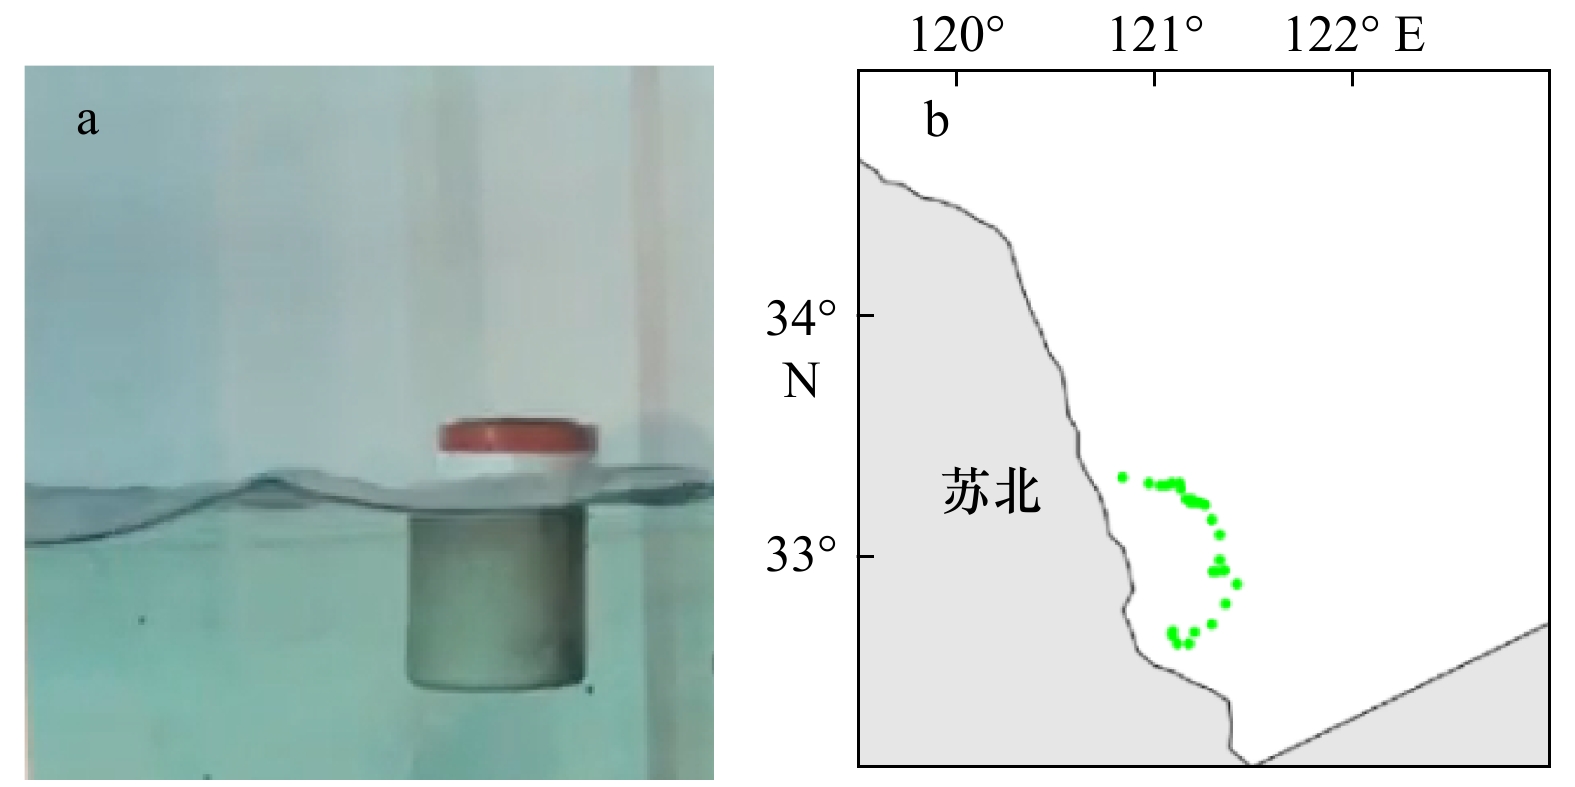
图 3 实验室水槽中漂流瓶(a)及其投放位置(b)
Fig. 3 Drifting bottles in the lab tank (a) and their the origin sites (b)


图 5 研究区2018年5月25日至7月9日每日平均风速风向
Fig. 5 The chart of daily mean wind speed and direction in the study areas during May 25 to July 9, 2018

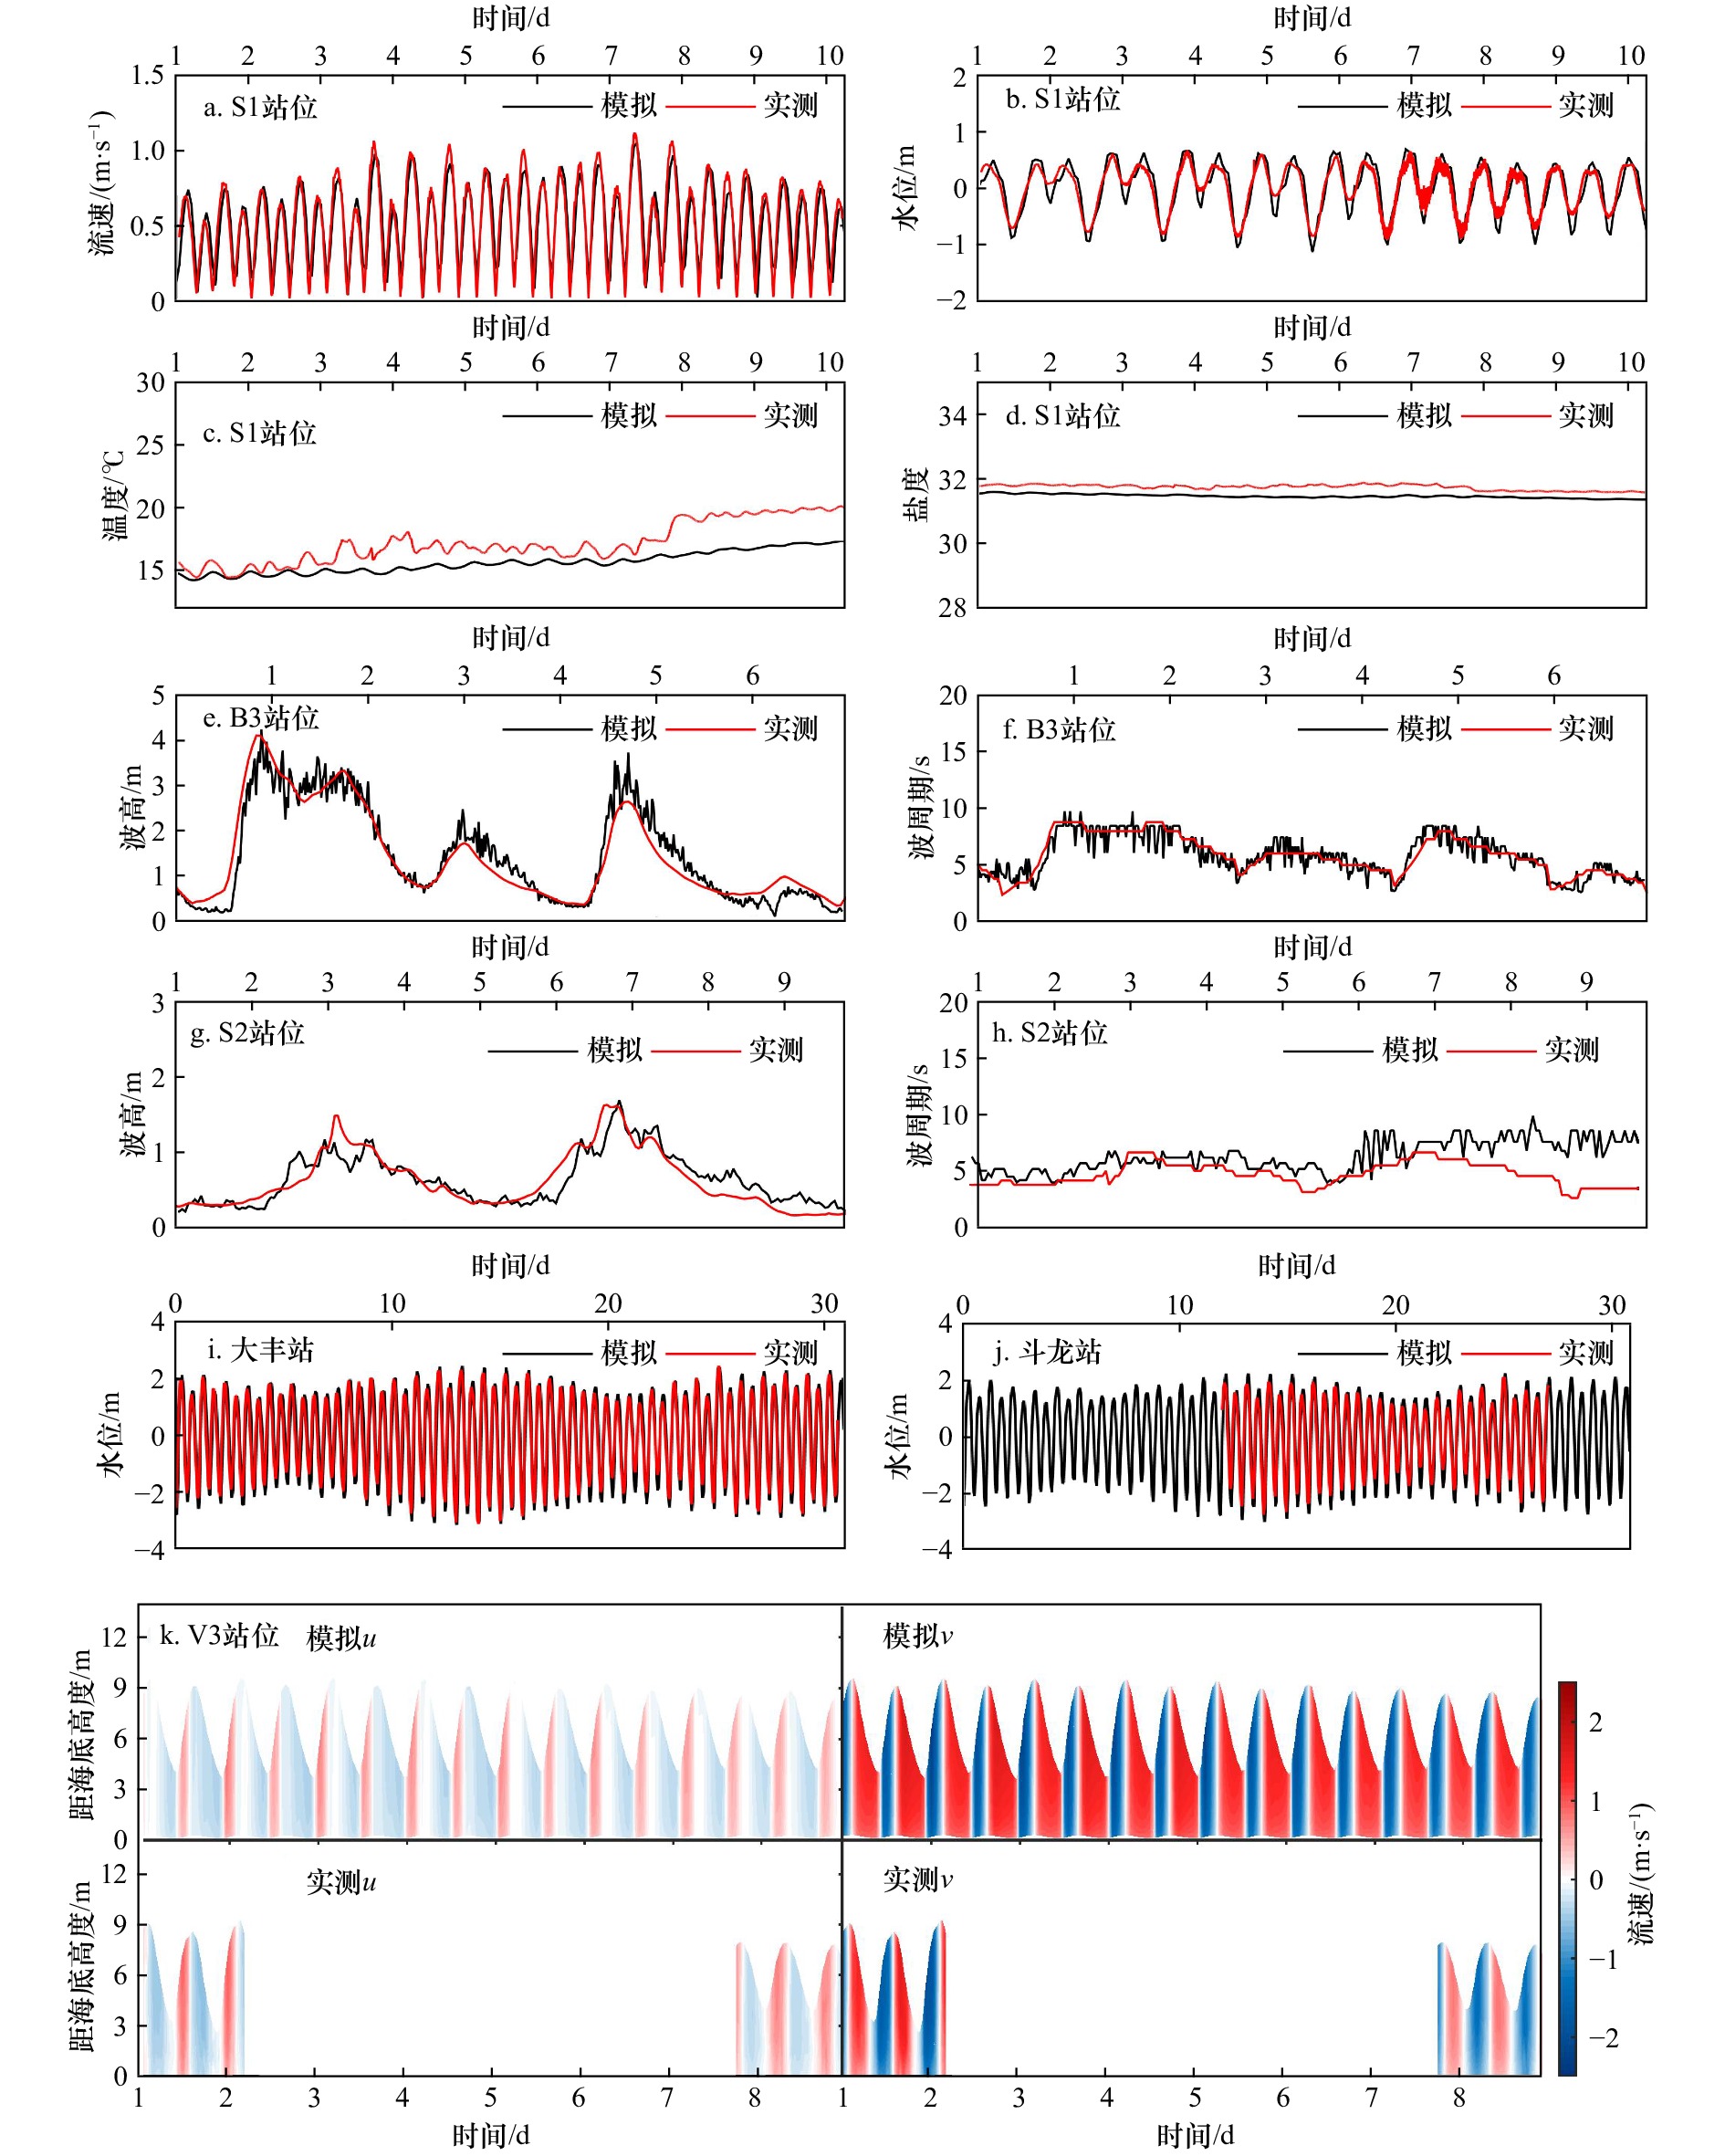
6 S1站流速、水位、温度、盐度(a−d),B3、S2站波高、波周期(e−f),大丰站、斗龙站水位(i−j),V3、V6站位流速、流向验证(k−l)模拟值与实测值对比
u、v的绝对值大小代表流速的大小;u、v的正负代表流向;正值u(红色)代表向东的方向;负值u(蓝色)代表向西的方向;正值v(红色)代表向北的方向;负值v(蓝色)代表向南的方向
6 Comparison graphes of simulated results and the in situ measured values of flow velocity, water level, temperature and salinity of S1 Station (a−d), wave heights and wave periods of B3 and S2 stations (e−f), water level of Dafeng and Doulong stations (i−j), flow velocity and direction of V3 and V6 stations (k−l)
The absolute values of u and v represent the velocity of flow; the positive and negative values of u and v represent the flow direction; positive u (red) stands for the direction to the east; minus u (blue) represents the direction to the west; positive v (red) is the direction to the north; minus v (blue) is the direction to the south

图 7 黄、渤海2月、8月表层和底层平均流场(a1、a2)、温度场(b1、b2)、盐度场(c1、c2)
Fig. 7 The average flow fields (a1, a2), temperature fields (b1, b2)and salinity fields (c1, c2)of the bottom and surface of the study area in the Yellow Sea and Bohai Sea during February and August

图 8 实验5的模拟表层流场(a)、盐度(b)、温度(c)和路径图(d−f)
Fig. 8 The sea surface flow (a), salinity (b), temperature (c) and water particles paths (d−f) from the simulation map of the fifth experiment

图 9 各流场(a1−a5)及其对应的水面粒子模拟路径(b1−b5)
Fig. 9 Flow fields (a1−a5) under various external forces and its corresponding simulated particle paths (b1−b5)

图 10 潮(a)、风(b)、温盐(c)、环流(d)、波(e)等单一外强迫影响的流场图
Fig. 10 Single external force induced flow fields of tidal (a), wind (b), temperreture and salinity (c), circulation (d), and wave (e)

图 11 漂流区(b)及其对应的漂流期表层平均温盐分布(a, c)
Fig. 11 The drifting zones (b) and their corresponding mean surface salinity, temperature (a, c) during drift period
表 1 实验外界强迫配置
Tab. 1 The outside forces configuration of experiments
实验 时间步长/s 模拟时长/h 温盐 潮 风 波浪 环流 实验1 (潮) 6 1 300 初始场+河流径流 真实 / / / 实验2 (潮+风) 6 1 300 初始场+河流径流 真实 真实 / / 实验3 (潮+风+温盐) 6 1 300 初始场+计算温盐+河流径流 真实 真实 / / 实验4 (潮+风+环流+温盐) 6 1 300 初始场+计算温盐+河流径流 真实 真实 / 真实 实验5 (潮+风+环流+温盐+波流耦合) 6 1 300 初始场+计算温盐+河流径流 真实 真实 波流耦合 真实 实验6 (纯潮) 6 1 300 无初始场 真实 / / / 注:/代表未施加外界强迫。  下载: 导出CSV
表 2 单一外界强迫下的流场、余流及其对应的模拟实验对应表
Tab. 2 Table showing single external force induced flow fields, residual flow fields and their corresponding experiments
下载: 导出CSV
表 3 浒苔漂移时段经过的不同海域对应的海表温度、盐度时段表层及浒苔最宜生长温盐表
Tab. 3 Temperature and salinity of the drift region surface average and Ulva prolirera grow most suitable
漂流区 平均温度/℃ 浒苔最适宜温度/℃ 平均盐度 浒苔最适宜盐度 A 19~21 14~27 28~31 26~32 B 18~23 14~27 29~30 26~32 C 20~24 14~27 30~31 26~32
下载: 导出CSV
-
[1] 肖洁, 张晓红, 高春蕾, 等. 温度、盐度和光照对浒苔生长和光合作用的影响[J]. 海洋学报, 2015, 35(10): 114−121.Xiao Jie, Zhang Xiaohong, Gao Chunlei, et al. Effect of temperature, salinity and irradiance on growth and photosynthesis of Ulva prolifera[J]. Haiyang Xuebao, 2015, 35(10): 114−121. [2] 王春艳, 谢宏全, 卢霞, 等. 光谱测试实验下的浒苔全生命周期生长研究[J]. 淮海工学院学报 (自然科学版), 2011, 20(4): 86−89.Wang Chunyan, Xie Hongquan, Lu Xia. Study on the lifecycle development of Enteromorpha sp. in spectral test[J]. Journal of Huaihai Institute of Technology (Natural Science Edition), 2011, 20(4): 86−89. [3] 王宗灵, 傅明珠, 肖洁, 等. 黄海浒苔绿潮研究进展[J]. 海洋学报, 2018, 40(2): 1−13.Wang Zongling, Fu Mingzhu, Xiao Jie, et al. Progress on the study of the Yellow Sea green tides caused by Ulva prolifera[J]. Haiyang Xuebao, 2018, 40(2): 1−13. [4] 范士亮, 傅明珠, 李艳, 等. 2009−2010年黄海绿潮起源与发生过程调查研究[J]. 海洋学报, 2012, 34(6): 187−194.Fan Shiliang, Fu Mingzhu, Li Yan, et al. Origin and development of Huanghai (Yellow) Sea green-tides in 2009 and 2010[J]. Haiyang Xuebao, 2012, 34(6): 187−194. [5] 吴孟泉, 郭浩, 张安定, 等. 2008年−2012年山东半岛海域浒苔时空分布特征研究[J]. 光谱学与光谱分析, 2011, 34(5): 1312−1318.Wu Mengquan, Guo Hao, Zhang Anding, et al. Research on the characteristics of Ulva. Prolifera in Shandong peninsula during 2008−2012 based on MODIS data[J]. Spectroscopy and Spectral Analysis, 2011, 34(5): 1312−1318. [6] 王萌, 郑伟, 李峰. Himawari-8气象卫星黄海浒苔动态监测[J]. 应用气象学报, 2017, 28(6): 714−723. doi: 10.11898/1001-7313.20170607Wang Meng, Zheng Wei, Li Feng. Application of himawari-8 data to Enteromorpha Prolifera dynamically monitoring in the Yellow Sea[J]. Journal of Applied Meteorological Science, 2017, 28(6): 714−723. doi: 10.11898/1001-7313.20170607 [7] Lee J H, Pang I C, Moon I J, et al. On physical factors that controlled the massive green tide occurrence along the southern coast of the Shandong Peninsula in 2008: a numerical study using a particle-tracking experiment[J]. Journal of Geophysical Research: Oceans, 2011, 116(C12): C12036. doi: 10.1029/2011JC007512 [8] 乔方利, 王关锁, 吕新刚, 等. 2008与2010年黄海浒苔漂移输运特征对比[J]. 科学通报, 2011, 56(21): 2236−2242. doi: 10.1007/s11434-011-4551-7Qiao Fangli, Wang Guansuo, Lü Xin’gang, et al. Drift characteristics of green macroalgae in the Yellow Sea in 2008 and 2010[J]. Chinese Science Bulletin, 2011, 56(21): 2236−2242. doi: 10.1007/s11434-011-4551-7 [9] 于晓杰. 南黄海西部夏季环流及其对浒苔漂移影响的数值研究[D]. 青岛: 中国海洋大学, 2011.Yu Xiaojie. Numerical study about circulation in summer and its impact on the drift of enteromorpha prolifera in the western part of south Yellow Sea[D]. Qingdao: Ocean University of China, 2011. [10] Bao Min, Guan Weibing, Yang Yang, et al. Drifting trajectories of green algae in the western Yellow Sea during the spring and summer of 2012[J]. Estuarine, Coastal and Shelf Science, 2015, 163: 9−16. doi: 10.1016/j.ecss.2015.02.009 [11] 赵昌, 尹丽萍, 王关锁, 等. 黄海浒苔漂移输运模式的建立与应用[J]. 海洋与湖沼, 2018, 49(5): 1075−1083. doi: 10.11693/hyhz20180400089Zhao Chang, Yin Liping, Wang Guansuo, et al. The modelling of Ulva prolifera transport in the Yellow Sea and its application[J]. Oceanologia et Limnologia Sinica, 2018, 49(5): 1075−1083. doi: 10.11693/hyhz20180400089 [12] 乔方利. 中国区域海洋学—物理海洋学[M]. 北京: 海洋出版社, 2012.Qiao Fangli. Regional Oceanography of China Seas—Physical Oceanography[M]. Beijing: China Ocean Press, 2012. [13] 刘志亮, 胡敦欣. 黄海夏季近岸海区环流的初步分析及其与风速的关系[J]. 海洋学报, 2009, 31(2): 1−7.Liu Zhiliang, Hu Dunxin. Preliminary study on the Huanghai Sea coastal current and its relationship with local wind in summer[J]. Haiyang Xuebao, 2009, 31(2): 1−7. [14] Wei Hao, Deng Lijing, Wang Yuheng, et al. Giant jellyfish Nemopilema nomurai gathering in the Yellow Sea—a numerical study[J]. Journal of Marine Systems, 2015, 144: 107−116. doi: 10.1016/j.jmarsys.2014.12.001 [15] 仲毅. 冷水团季节变化对南黄海泥沙输运及泥质区发育的贡献[D]. 青岛: 中国海洋大学, 2020.Zhong Yi. Suspended sediment transport and deposition mechanism in the central South Yellow Sea due to the cold water mass evolution[D]. Qingdao: Ocean University of China, 2020. [16] 石峰. 近海复杂动力条件驱动下生境季节性变化过程的数值模拟研究[D]. 大连: 大连理工大学, 2018.Shi Feng. Study on numerical simulation of eco-environmental seasonal evolution driven by complex offshore hydrodynamics[D]. Dalian: Dalian University of Technology, 2018. [17] Chen Changsheng, Beardsley R C, Cowles G, et al. An unstructured grid, finite-volume coastal ocean model: FVCOM user manual, Second edition[Z]. New Bedford: School for Marine Science and Technology, University of Massachusetts Dartmouth, 2006. [18] Qi Jianhua, Chen Changsheng, Beardsley R C, et al. An unstructured-grid finite-volume surface wave model (FVCOM-SWAVE): implementation, validations and applications[J]. Ocean Modelling, 2009, 28(1/3): 153−166. [19] Booij N, Ris R C, Holthuijsen L, et al. A third generation wave model for coastal regions: 1. Model description and validation[J]. Journal of Geophysical Research: Oceans, 1999, 104(C4): 7649−7666. doi: 10.1029/98JC02622 [20] SWAN Team. SWAN Cycle III version 40.51 Technical documentation[Z]. The Netherlands: Delft University of Technology, Faculty of Civil Engineering and Geosciences, Environmental Fluid Mechanics Section, P. O. Box 5048, 2600a GA Delft, 2006. [21] SWAN Team. SWAN Cycle III version 40.51 Technical documentation[Z]. The Netherlands: Delft University of Technology, Faculty of Civil Engineering and Geosciences, Environmental Fluid Mechanics Section, P. O. Box 5048, 2600b GA Delft, 2006. [22] 李弘毅. 基于时间序列GOCI影像的南黄海浒苔提取与浒苔爆发环境驱动因素研究[D]. 南京: 南京大学, 2018.Li Hongyi. Ulva Prolifera detection using time-series GOCI images and analysis on the key environmental factors to its growth[D]. Nanjing: Nanjing University, 2018. [23] Yuan Dongliang, Zhu Jianrong, Li Chunyan, et al. Cross-shelf circulation in the Yellow and East China Seas indicated by MODIS satellite observations[J]. Journal of Marine Systems, 2008, 70(1/2): 134−149. [24] Wang Zhiwen, Li Qian, Wang Chenghao, et al. Observations of internal tides off the coast of Shandong Peninsula, China[J]. Estuarine, Coastal and Shelf Science, 2020, 245: 106944. doi: 10.1016/j.ecss.2020.106944 [25] Zhong Yi, Qiao Lulu, Song Dehai, et al. Impact of cold water mass on suspended sediment transport in the South Yellow Sea[J]. Marine Geology, 2020, 428: 106244. doi: 10.1016/j.margeo.2020.106244 [26] Lü Xin’gang, Qiao Fangli, Xia Changshui, et al. Upwelling and surface cold patches in the Yellow Sea in summer: Effects of tidal mixing on the vertical circulation[J]. Continental Shelf Research, 2010, 30(6): 620−632. doi: 10.1016/j.csr.2009.09.002 [27] Lie H J, Cho C H, Lee S, et al. Frontal circulation and westward transversal current at the Yellow Sea entrance in winter[J]. Journal of Geophysical Research: Oceans, 2013, 118(8): 3851−3870. doi: 10.1002/jgrc.20280 [28] Wang Bin, Hirose N, Yuan Dongliang, et al. Effects of tides on the cross-isobath movement of the low-salinity plume in the western Yellow and East China Seas in winter[J]. Continental Shelf Research, 2017, 143: 28−239. doi: 10.1016/j.csr.2016.06.011 [29] Zhu Ping, Wu Hui. Origins and transports of the low-salinity coastal water in the southwestern Yellow Sea[J]. Acta Oceanologica Sinica, 2018, 37(4): 1−11. doi: 10.1007/s13131-018-1200-x [30] 张广宗, 吴孟泉, 孙晓, 等. 南黄海浒苔漂移轨迹年际变化规律及驱动因素[J]. 海洋与湖沼, 2018, 49(5): 1084−1093. doi: 10.11693/hyhz20180400093Zhang Guangzong, Wu Mengquan, Sun Xiao, et al. The inter-annual drift and driven force of Ulva prolifera bloom in the southern Yellow Sea[J]. Oceanologia et Limnologia Sinica, 2018, 49(5): 1084−1093. doi: 10.11693/hyhz20180400093 [31] Wu Hui, Shen Jian, Zhu Jianrong, et al. Characteristics of the Changjiang plume and its extension along the Jiangsu Coast[J]. Continental Shelf Research, 2014, 76: 108−123. doi: 10.1016/j.csr.2014.01.007 [32] 李尧. 中国东部近海夏季环流特征及其动力机制[D]. 青岛: 中国科学院海洋研究所, 2010.Li Yao. Structure and dynamics of ocean circulation off the east coast of China[D]. Qingdao: Institute of Oceanology, Chinese Academy of Sciences, 2010. [33] 朱平, 吴辉. 夏季长江口与苏北海域之间的水体运动及其对动力因子的响应[J]. 华东师范大学学报(自然科学版), 2018(4): 171−183.Zhu Ping, Wu Hui. Water mass transport and its controlling mechanisms between the Changjiang Estuary and Subei Coastal water during the summer[J]. Journal of East China Normal University (Natural Sciences), 2018(4): 171−183. [34] 李鸿妹. 营养盐与黄海浒苔绿潮暴发关系的探究[D]. 青岛: 中国海洋大学, 2015.Li Hongmei. Relationship between nutrients and the occurrence of macroalgal blooms in the Yellow Sea[D]. Qingdao: Ocean University of China, 2015. [35] 王宗灵, 傅明珠, 周健, 等. 黄海浒苔绿潮防灾减灾现状与早期防控展望[J]. 海洋学报, 2020, 42(8): 1−11.Wang Zongling, Fu Mingzhu, Zhou Jian, et al. Current situation of prevention and mitigation of the Yellow Sea green tide and proposing control measurements in the early stage[J]. Haiyang Xuebao, 2020, 42(8): 1−11. [36] 国家海洋局. 中国海洋环境状况公报[R]. 北京: 国家海洋局, 2010−2018.State Oceanic Administration. Bulletin of China’s marine environment[R]. Beijing: State Oceanic Administration, 2010−2018. [37] Shi Xiaoyong, Qi Mingyan, Tang Hongjie, et al. Spatial and temporal nutrient variations in the Yellow Sea and their effects on Ulva prolifera blooms[J]. Estuarine, Coastal and Shelf Science, 2015, 163: 36−43. doi: 10.1016/j.ecss.2015.02.007 -

计量
- 文章访问数: 895
- HTML全文浏览量: 145
- PDF下载量: 89
- 被引次数: 0
