

Characteristics of phosphorus speciation and distribution in suspended particulate matter in the Zhejiang coastal area
-
摘要: 磷元素是海洋基础营养盐之一,其赋存形态及分布直接影响海区的初级生产力,是海洋生物地球化学循环的重要驱动力。但大河河口与近海等重要的水生关键带水动力循环过程复杂,导致悬浮颗粒物(SPM )中磷元素的赋存形态和分布特征变化多端,亟须深入研究。根据2016年春季(4−5月)、夏季(7月)和秋季(9−10月)对浙江近岸海域的调查结果,本研究分析了浙江近岸海域SPM中总磷(TPP)、无机磷(PIP)和有机磷(POP)的含量水平、空间分布特征和影响因素。结果表明,浙江近岸海域SPM中TPP含量范围为0.13~66.13 μmol/L,均值为3.35 μmol/L;PIP含量范围为0.03~34.19 μmol/L,均值为1.97 μmol/L;POP含量范围为0.06~31.94 μmol/L,均值为1.39 μmol/L。PIP是浙江近岸海域水体中TPP的主要存在形式,占52.3%。春季浙江近岸海域表层TPP含量占总磷(TP)含量的19.3%~97.7%。春、秋季的SPM中,TPP、PIP和POP含量空间分布相似,均呈现由内湾向外海逐渐降低的变化趋势。PIP、POP与SPM呈显著的正相关性,表现出高SPM含量的海区有着较高的颗粒态磷含量,说明其受陆源输入的影响。春季盐度大于28且SPM含量小于20 mg/L的外侧远海海域,POP与Chl a的相关系数和斜率均明显高于PIP与Chl a的相关系数和斜率,说明该区域浮游植物是POP的主要贡献来源。Abstract: Speciation and distribution of phosphorus have a direct effect on the primary production and marine biogeochemistry. However, the complex current dynamics in aquatic critical zones such as large river delta and coastal area result in variable characteristics of the phosphorus speciation and distribution that need in depth study. The content, distribution and influence factors of total particulate phosphorus (TPP), particulate inorganic phosphorus (PIP) and particulate organic phosphorus (POP) in the suspended particulate matter (SPM) in the Zhejiang coastal area off Changjiang Estuary were discussed based on the investigation from April to May (spring), July (summer) and September to October (autumn) in 2016. The results showed that the content ranged from 0.13 μmol/L to 66.13 μmol/L, with an average of 3.35 μmol/L for TPP, from 0.03 μmol/L to 34.19 μmol/L with an average of 1.97 μmol/L for PIP, and ranged from 0.06 μmol/L to 31.94 μmol/L with an average of 1.39 μmol/L for POP. PIP was the dominant (52.3%) form of particulate phosphorus in the Zhejiang coastal areas. The percentage of TPP in total phosphorus ranged from 19.3% to 97.7% in spring for surface samples. The spatial distribution patterns of TPP, PIP and POP contents were similar in spring and autumn, decreasing from the inner bay to offshore areas. The content of TPP was higher in areas where the SPM was higher while PIP and POP showed a positive correlation with SPM, indicating an influence from terrestrial input. The regression coefficient and slope between POP and chlorophyll a were significantly higher than that of PIP in the area with salinity above 28 and SPM below 20 mg/L in spring, indicating contributions from phytoplankton to POP accumulation.
-
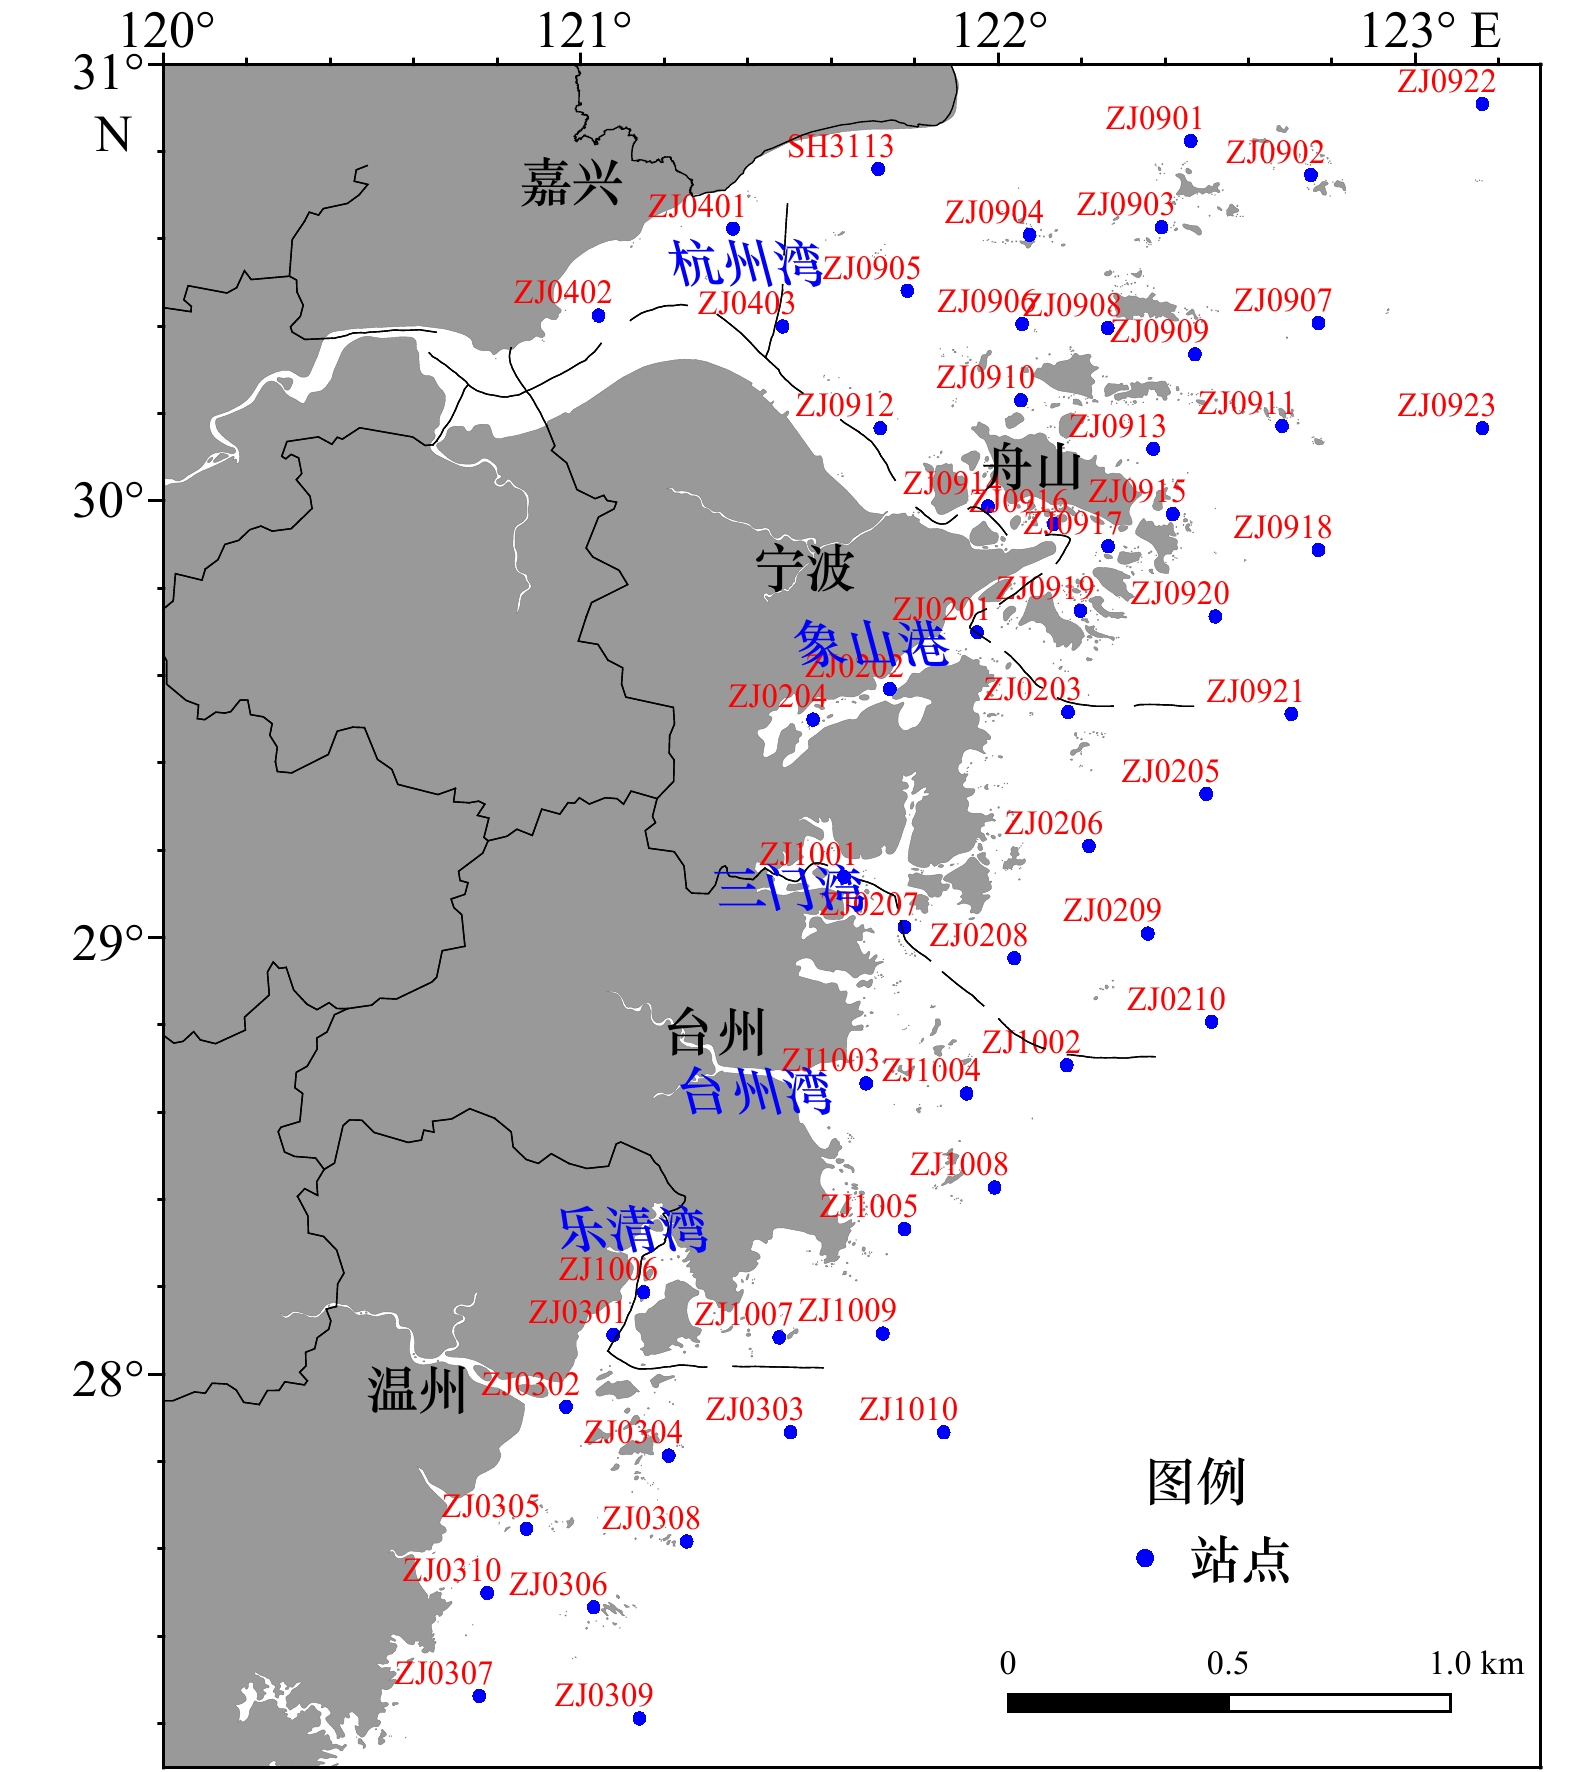
图 1 浙江近岸海域采样站位分布
Fig. 1 Distribution of sampling stations of the Zhejiang coastal area

图 4 浙江近岸海域春季SPM中TPP、PIP和POP空间分布
Fig. 4 Spatial distribution of TPP, PIP and POP in spring in the Zhejiang coastal area

图 5 浙江近岸海域夏季SPM中TPP、PIP和POP空间分布
Fig. 5 Spatial distribution of TPP, PIP and POP in summer in the Zhejiang coastal area
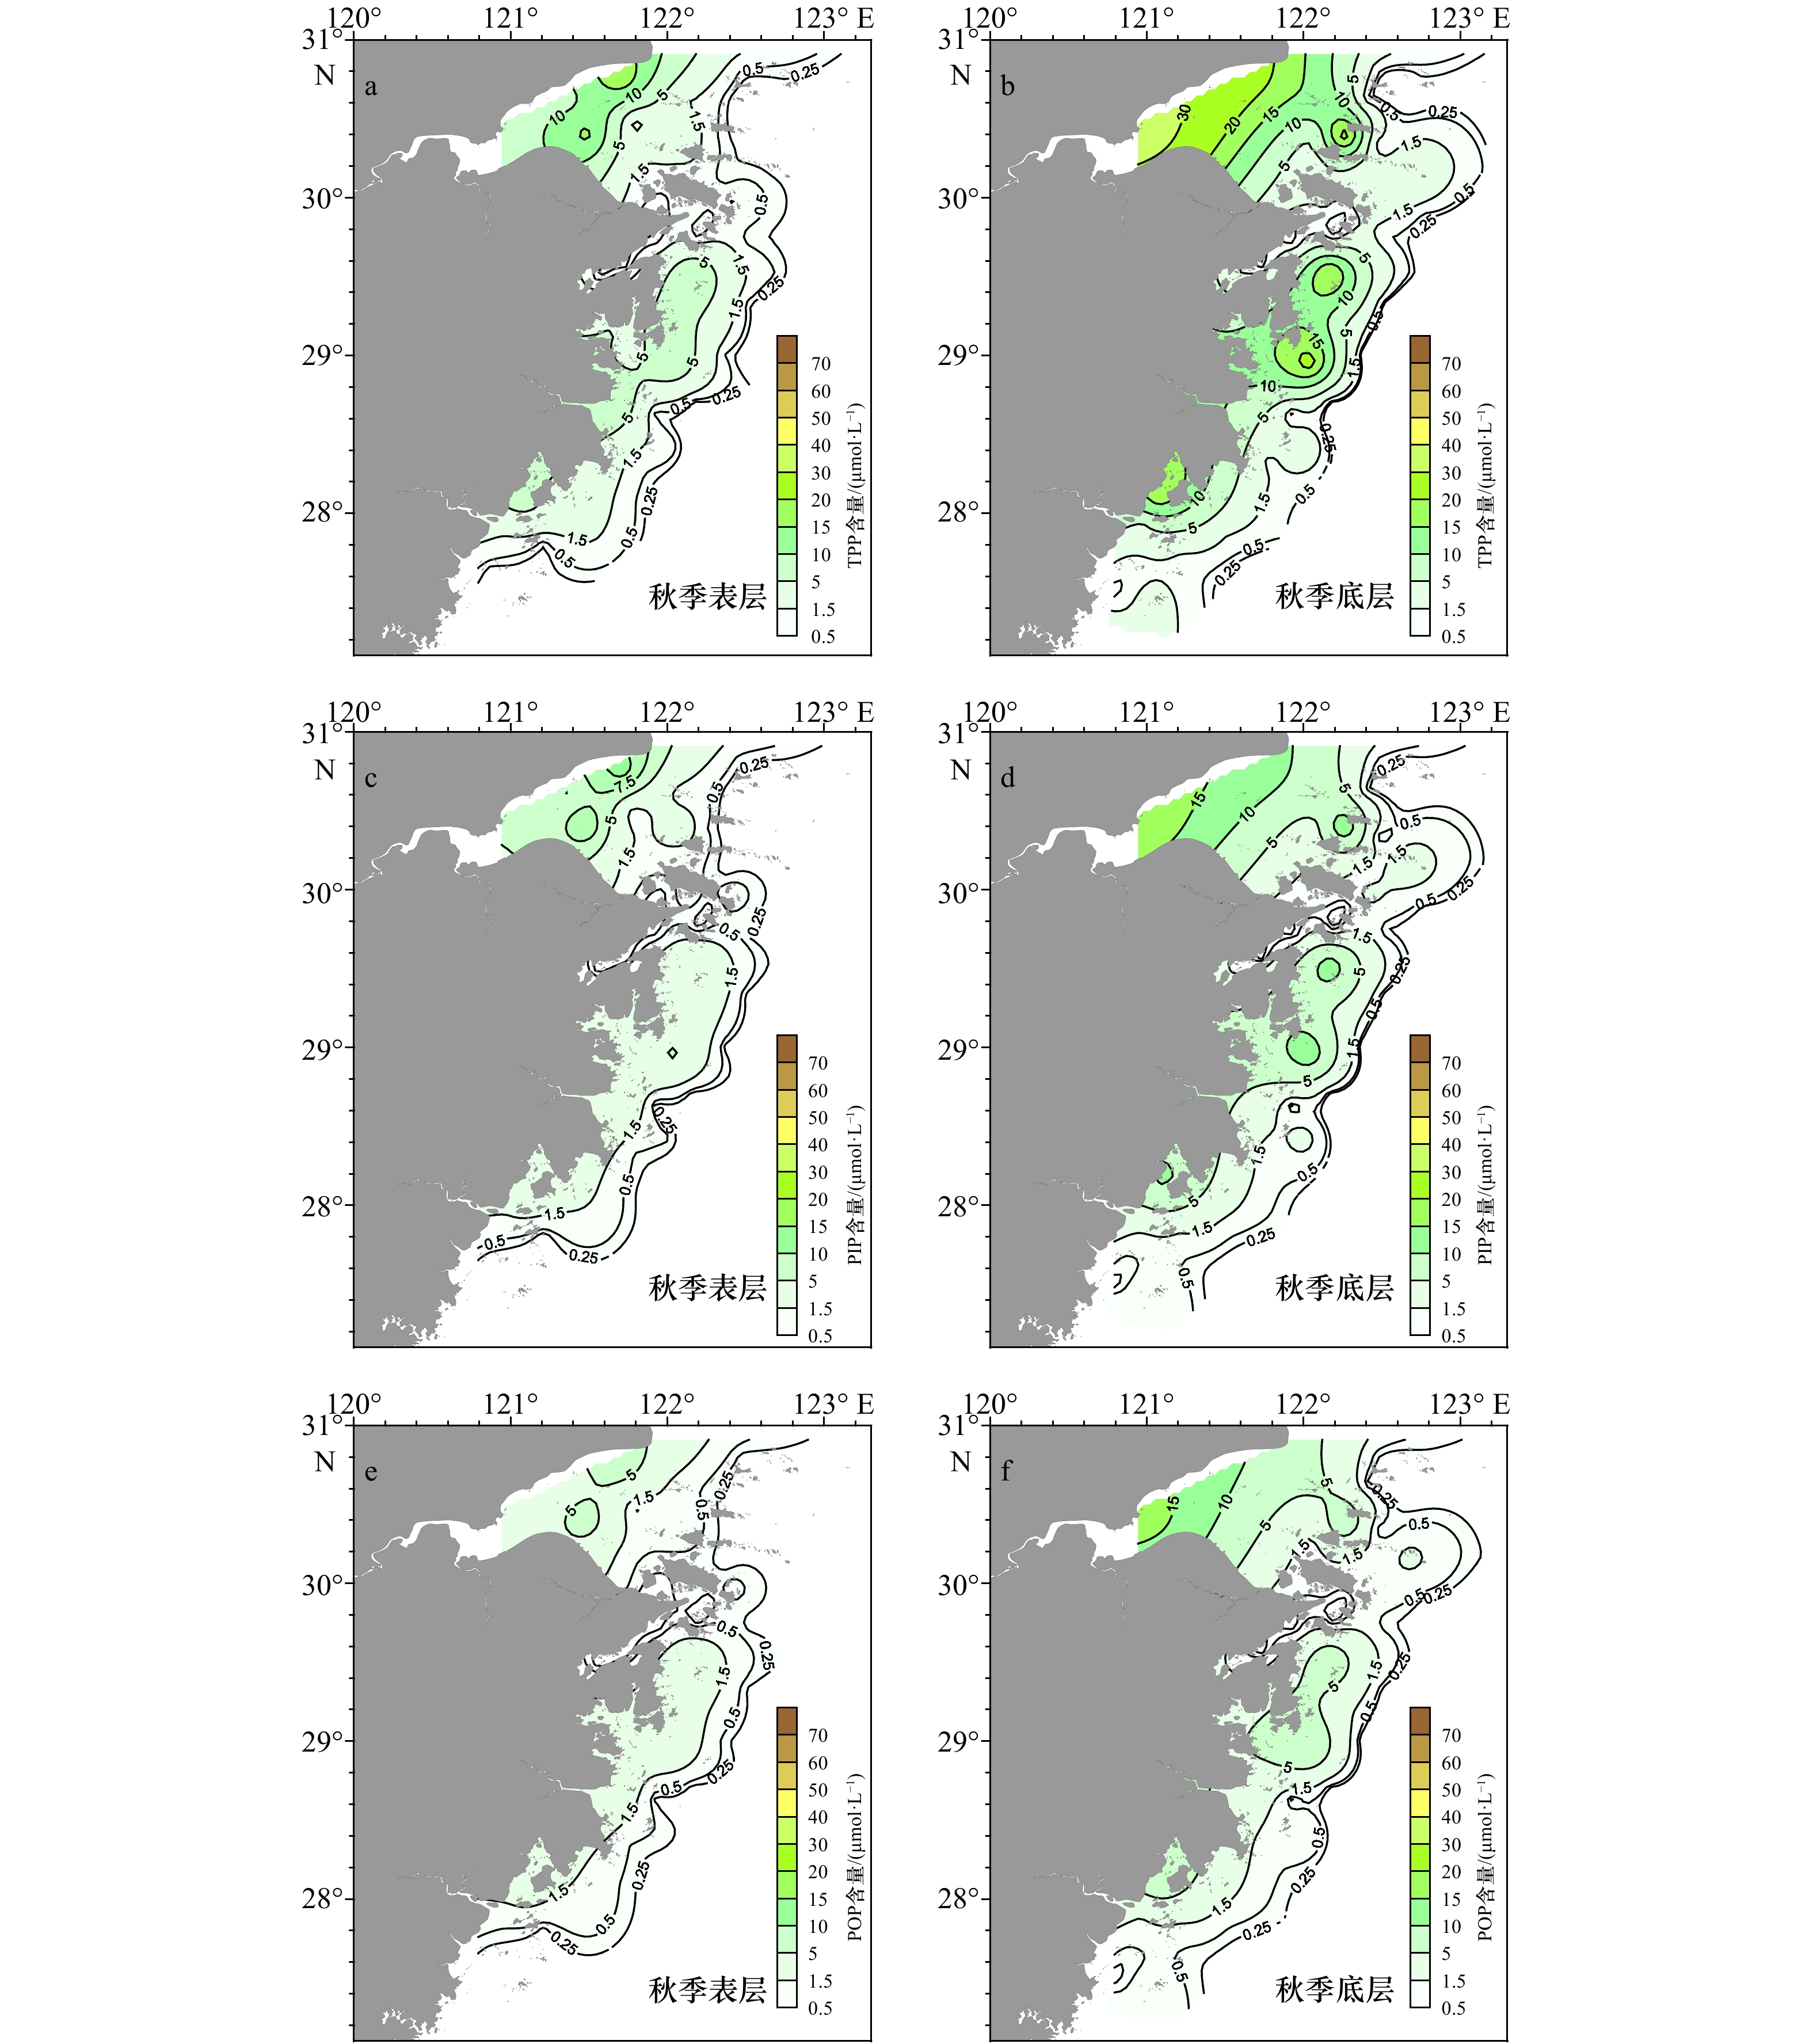
图 6 浙江近岸海域秋季SPM中TPP、PIP和POP空间分布
Fig. 6 Spatial distribution of TPP, PIP and POP in autumn in the Zhejiang coastal area
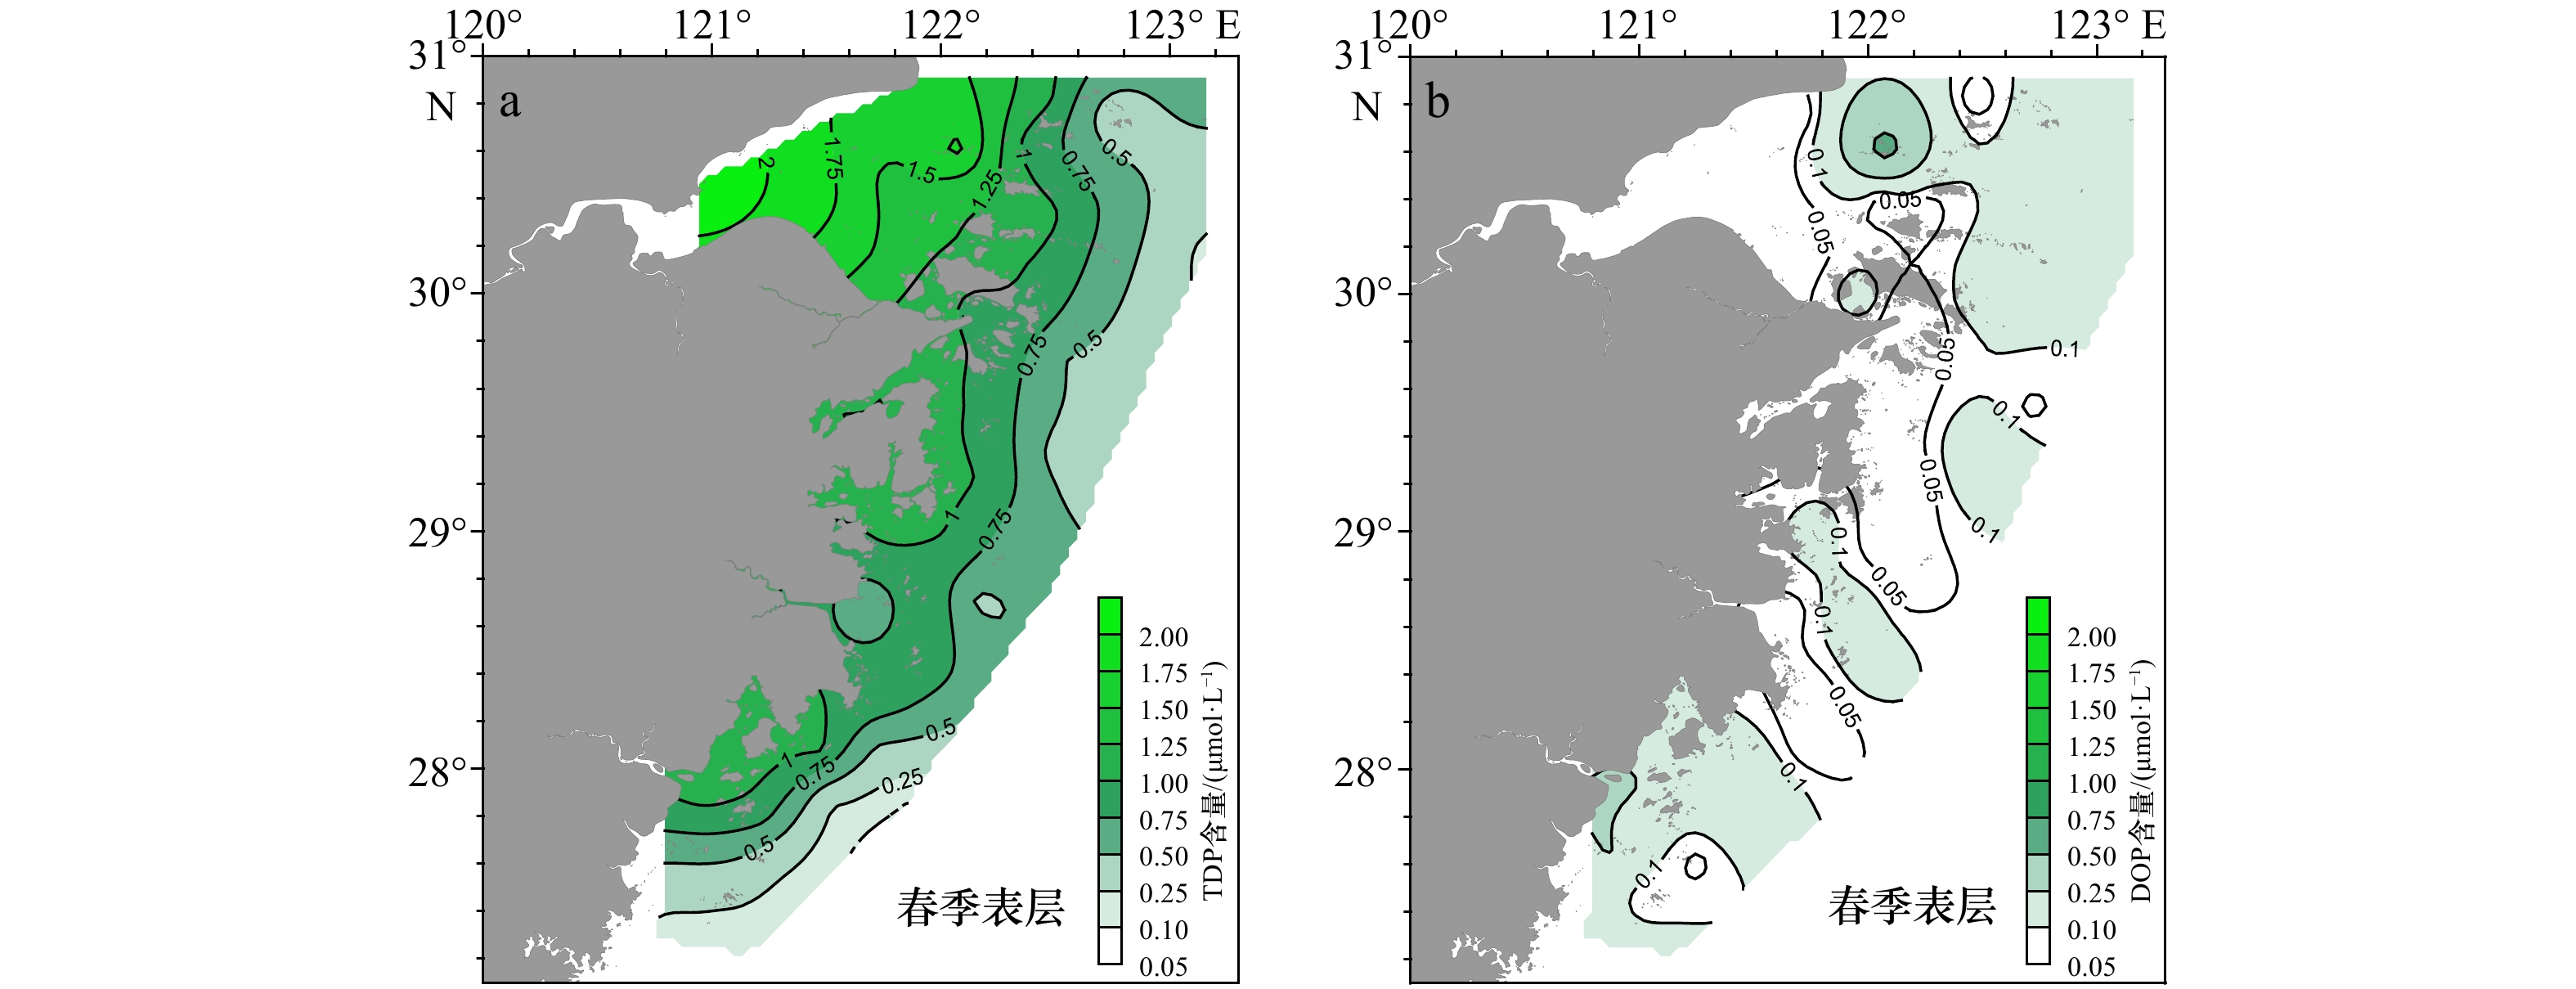
图 8 浙江近岸海域春季表层TDP (a) 和DOP (b) 空间分布特征
Fig. 8 Spatial distribution of TDP (a) and DOP (b) in spring in the Zhejiang coastal area
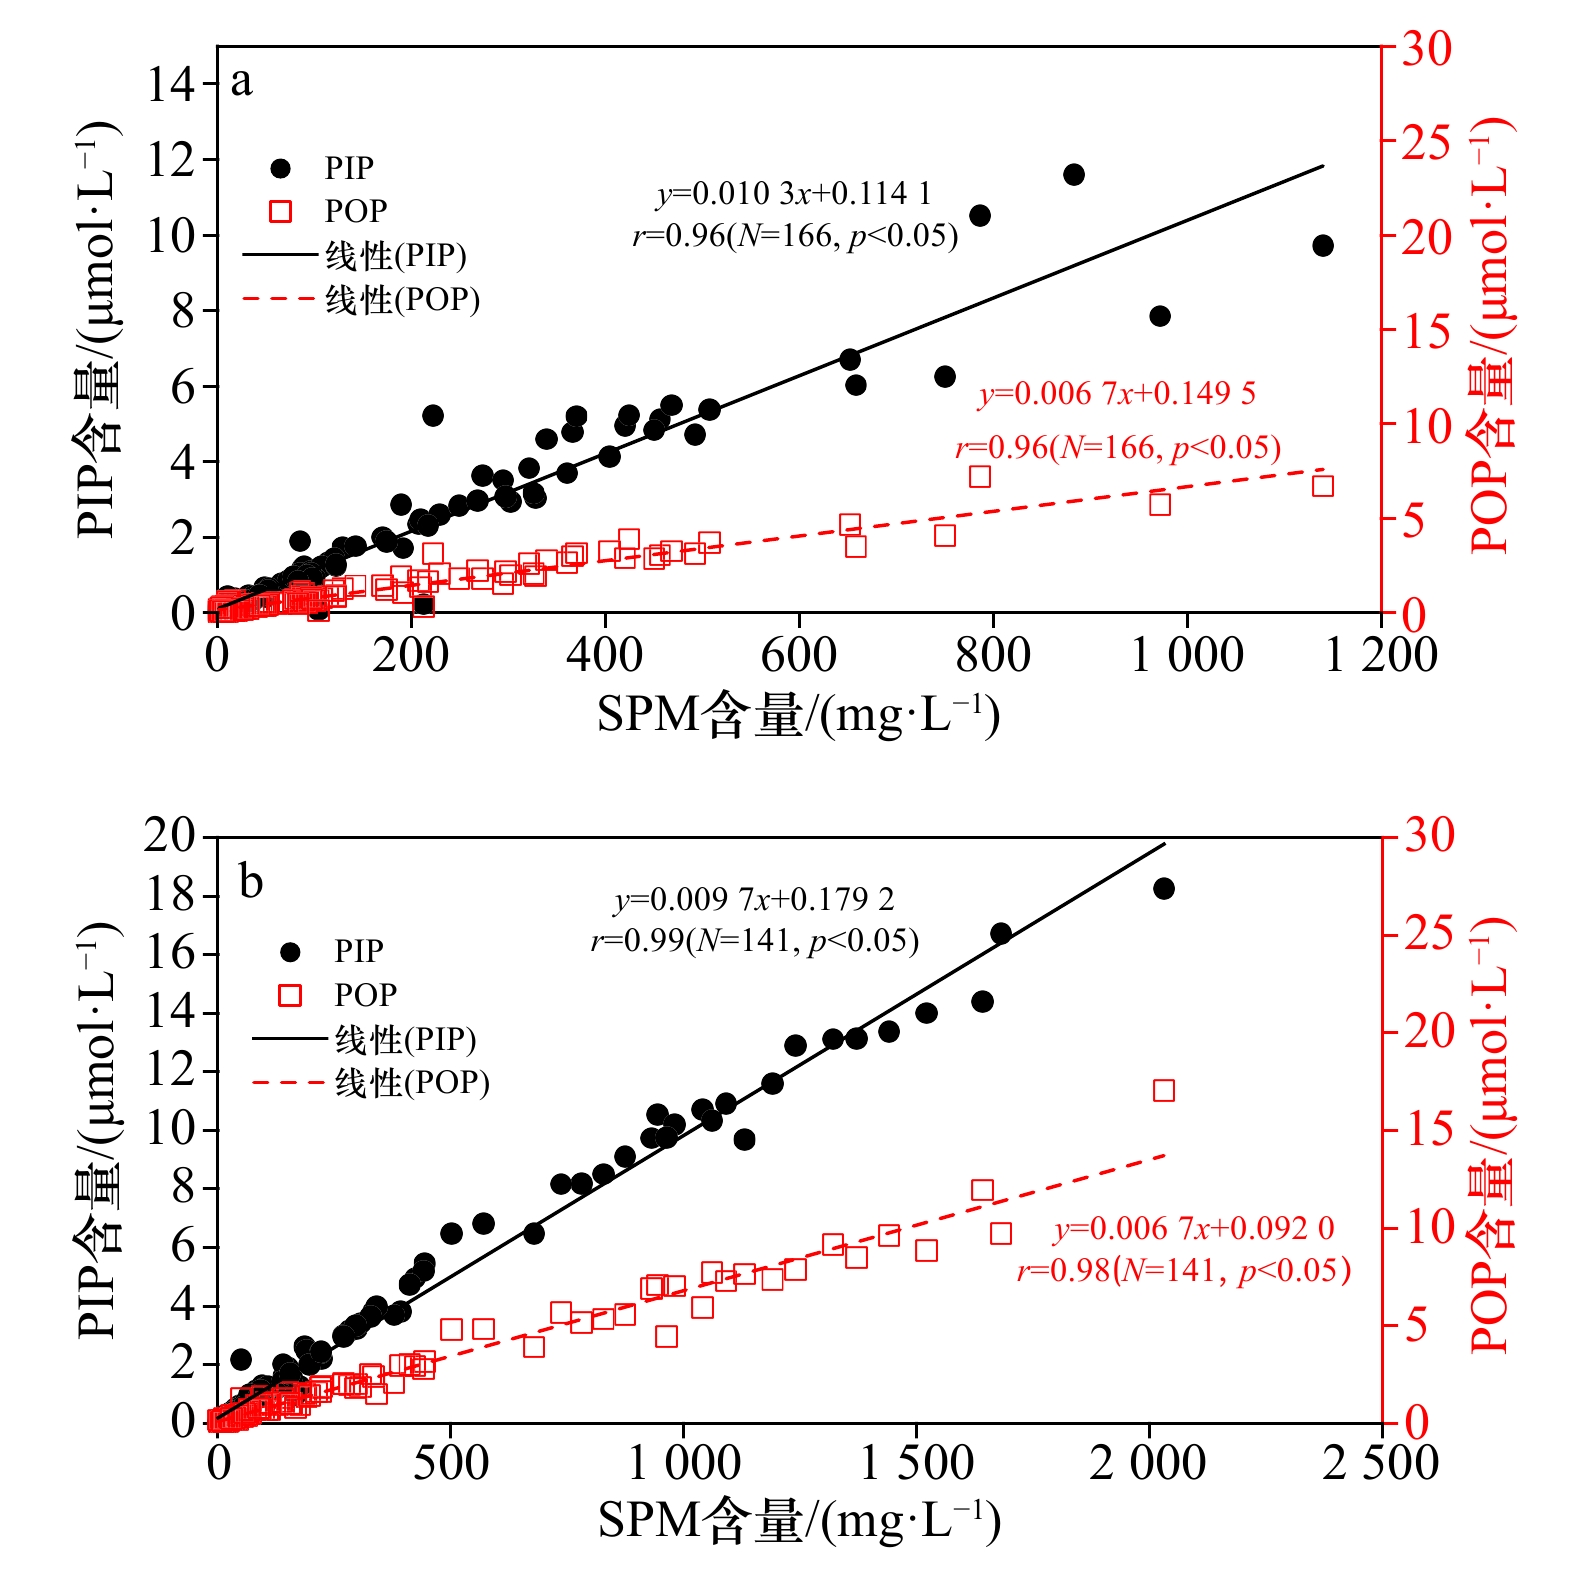
图 9 浙江近岸表层(a)、底层(b)海域PIP、POP与SPM关系
Fig. 9 Correlation between PIP, POP and SPM in surface (a) and bottom layers (b) of the Zhejiang coastal area

图 10 浙江近岸海域春季(a)、秋季(b)表层Chl a与POP和PIP关系
Fig. 10 Correlation between Chl a and POP, PIP at surface layer in the Zhejiang coastal area in spring (a), and autumn (b)
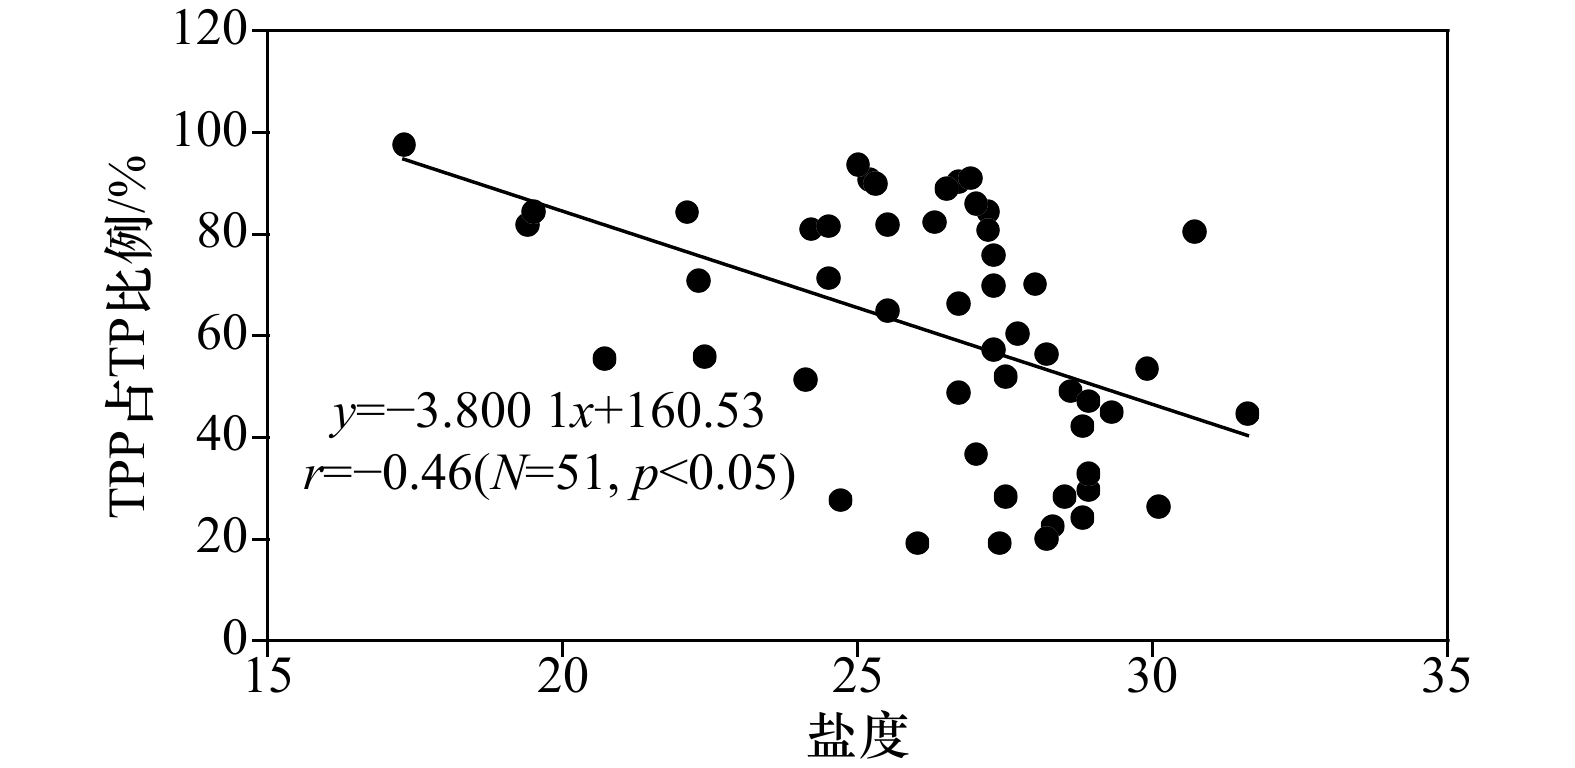
图 11 浙江近岸海域春季表层TPP在TP中所占比例与盐度的关系
Fig. 11 Correlation between proportion of TPP in TP and salinity at surface layer in spring in the Zhejiang coastal area

图 12 浙江近岸表层(a)、底层(b)海域磷的赋存形态与环境因子的PCA分析图
Fig. 12 PCA of phosphorus speciation and environmental parameters in surface (a) and bottom (b) layers of the Zhejiang coastal area
表 1 浙江近岸海域TPP中不同形态磷的体积含量水平和相对含量
Tab. 1 Content and proportion of PIP and POP in TPP in the Zhejiang coastal area
季节 层次 PIP含量/(μmol·L−1) PIP/TPP(%) POP含量/(μmol·L−1) POP/TPP(%) TPP含量/(μmol·L−1) 测量范围 均值 范围 均值 测量范围 均值 范围 均值 测量范围 均值 春季 表层 0.03~12.21 2.19 29.1~64.2 53.5 0.06~12.40 1.58 35.8~70.9 46.5 0.13~24.61 3.77 10 m层 0.07~7.32 0.87 34.1~63.2 48.8 0.06~4.29 0.58 36.8~65.9 51.2 0.13~11.61 1.45 底层 0.10~34.19 5.13 46.1~68.7 58.1 0.06~31.94 3.55 31.3~53.9 41.9 0.16~66.13 8.68 全部 0.03~34.19 3.22 29.1~68.7 54.7 0.06~31.94 2.26 31.3~70.9 45.3 0.13~66.13 5.45 夏季 表层 0.07~5.23 0.58 19.0~66.6 48.7 0.10~3.94 0.48 33.4~81.0 51.3 0.16~9.16 1.06 10 m层 0.03~1.29 0.26 30.4~60.3 45.0 0.06~0.84 0.23 40.0~69.6 55.0 0.13~2.16 0.48 底层 0.07~8.52 1.32 43.0~72.6 56.2 0.10~5.35 0.84 27.4~57.0 43.8 0.16~13.87 2.16 全部 0.03~8.52 0.84 19.0~72.6 51.1 0.06~5.35 0.58 27.4~81.0 48.9 0.13~13.87 1.42 秋季 表层 0.03~11.61 1.42 30.8~69.0 50.5 0.10~7.52 1.00 31.0~69.2 49.5 0.13~19.13 2.42 10 m层 0.07~1.00 0.23 31.3~63.2 43.3 0.06~0.68 0.23 36.8~68.7 56.7 0.13~1.61 0.45 底层 0.07~18.26 2.84 26.5~64.7 54.1 0.10~17.06 2.10 35.3~73.5 45.9 0.19~35.48 4.90 全部 0.03~18.26 1.81 26.5~69.0 50.9 0.06~17.06 1.32 31.0~73.5 49.1 0.13~35.48 3.13 总计 表层 0.03~12.21 1.39 19.0~69.0 50.8 0.06~12.40 1.00 31.0~81.0 49.2 0.13~24.61 2.39 10 m层 0.03~7.32 0.45 30.4~63.2 45.8 0.06~4.29 0.35 36.8~69.6 54.2 0.13~11.61 0.81 底层 0.07~34.19 3.16 26.5~72.6 56.2 0.06~31.94 2.19 27.4~73.5 43.8 0.16~66.13 5.35 全部 0.03~34.19 1.97 19.0~72.6 52.3 0.06~31.94 1.39 27.4~81.0 47.7 0.13~66.13 3.35  下载: 导出CSV
表 2 浙江近岸海域PIP、POP 和TPP含量与其他海域的比较
Tab. 2 Comparison of PIP, POP and TPP contents in the Zhejiang coastal area and other waters
区域 时间 PIP含量/(μmol·L−1) POP含量/(μmol·L−1) TPP含量/(μmol·L−1) 参考文献 淡水河 − − − 0.28~9.47 [25] 比斯开湾 − − 0.02~0.08 − [26] 东京湾 − − − 1.03~2.18 [27] 九龙河口 − − − 0.35~1.45 [28] 北太平洋 春季 − 0.17 − [29] 夏季 − 0.16 − [29] 秋季 − 0.20 − [29] 冬季 − 0.16 − [29] 南太平洋 1995−1996年 0.01 0.03 0.01~0.03 [30] 万泉河口 2006年12月 0.22~0.57(0.42) 0.23~0.53(0.33) − [31] 2007年8月 0.07~0.78(0.47) 0.14~0.50(0.29) − [31] 2008年8月 0.06~1.00(0.42) 0.10~1.22(0.47) − [31] 2009年4月 0.06~1.74(0.82) 0.10~1.83(0.73) − [31] 2009年8月 0.06~1.27(0.40) 0.06~0.87(0.38) − [31] 胶州湾 0.01~1.49(0.33) 0.01~1.83(0.32) 0.07~2.09(0.65) [32] 长江口跨锋面区 2006年7−8月 0.01~27.16 0.04~12.38 0.06~39.54 [12] 2006年12月−2007年2月 0.03~10.31 0.03~3.69 0.08~11.55 [12] 2007年4−5月 0.02~5.58 0.03~3.23 0.05~8.69 [12] 2007年10−12月 0.02~17.77 0.05~3.69 0.08~26.31 [12] 浙江近岸海域 2016年4−5月 0.03~36.13(3.48) 0.06~31.94(2.45) 0.13~66.13(5.90) 本研究 2016年7月 0.03~8.52(0.84) 0.065~5.35(0.58) 0.13~13.87(1.42) 本研究 2016年9−10月 0.03~18.26(1.81) 0.06~17.06(1.32) 0.13~35.48(3.13) 本研究 注:−为文中未提及,括号内为均值。
下载: 导出CSV
表 3 浙江近岸海域PIP、POP含量与盐度间的相关系数(r)
Tab. 3 Correlation coefficients (r) between PIP, POP contents and salinity in the Zhejiang coastal area
季节 层次 r(PIP含量与盐度) r(POP含量与盐度) 春季 表层 −0.61 −0.63 底层 −0.83 −0.80 夏季 表层 −0.40 −0.44 底层 −0.60 −0.60 秋季 表层 −0.59 −0.57 底层 −0.66 −0.67 注:显著性水平p<0.05。
下载: 导出CSV
-
[1] Bricker S B, Longstaff B, Dennison W, et al. Effects of nutrient enrichment in the nation’s estuaries: a decade of change[J]. Harmful Algae, 2008, 8(1): 21−32. [2] 晏维金. 人类活动影响下营养盐向河口/近海的输出和模型研究[J]. 地理研究, 2006, 25(5): 825−835. doi: 10.3321/j.issn:1000-0585.2006.05.008Yan Weijin. Summary of human activities on global nutrient export from watersheds to estuaries and coastal water: biogeochemical cycles and modeling[J]. Geographical Research, 2006, 25(5): 825−835. doi: 10.3321/j.issn:1000-0585.2006.05.008 [3] Falco S, Niencheski L F, Rodilla M, et al. Nutrient flux and budget in the Ebro estuary[J]. Estuarine, Coastal and Shelf Science, 2010, 87(1): 92−102. [4] Rabouille C, Conley D J, Dai M H, et al. Comparison of hypoxia among four river-dominated ocean margins: The Changjiang (Yangtze), Mississippi, Pearl, and Rhône rivers[J]. Continental Shelf Research, 2008, 28(12): 1527−1537. [5] 孟伟, 于涛, 郑丙辉, 等. 黄河流域氮磷营养盐动态特征及主要影响因素[J]. 环境科学学报, 2007, 27(12): 2046−2051. doi: 10.3321/j.issn:0253-2468.2007.12.019Meng Wei, Yu Tao, Zheng Binghui, et al. Variation and influence factors of nitrogen and phosphorus transportation by the Yellow River[J]. Acta Scientiae Circumstantiae, 2007, 27(12): 2046−2051. doi: 10.3321/j.issn:0253-2468.2007.12.019 [6] 沈志良. 长江干流营养盐通量的初步研究[J]. 海洋与湖沼, 1997, 28(5): 522−528. doi: 10.3321/j.issn:0029-814X.1997.05.011Shen Zhiliang. Preliminary study on the Changjiang River mainstream nutrients fluxes[J]. Oceanologia et Limnologia Sinica, 1997, 28(5): 522−528. doi: 10.3321/j.issn:0029-814X.1997.05.011 [7] Zhang J, Liu S M, Ren J L, et al. Nutrient gradients from the eutrophic Changjiang (Yangtze River) Estuary to the oligotrophic Kuroshio waters and re-evaluation of budgets for the East China Sea Shelf[J]. Progress in Oceanography, 2007, 74(4): 449−478. [8] Shen Zhiliang, Zhou Shuqing, Pei Shaofeng. Transfer and transport of phosphorus and silica in the turbidity maximum zone of the Changjiang estuary[J]. Estuarine, Coastal and Shelf Science, 2008, 78(3): 481−492. [9] Zhang Jing. Nutrient elements in large Chinese estuaries[J]. Continental Shelf Research, 1996, 16(8): 1023−1045. [10] Meybeck M. Carbon, nitrogen, and phosphorus transport by world rivers[J]. American Journal of Science, 1982, 282(4): 401−450. [11] Conley D J, Smith W M, Cornwell J C, et al. Transformation of particle-bound phosphorus at the land-sea interface[J]. Estuarine, Coastal and Shelf Science, 1995, 40(2): 161−176. [12] 刘希真, 李宏亮, 陈建芳, 等. 长江口跨越锋面颗粒磷季节分布变化特征及影响因素[J]. 海洋学研究, 2011, 29(3): 88−98. doi: 10.3969/j.issn.1001-909X.2011.03.011Liu Xizhen, Li Hongliang, Chen Jianfang, et al. The seasonal variation and influence factors of particulate phosphorus across the frontal surface in Changjiang River Estuary[J]. Journal of Marine Sciences, 2011, 29(3): 88−98. doi: 10.3969/j.issn.1001-909X.2011.03.011 [13] Lebo M E, Sharp J H. Modeling phosphorus cycling in a well-mixed coastal plain estuary[J]. Estuarine, Coastal and Shelf Science, 1992, 35(3): 235−252. [14] Liu Sumei, Qi Xiaohong, Li Xiaona, et al. Nutrient dynamics from the Changjiang (Yangtze River) estuary to the East China Sea[J]. Journal of Marine Systems, 2016, 154: 15−27. [15] Paytan A, McLaughlin K. The oceanic phosphorus cycle[J]. Chemical Reviews, 2007, 107(2): 563−576. [16] Sundareshwar P V, Morris J T. Phosphorus sorption characteristics of intertidal marsh sediments along an estuarine salinity gradient[J]. Limnology and Oceanography, 1999, 44(7): 1693−1701. [17] Van Bennekom A J, Salomons W. Pathways of nutrients and organic matter from land to ocean through rivers[M]//River Inputs to Ocean Systems. UNSCO-UNEP, 1980: 33−51. [18] Friedl G, Dinkel C, Wehrli B. Benthic fluxes of nutrients in the northwestern Black Sea[J]. Marine Chemistry, 1998, 62(1/2): 77−88. [19] Glibert P M, Burkholder J M, Kana T M. Recent insights about relationships between nutrient availability, forms, and stoichiometry, and the distribution, ecophysiology, and food web effects of pelagic and benthic Prorocentrum species[J]. Harmful Algae, 2012, 14: 231−259. [20] Wei Hao, He Yunchang, Li Qingji, et al. Summer hypoxia adjacent to the Changjiang Estuary[J]. Journal of Marine Systems, 2007, 67(3/4): 292−303. [21] Li Maotian, Xu Kaiqin, Watanabe M, et al. Long-term variations in dissolved silicate, nitrogen, and phosphorus flux from the Yangtze River into the East China Sea and impacts on estuarine ecosystem[J]. Estuarine, Coastal and Shelf Science, 2007, 71(1/2): 3−12. [22] Yu Yu, Song Jinming, Li Xuegang, et al. Distribution, sources and budgets of particulate phosphorus and nitrogen in the East China Sea[J]. Continental Shelf Research, 2012, 43: 142−155. [23] 张健, 施青松, 邬翱宇, 等. 杭州湾丰水期主要污染因子的分布变化及成因[J]. 东海海洋, 2002, 20(4): 35−41.Zhang Jian, Shi Qingsong, Wu Aoyu, et al. Distribution characteristic analysis of mainpollution factor in rainy season in the Hangzhou Bay[J]. Donghai Marine Science, 2002, 20(4): 35−41. [24] 曹沛奎, 严肃庄. 长江口悬沙锋及其对物质输移的影响[J]. 华东师范大学学报(自然科学版), 1996(1): 85−94.Cao Peikui, Yan Suzhuang. Suspended sediments front and its impacts on the materials transport of the Changjiang Estuary[J]. Journal of East China Normal University(Natural Science), 1996(1): 85−94. [25] Fang T H. Partitioning and behaviour of different forms of phosphorus in the Tanshui Estuary and one of its tributaries, Northern Taiwan[J]. Estuarine, Coastal and Shelf Science, 2000, 50(5): 689−701. [26] Herbland A, Delmas D, Laborde P, et al. Phytoplankton spring bloom of the Gironde plume waters in the Bay of Biscay: early phosphorus limitation and food-web consequences[J]. Oceanologica Acta, 1998, 21(2): 279−291. [27] Suzumura M, Ingall E D. Concentrations of lipid phosphorus and its abundance in dissolved and particulate organic phosphorus in coastal seawater[J]. Marine Chemistry, 2001, 75(1/2): 141−149. [28] 洪华生, 郭劳动, 陈敬虔, 等. 九龙江河口颗粒磷的分布特征[J]. 厦门大学学报(自然科学版), 1989, 28(1): 74−78.Hong Huasheng, Guo Laodong, Chen Jingqian, et al. Characteristics of particulate phosphate at Jiulong River Estuary and Xiamen Harbour[J]. Journal of Xiamen University(Nature Science), 1989, 28(1): 74−78. [29] Hebel D V, Karl D M. Seasonal, interannual and decadal variations in particulate matter concentrations and composition in the subtropical North Pacific Ocean[J]. Deep-Sea Research Part II: Topical Studies in Oceanography, 2001, 48(8/9): 1669−1695. [30] Loh A N, Bauer J E. Distribution, partitioning and fluxes of dissolved and particulate organic C, N and P in the eastern North Pacific and Southern Oceans[J]. Deep-Sea Research Part I: Oceanographic Research Papers, 2000, 47(12): 2287−2316. [31] 李延伟, 刘素美, 朱卓毅, 等. 万泉河口悬浮颗粒态磷和硅的分布特征及收支估算[J]. 海洋学报, 2011, 33(6): 180−188.Li Yanwei, Liu Sumei, Zhu Zhuoyi, et al. Distribution and budget of particulate phosphorus and silica in Wanquanhe River Estuary[J]. Haiyang Xuebao, 2011, 33(6): 180−188. [32] Yuan Huamao, Song Jinming, Li Ning, et al. Spatial distributions and seasonal variations of particulate phosphorus in the Jiaozhou Bay in North China[J]. Acta Oceanologica Sinica, 2009, 28(1): 99−108. [33] 刘际弟, 陈建芳. 海水悬浮颗粒物中不同形态磷的测定[J]. 海洋学研究, 2013, 31(1): 72−77. doi: 10.3969/j.issn.1001-909X.2013.01.009Liu Jidi, Chen Jianfang. Determination of different forms of phosphorus in seawater suspended particulate matter[J]. Journal of Marine Sciences, 2013, 31(1): 72−77. doi: 10.3969/j.issn.1001-909X.2013.01.009 [34] 毛汉礼, 甘子钧, 蓝淑芳. 长江冲淡水及其混合问题的初步探讨[J]. 海洋与湖沼, 1963, 5(3): 183−206.Mao Hanli, Gan Zijun, Lan Shufang. A preliminary study of the Yangtze diluted water and its mixing processes[J]. Oceanologia et Limnologia Sinica, 1963, 5(3): 183−206. [35] Suzumura M, Kokubun H, Arata N. Distribution and characteristics of suspended particulate matter in a heavily eutrophic estuary, Tokyo Bay, Japan[J]. Marine Pollution Bulletin, 2004, 49(5/6): 496−503. [36] Froelich P N. Kinetic control of dissolved phosphate in natural rivers and estuaries: a primer on the phosphate buffer mechanism[J]. Limnology and Oceanography, 1988, 33(4part2): 649−668. [37] Lebo M E. Particle-bound phosphorus along an urbanized coastal plain estuary[J]. Marine Chemistry, 1991, 34(3/4): 225−246. [38] Ruttenberg K C. Development of a sequential extraction method for different forms of phosphorus in marine sediments[J]. Limnology and Oceanography, 1992, 37(7): 1460−1482. [39] Penn M R, Auer M T. Seasonal variability in phosphorus speciation and deposition in a calcareous, eutrophic lake[J]. Marine Geology, 1997, 139(1/4): 47−59. [40] Liu S M, Zhang J, Chen H T, et al. Nutrients in the Changjiang and its tributaries[J]. Biogeochemistry, 2003, 62(1): 1−18. [41] Paytan A, Cade-Menun B J, McLaughlin K, et al. Selective phosphorus regeneration of sinking marine particles: evidence from 31P-NMR[J]. Marine Chemistry, 2003, 82(1/2): 55−70. [42] Copin-Montegut C, Copin-Montegut G. Stoichiometry of carbon, nitrogen, and phosphorus in marine particulate matter[J]. Deep-Sea Research Part A: Oceanographic Research Papers, 1983, 30(1): 31−46. [43] 刘敏, 侯立军, 许世远, 等. 长江河口潮滩表层沉积物对磷酸盐的吸附特征[J]. 地理学报, 2002, 57(4): 397−406. doi: 10.3321/j.issn:0375-5444.2002.04.003Liu Min, Hou Lijun, Xu Shiyuan, et al. Phosphate adsorption characteristics of tidal flat surface sediments and its environmental effect from the Yangtze estuary[J]. Acta Geographica Sinica, 2002, 57(4): 397−406. doi: 10.3321/j.issn:0375-5444.2002.04.003 [44] Meng Jia, Yao Qingzhen, Yu Zhigang. Particulate phosphorus speciation and phosphate adsorption characteristics associated with sediment grain size[J]. Ecological Engineering, 2014, 70: 140−145. [45] House W A, Jickells T D, Edwards A C, et al. Reactions of phosphorus with sediments in fresh and marine waters[J]. Soil Use and Management, 1998, 14(S4): 139−146. [46] Stefánsson U, Richards F A. Processes contributing to the nutrient distribution off the Columbia River and Strait of Juan de FUCA[J]. Limnology and Oceanography, 1963, 8(4): 394−410. [47] Edmond J M, Spivack A, Grant B C, et al. Chemical dynamics of the Changjiang estuary[J]. Continental Shelf Research, 1985, 4(1/2): 17−36. [48] Butler J N. Aquatic chemistry: an introduction emphasizing chemical equilibria in natural waters (Stumm, Werner)[J]. Journal of Chemical Education, 1971, 48(12): A779. [49] Fox L E, Sager S L, Wofsy S C. Factors controlling the concentrations of soluble phosphorus in the Mississippi estuary[J]. Limnology and Oceanography, 1985, 30(4): 826−832. [50] Burns P, Salomon M. Phosphate adsorption by kaolin in saline environments[J]. Proceedings of the National Shellfish Association, 1969, 59: 121−125. [51] Carritt D E, Goodgal S. Sorption reactions and some ecological implications[J]. Deep-Sea Research (1953), 1954, 1(4): 224−243. [52] Mortimer C H. Chemical exchanges between sediments and water in the Great Lakes-Speculations on probable regulatory mechanisms[J]. Limnology and Oceanography, 1971, 16(2): 387−404. -


计量
- 文章访问数: 372
- HTML全文浏览量: 125
- PDF下载量: 72
- 被引次数: 0
