

An automatic recognition algorithm of global mesoscale dipole based on eddy tracking data
-
摘要: 海洋中的涡旋在传播过程中相互吸引并以偶极子的形式进行传播是一种常见的海洋现象,这些偶极子在输送海水、养分和其他物质方面发挥着重要作用。本文提出了一种基于海表面高度异常数据得到的涡旋轨迹数据的全球偶极子自动识别方法。通过使用K–D树切割空间的方法,对1993年1月至2016年9月间的涡旋轨迹数据进行计算,共发现了生命周期超过了60 d的86 662对向西运动的偶极子和30 590对向东运动的偶极子。结合提取结果,本文对偶极子在全球范围内的特性进行了统计分析,并结合海表面温度异常、盐度异常数据验证了自动识别算法的可靠性。最后,本文分析了具有伴随时间长、传播速度快、纠缠传播特点的偶极子传输模式和传播特性。Abstract: It is a common ocean phenomenon that eddies attract each other and propagate in the form of dipole mode, and these dipoles play an important role in transporting seawater, nutrients and other substances. In this paper, a global dipole pair automatic recognition method based on the eddy trajectory data is proposed. By using the K–D tree for cutting space, the eddy trajectory data are calculated from January 1993 to September 2016, and a total of 86 662 westward moving dipoles and 30 590 eastward moving dipoles with a life cycle of more than 60 days are found. The global characteristics of the dipole that we detected are analyzed, and the reliability of the automatic recognition algorithm is verified by the comparison and test with sea surface temperature anomaly and sea surface salinity anomaly. Finally in this paper, the transmission modes and characteristics of dipoles are analyzed, including the characteristics of long life, high propagation speed and entanglement trajectory.
-
Key words:
- dipole /
- K–D tree /
- eddy tracking /
- eddy recognition
-

图 1 偶极子模式提取算法
a. 偶极子提取算法的概述图,其中mi,ni,pi,oi分别表示某条轨迹上第i天时的涡旋;b–e. 一对具体偶极子模式在不同日期的涡旋识别结果,背景为SLA数据,日期依次为2015年1月7日,2015年4月16日,2015年9月2日,2015年12月26日,图中加粗虚线代表其历史轨迹。图中A和B组成的偶极子模式的其他分析将在5.1节详细展开
Fig. 1 Recognition algorithm of global mesoscale dipole
a. An overview diagram of our dipole eddy pairs extracting method, where mi, ni, pi and oi represent the eddy at the ith day at a track respectively; b-e. eddy detecting results of the detected dipole at different day with background of SLA, the dates are 2015-01-07, 2015-04-16, 2015-09-02, 2015-12-26 in order. The bold dot lines in the figure represent their historical track. Additional analysis of the dipole pattern composed of A and B in the figure will be discussed in Section 5.1
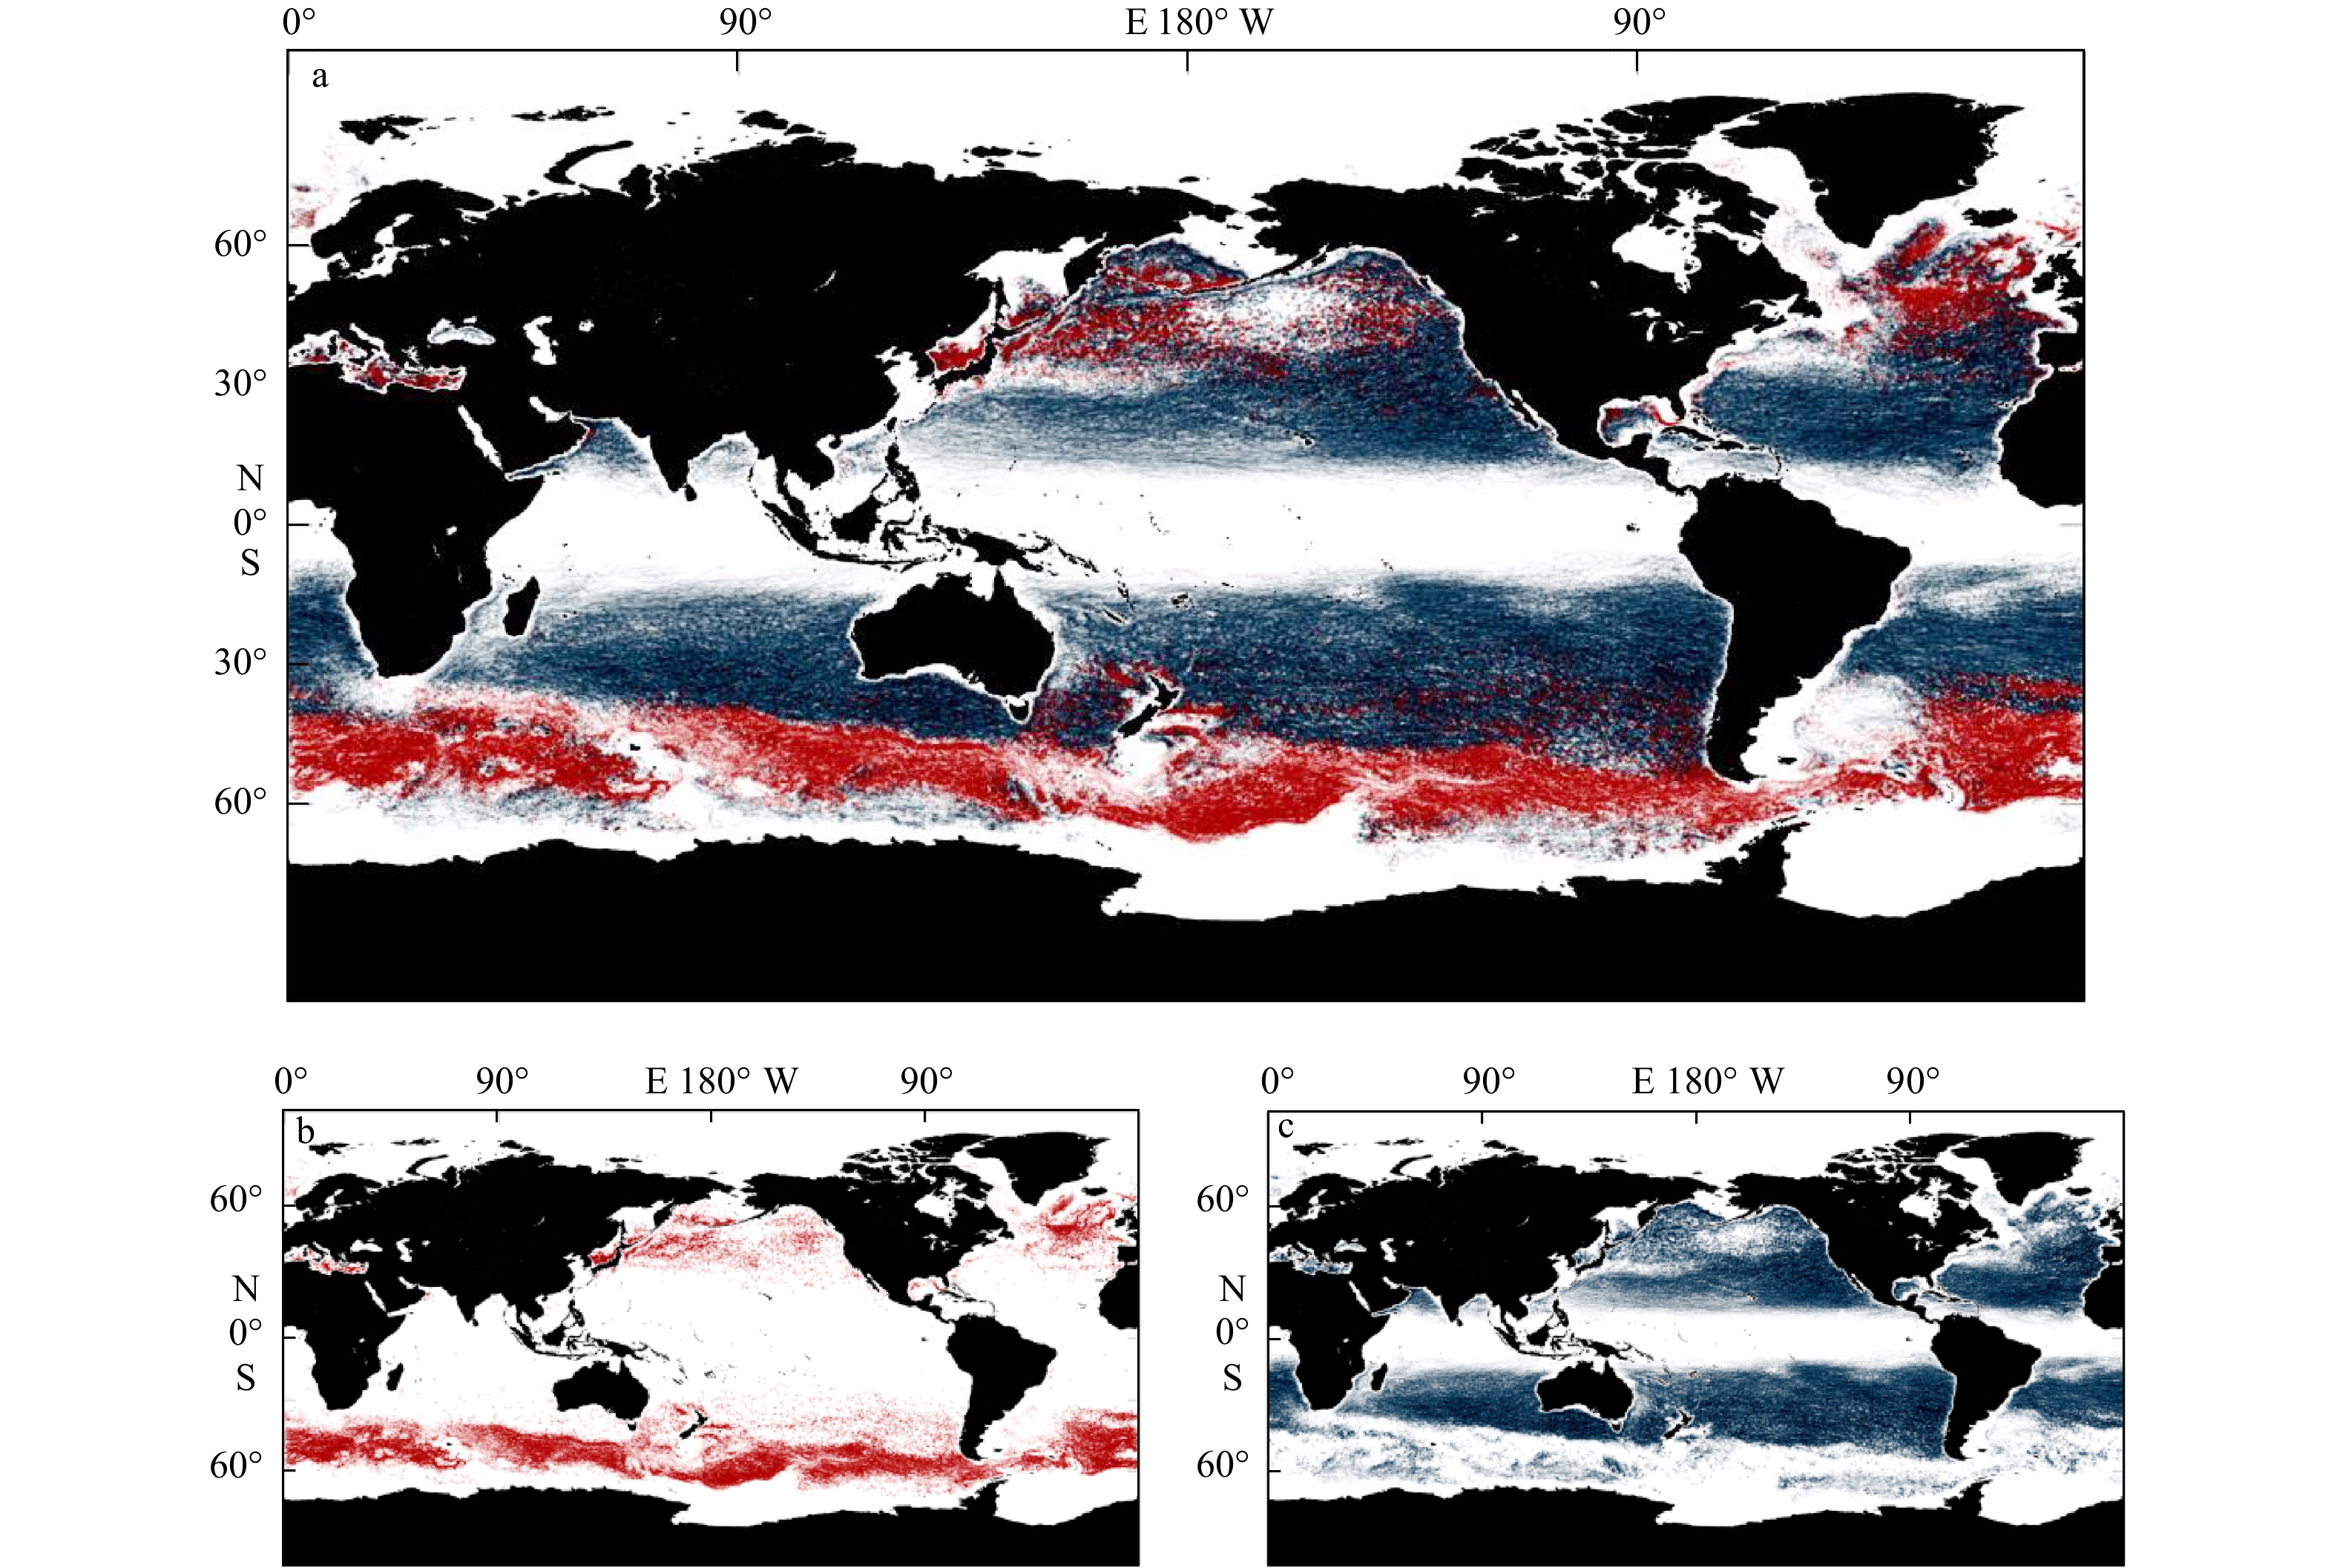
图 2 通过本文方法提取偶极子轨迹
a. 全球轨迹分布,b. 东向传播的轨迹,c. 西向传播轨迹。图中深蓝色代表向西传播的轨迹,红色代表向东的轨迹
Fig. 2 Tracks of dipole extracted by our method
a. Global dipole tracks, b. global eastward dipole tracks, c. global westward dipole tracks. Dark blue represents the westward dipole, and red represents the eastward dipole

图 3 平均传播速度超过5 km/d的偶极子或涡旋轨迹
a. 向东传播的偶极子,b. 向西传播的偶极子,c. 向东传播的涡旋,d. 向西传播的涡旋。图中蓝色代表反气旋涡,紫红色代表气旋涡
Fig. 3 Tracks of dipole or eddy with average speed over 5 km/d
a. Dipole tracks that propagate eastward, b. dipole tracks that propagate westward, c. eddy tracks that propagate eastward, d.eddy tracks that propagate westward. Blue represents the anticyclonic eddy and purple represents the cyclonic eddy
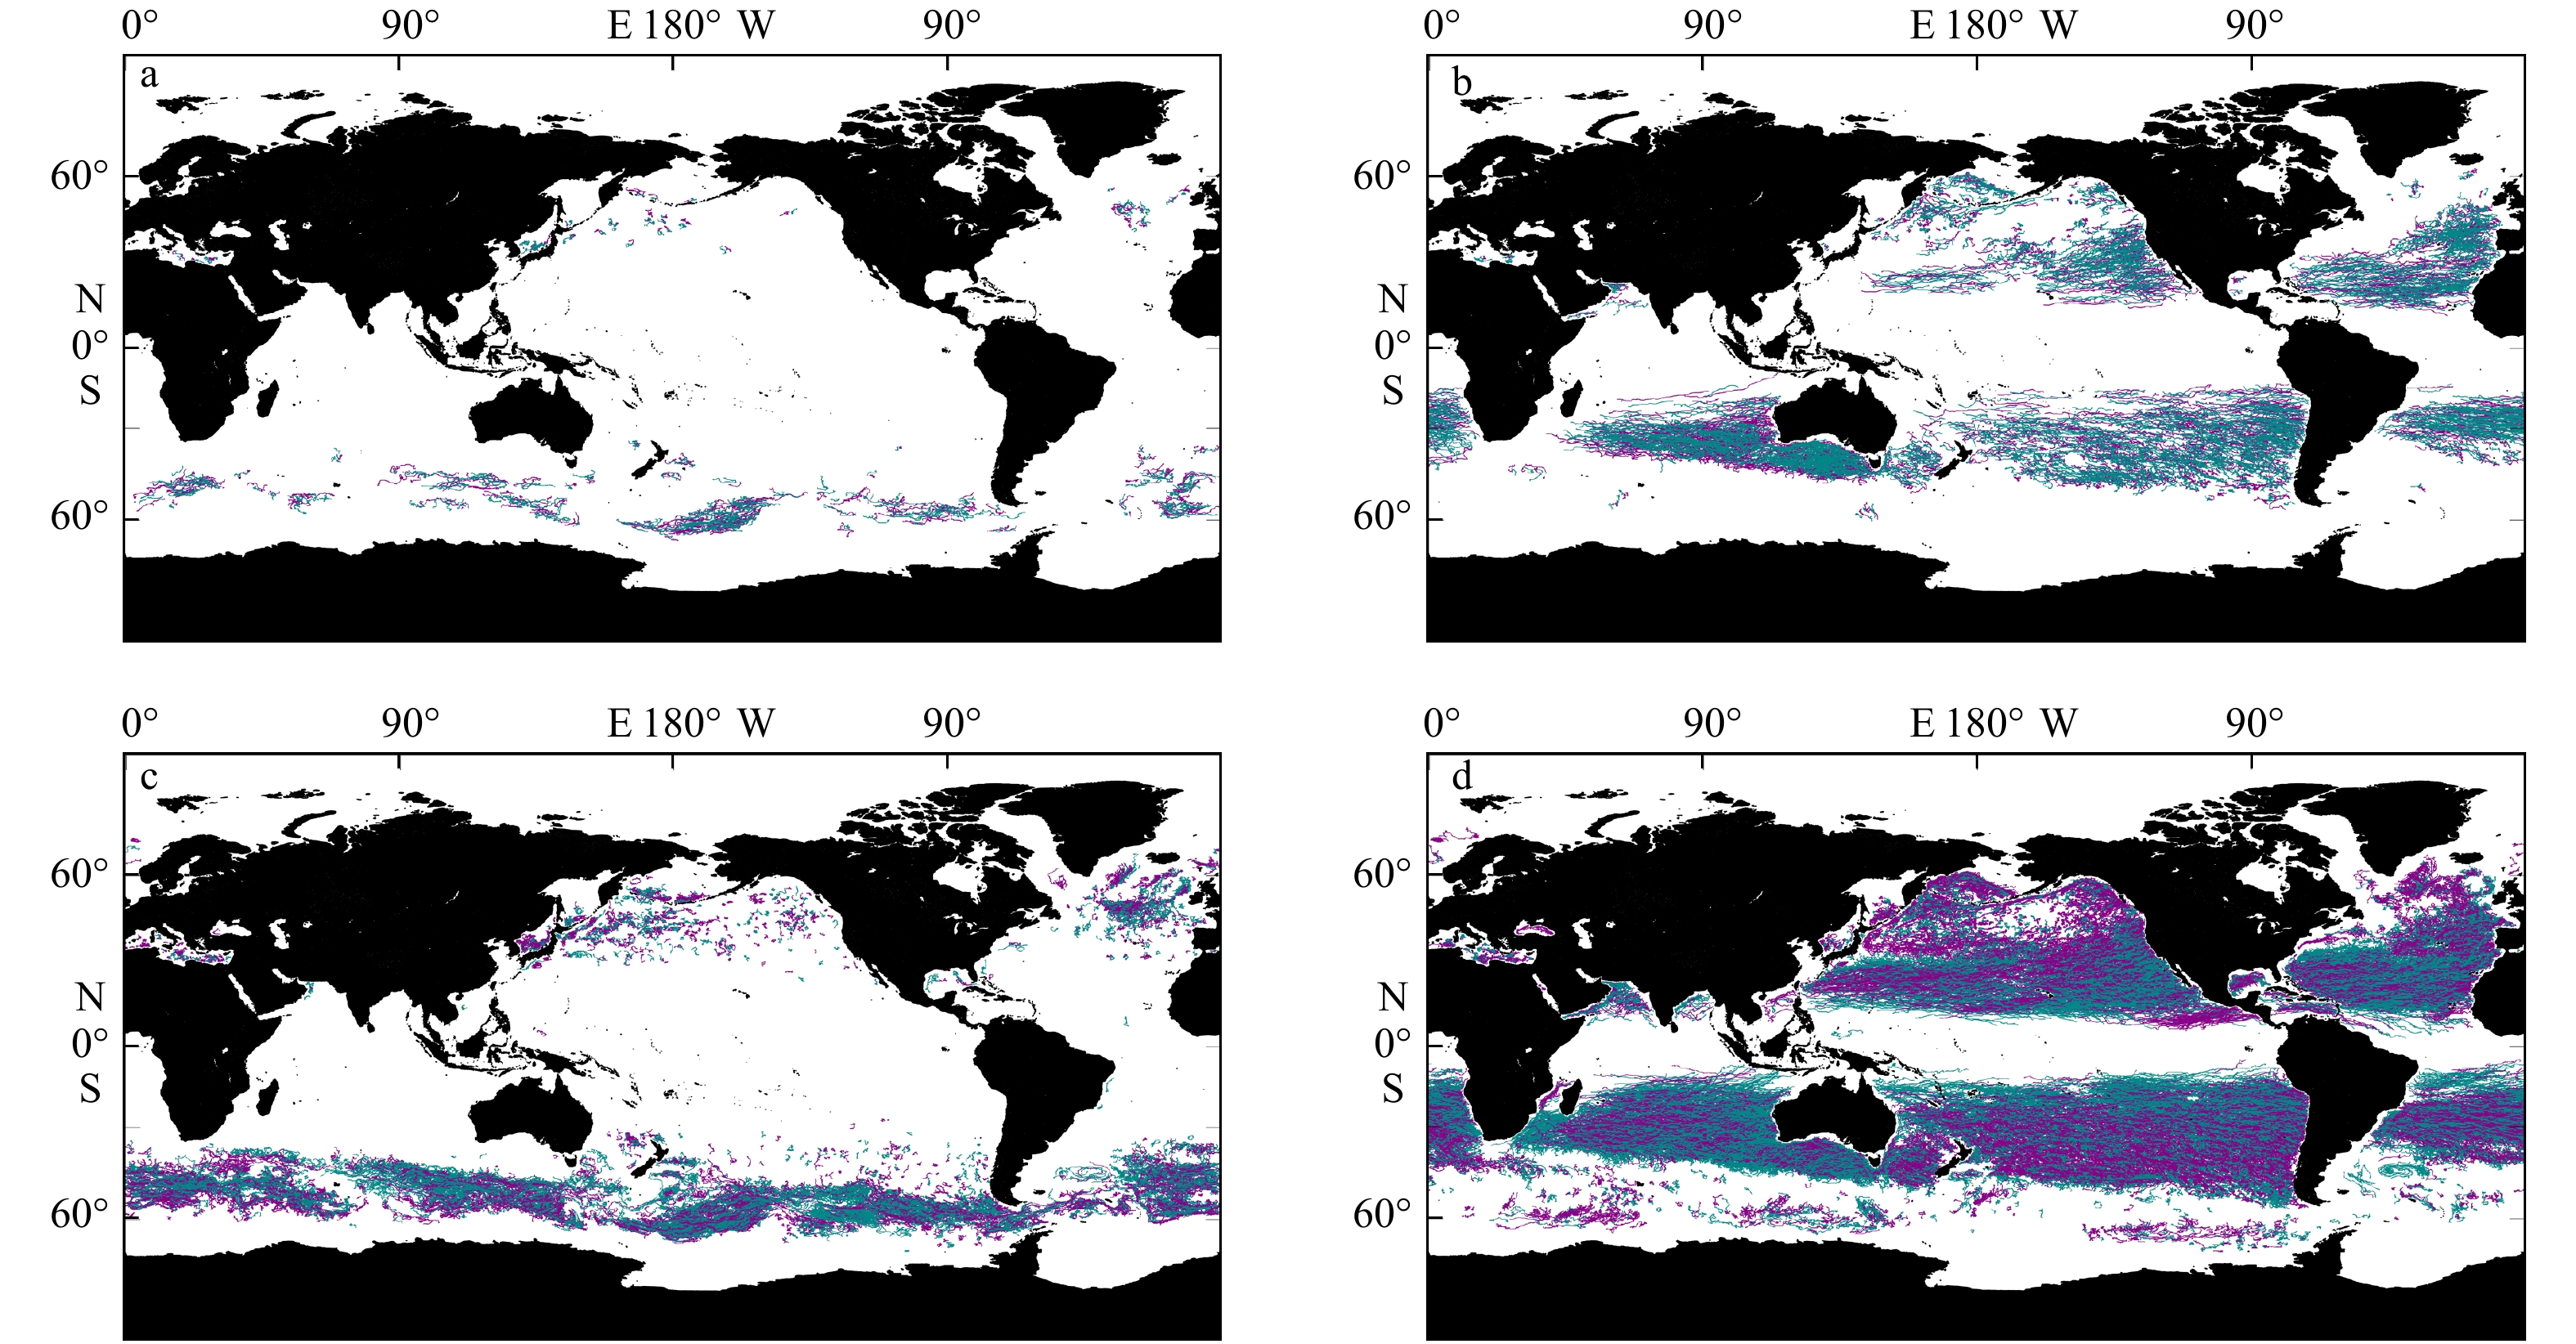
图 4 伴随时间超过180 d的偶极子或寿命超过180 d的涡旋的传播轨迹
a. 向东传播的偶极子,b. 向西传播的偶极子,c. 向东传播的涡旋,d. 向西传播的涡旋。图中蓝色代表反气旋涡,紫红色代表气旋涡
Fig. 4 Tracks of dipole or eddy that existed for over 180 days
a. Dipole tracks that propagate eastward, b. dipole tracks that propagate westward, c. eddy tracks that propagate eastward, d. eddy tracks that propagate westward. Blue represents the anticyclonic eddy and purple represents the cyclonic eddy

图 5 以偶极子的中心(取气旋涡和反气旋涡的两个涡心的中间位置)进行统计,伴随时间超过60 d的偶极子的首次捕获的位置(a)和伴随时间超过200 d的偶极子的首次捕获位置(b)
Fig. 5 The center of the dipole pairs (the middle position of the two vortex center of the anticyclonic eddy and cyclonic eddy) was counted, the first capture position of dipole pairs that existed over 60 days (a) and the first capture position of dipole pairs that existed over 200 days (b)

图 6 偶极子涡旋传播轨迹(a);偶极子在不同日期的涡旋识别结果(b−e);偶极子周围的平均温度异常(f);多年数据叠加后的偶极子平均温度异常(g)
蓝色代表气旋涡,紫色代表反气旋涡;背景为SSTA数据,日期依次为2015年1月7日,2015年4月16日,2015年9月2日,2015年12月26日,图中蓝色粗点代表气旋涡,紫色粗点代表反气旋涡,黑色粗点代表偶极子中心
Fig. 6 Positions of the dipole eddy core during their life time (a), eddy detecting result of the dipole at different days with background of SSTA (b−e), the average SSTA anomalies around the dipole (f); the average superimposed SSTA around dipoles (g)
Blue represents cyclonic eddy, purple represents anticyclonic eddy; the dates are January 7, 2015, April 16, 2015, September 2, 2015, December 26, 2015 in order, the blue dot represents the normalized cyclonic eddy core, the purple dot represents the normalized anticyclonic eddy core, the black dot represents the middle of the dipole

图 7 一对偶极子传播过程中最大地转流速度变化(a)和对比(b)
Fig. 7 The changes (a) and comparisones (b) of the maximum geostrophic velocity of a dipole

图 8 偶极子传播速度的分布(a)和偶极子传播速度与生命周期的对应关系(b)
Fig. 8 Distribution of the propagation velocity of dipole pairs (a), and the corresponding relationship between the propagation speed of dipole pairs and the life cycle (b)

图 9 传播速度快(≥5 km/d)的偶极子首次捕获位置的全球分布(a);偶极子的传播轨迹(b);偶极子周围的平均盐度异常(c);多年数据叠加后的偶极子周围的平均盐度异常(d)
Fig. 9 The first capture position of dipoles with fast propagation speed (≥5 km/d) (a); the selected dipole’s tajectory (b); the average SSSA around the selected dipole (c); the average superimposed SSSA around dipoles (d)
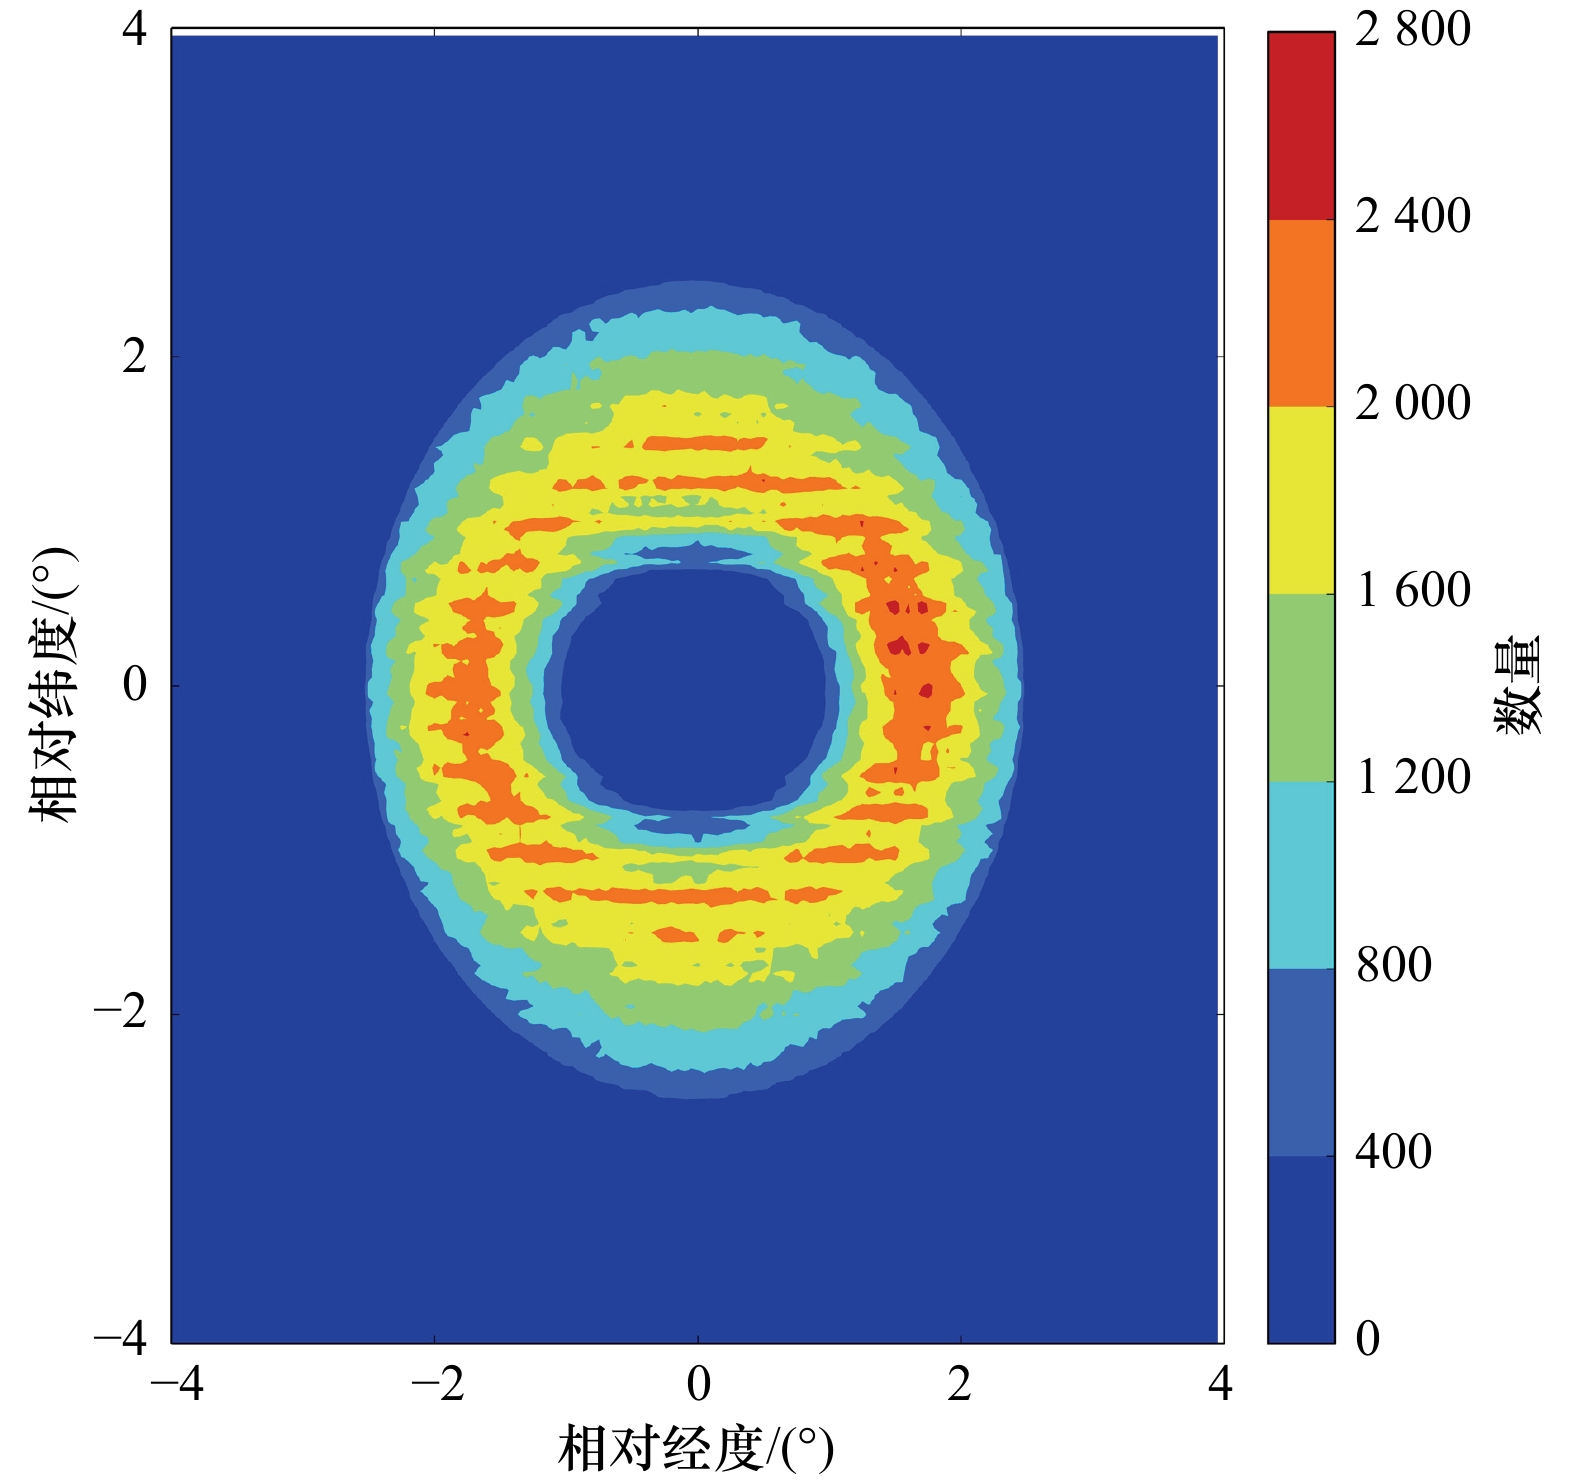
图 10 以反气旋为原点,全球偶极子轨迹叠加示意图
Fig. 10 Superposition of global dipole trajectories with anticyclone as the origin of coordinates

11 全球纠缠传播偶极子(缠绕角度大于90°)轨迹(a);选取的纠缠传播的偶极子轨迹(b);经过归一化后的偶极子数据结构(c−f)选取的偶极子周围的平均温度异常(c);选取的偶极子周围的平均盐度异常(d);多年数据叠加后的偶极子周围的平均温度异常(e);多年数据叠加后的偶极子周围的平均盐度异常(f)。红色粗点代表归一化后AE涡心,蓝色粗点代表归一化后CE涡心
11 Trajectories of tangle dipole (a). The selected dipole’s trajectory (b), blue represents CE,purple represents AE. Nnormalized dipole structure (c)(d)(e)(f), the red dot represents the normalized AE core, and the blue dot represents the normalized CE core. The average SSTA around the selected dipole (c). The average SSSA around the selected dipole (d). The average superimposed SSTA around dipoles (e). The average superimposed SSSA around dipoles (f)
-
[1] McWilliams J C. The nature and consequences of oceanic eddies[M]//Hecht M W, Hasumi H. Geophysical Monograph Series. Washington: American Geophysical Union, 2008: 5−15. [2] Chen Gengxin, Hou Yijun, Zhang Qilong, et al. The eddy pair off eastern Vietnam: interannual variability and impact on thermohaline structure[J]. Continental Shelf Research, 2010, 30(7): 715−723. doi: 10.1016/j.csr.2009.11.013 [3] Callendar W, Klymak J M, Foreman M G G. Tidal generation of large sub-mesoscale eddy dipoles[J]. Ocean Science, 2011, 7(4): 487−502. [4] Hooker S B, Brown J W, Kirwan A D, et al. Kinematics of a warm-core dipole ring[J]. Journal of Geophysical Research, 1995, 100(C12): 24797−24809. [5] L'Hégaret P, Carton X, Ambar I, et al. Evidence of Mediterranean water dipole collision in the Gulf of Cadiz[J]. Journal of Geophysical Research: Oceans, 2014, 119(8): 5337−5359. doi: 10.1002/2014JC009972 [6] Hughes C W, Miller P I. Rapid water transport by long-lasting modon eddy pairs in the southern midlatitude oceans[J]. Geophysical Research Letters, 2017, 44(24): 12375−12384. [7] Apango-Figueroa E, Sánchez-Velasco L, Lavín M F, et al. Larval fish habitats in a mesoscale dipole eddy in the Gulf of California[J]. Deep Sea Research Part I: Oceanographic Research Papers, 2015, 103: 1−12. [8] Carton X, Daniault N, Alves J, et al. Meddy dynamics and interaction with neighboring eddies southwest of Portugal: observations and modeling[J]. Journal of Geophysical Research: Oceans, 2010, 115(C6): C06017. [9] Davies S M, Sánchez-Velasco L, Beier E, et al. Three-dimensional distribution of larval fish habitats in the shallow oxygen minimum zone in the eastern tropical Pacific Ocean off Mexico[J]. Deep Sea Research Part I: Oceanographic Research Papers, 2015, 101: 118−129. [10] de Ruijter W P M, van Aken H M, Beier E J, et al. Eddies and dipoles around South Madagascar: formation, pathways and large-scale impact[J]. Deep Sea Research Part I: Oceanographic Research Papers, 2004, 51(3): 383−400. doi: 10.1016/j.dsr.2003.10.011 [11] Chu Xiaoqing, Dong Changming, Qi Yiquan. The influence of ENSO on an oceanic eddy pair in the South China Sea[J]. Journal of Geophysical Research: Oceans, 2017, 122(3): 1643−1652. [12] 樊孝鹏, 黄大吉, 章本照. 南海的偶极子模式[J]. 浙江大学学报:工学版, 2006, 40(6): 956−960.Fan Xiaopeng, Huang Daji, Zhang Benzhao. Bipole mode in South China Sea[J]. Journal of Zhejiang University: Engineering Science, 2006, 40(6): 956−960. [13] 陈符森, 潘长明, 薄文波, 等. 南海涡动能比季节变化特征及机理分析[J]. 海洋通报, 2016, 35(4): 406−413. doi: 10.11840/j.issn.1001-6392.2016.04.007Chen Fusen, Pan Changming, Bo Wenbo, et al. Seasonal variations and analysis of lower-bound estimates on the percentage of eddy kinetic energy in the South China Sea[J]. Marine Science Bulletin, 2016, 35(4): 406−413. doi: 10.11840/j.issn.1001-6392.2016.04.007 [14] 杨秋明. 南印度洋副热带偶极子型海温异常与全球环流和我国降水变化的关系[J]. 海洋学报, 2006, 28(3): 47−56.Yang Qiuming. Indian Ocean subtropical dipole and variations of global circulations and rainfall in China[J]. Haiyang Xuebao, 2006, 28(3): 47−56. [15] 徐海明, 张岚, 杜岩. 南印度洋偶极子及其影响研究进展[J]. 热带海洋学报, 2013, 32(1): 1−7. doi: 10.3969/j.issn.1009-5470.2013.01.001Xu Haiming, Zhang Lan, Du Yan. Research progress of southern Indian Ocean Dipole and its influence[J]. Journal of Tropical Oceanography, 2013, 32(1): 1−7. doi: 10.3969/j.issn.1009-5470.2013.01.001 [16] Chelton D B, Schlax M G, Samelson R M, et al. Global observations of large oceanic eddies[J]. Geophysical Research Letters, 2007, 34(15): L15606. [17] Sadarjoen I A, Post F H. Detection, quantification and tracking of vortices using streamline geometry[J]. Computers & Graphics, 2000, 24(3): 333−341. [18] Chaigneau A, Gizolme A, Grados C. Mesoscale eddies off Peru in altimeter records: identification algorithms and eddy spatio-temporal patterns[J]. Progress in Oceanography, 2008, 79(2/4): 106−119. [19] Doglioli A M, Blanke B, Speich S, et al. Tracking coherent structures in a regional ocean model with wavelet analysis: application to cape basin eddies[J]. Journal of Geophysical Research: Oceans, 2007, 112(C5): C05043. [20] Williams S, Hecht M, Petersen M, et al. Visualization and analysis of eddies in a global ocean simulation[J]. Computer Graphics Forum, 2011, 30(3): 991−1000. doi: 10.1111/j.1467-8659.2011.01948.x [21] Chelton D B, Schlax M G, Samelson R M. Global observations of nonlinear mesoscale eddies[J]. Progress in Oceanography, 2011, 91(2): 167−216. doi: 10.1016/j.pocean.2011.01.002 [22] Faghmous J H, Frenger I, Yao Yuanshun, et al. A daily global mesoscale ocean eddy dataset from satellite altimetry[J]. Scientific Data, 2015, 2: 150028. [23] Haller G. Lagrangian coherent structures[J]. Annual Review of Fluid Mechanics, 2015, 47(1): 137−162. doi: 10.1146/annurev-fluid-010313-141322 [24] Onu K, Huhn F, Haller G. LCS tool: a computational platform for lagrangian coherent structures[J]. Journal of Computational Science, 2015, 7: 26−36. [25] Penven P, Echevin V, Pasapera J, et al. Average circulation, seasonal cycle, and mesoscale dynamics of the Peru current system: a modeling approach[J]. Journal of Geophysical Research: Oceans, 2005, 110(C10): C10021. doi: 10.1029/2005JC002945 [26] Chaigneau A, Eldin G, Dewitte B. Eddy activity in the four major upwelling systems from satellite altimetry (1992−2007)[J]. Progress in Oceanography, 2009, 83(1/4): 117−123. [27] Mason E, Pascual A, McWilliams J C. A new sea surface height-based code for oceanic mesoscale eddy tracking[J]. Journal of Atmospheric and Oceanic Technology, 2014, 31(5): 1181−1188. doi: 10.1175/JTECH-D-14-00019.1 [28] Tian Fenglin, Wu Di, Yuan Liming, et al. Impacts of the efficiencies of identification and tracking algorithms on the statistical properties of global mesoscale eddies using merged altimeter data[J]. International Journal of Remote Sensing, 2020, 41(8): 2835−2860. doi: 10.1080/01431161.2019.1694724 [29] Liu Yingjie, Chen Ge, Sun Miao, et al. A parallel SLA-based algorithm for global mesoscale eddy identification[J]. Journal of Atmospheric and Oceanic Technology, 2016, 33(12): 2743−2754. doi: 10.1175/JTECH-D-16-0033.1 [30] Bachman S D, Taylor J R. Numerical simulations of the equilibrium between eddy-induced restratification and vertical mixing[J]. Journal of Physical Oceanography, 2015, 46(3): 919−935. [31] 郑全安, 谢玲玲, 郑志文, 等. 南海中尺度涡研究进展[J]. 海洋科学进展, 2017, 35(2): 131−158. doi: 10.3969/j.issn.1671-6647.2017.02.001Zheng Quan’an, Xie Lingling, Zheng Zhiwen, et al. Progress in research of mesoscale eddies in the South China Sea[J]. Advances in Marine Science, 2017, 35(2): 131−158. doi: 10.3969/j.issn.1671-6647.2017.02.001 [32] Xie Lingling, Zheng Quan’an, Zhang Shuwen, et al. The Rossby normal modes in the South China Sea deep basin evidenced by satellite altimetry[J]. International Journal of Remote Sensing, 2018, 39(2): 399−417. doi: 10.1080/01431161.2017.1384591 [33] Qiu Bo, Miao Weifeng, Müller P. Propagation and decay of forced and free Baroclinic Rossby waves in off-equatorial oceans[J]. Journal of Physical Oceanography, 1997, 27(11): 2405−2417. doi: 10.1175/1520-0485(1997)027<2405:PADOFA>2.0.CO;2 [34] Chelton D B, Schlax M G, Samelson R M, et al. Global observations of westward energy propagation in the ocean: Rossby waves or nonlinear eddies?[J]. Geophysical Research Letters, 2006, 34: L15606. [35] 陈秋, 贾帅东, 刘现鹏. 一种格网树与KD树组合的水深数据索引方法[J]. 海洋测绘, 2019, 39(5): 18−20, 47. doi: 10.3969/j.issn.1671-3044.2019.05.005Chen Qiu, Jia Shuaidong, Liu Xianpeng. A data retrieve method based on grid tree and K-Dimension tree[J]. Hydrographic Surveying and Charting, 2019, 39(5): 18−20, 47. doi: 10.3969/j.issn.1671-3044.2019.05.005 [36] Sun Miao, Tian Fenglin, Liu Yingjie, et al. An improved automatic algorithm for global eddy tracking using satellite altimeter data[J]. Remote Sensing, 2017, 9(3): 206. doi: 10.3390/rs9030206 [37] Lynch C E, Prosser D T, Smith M J. An efficient actuating blade model for unsteady rotating system wake simulations[J]. Computers & Fluids, 2014, 92: 138−150. [38] 徐驰, 陈桂英, 尚晓东, 等. 海洋中尺度涡旋源汇空间分布特征研究[J]. 热带海洋学报, 2013, 32(2): 37−46. doi: 10.3969/j.issn.1009-5470.2013.02.004Xu Chi, Chen Guiying, Shang Xiaodong, et al. The spatial distribution of sources and sinks of ocean mesoscale eddies[J]. Journal of Tropical Oceanography, 2013, 32(2): 37−46. doi: 10.3969/j.issn.1009-5470.2013.02.004 [39] Stern M E. Minimal properties of planetary eddies[J]. Journal of Marine Research, 1975, 33(1): 1−13. [40] Manucharyan G E, Timmermans M L. Generation and separation of mesoscale eddies from surface ocean fronts[J]. Journal of Physical Oceanography, 2013, 43(12): 2545−2562. doi: 10.1175/JPO-D-13-094.1 -

 下载:
下载:

计量
- 文章访问数: 337
- HTML全文浏览量: 282
- PDF下载量: 46
- 被引次数: 0
