

Impacts of the late spring Arctic Oscillation on the summer tropical cyclone frequency over the western North Pacific
-
摘要: 利用美国气象环境预报中心和美国国家大气研究中心 (NCEP/NCAR)再分析资料以及中国气象局发布的热带气旋(TC)最佳路径数据集,本文探讨了1950–2018年期间晚春(5月)北极涛动(AO)与随后夏季(6–9月)西北太平洋上空热带气旋生成频数的关系。研究表明,晚春AO对夏季西北太平洋TC生成有明显的预报指示意义,二者之间存在显著的正相关关系。对应晚春AO指数偏高年,夏季西太平洋副热带高压主体位置偏东偏北、强度偏弱,西北太平洋上空大气低层有较强的辐合、高层辐散增强、中层水汽充足、垂直风切较弱,这些大尺度环境因子均有利于TC的生成。而在晚春AO指数偏低年,西北太平洋上空的大气环流特征与上述特征相反,造成TC生成频数偏少。进一步的分析揭示:与AO变化密切相关的北太平洋风暴轴位置的南北移动,在晚春AO与夏季西北太平洋TC生成频数二者关系中起到了关键作用。AO正位相(负位相)年,北太平洋风暴轴向北(向南)偏移,通过天气尺度波动和平均流之间的相互作用,造成后期夏季西北太平洋上空低层形成气旋性(反气旋性)涡度异常,在局地经向环流的调整作用下,西北太平洋副热带高压的位置及强度发生改变,对西北太平洋TC的形成起到了促进(抑制)作用。Abstract: In the present study, the connection between the Arctic Oscillation (AO) in May and the following summer (June to September) western North Pacific tropical cyclone genesis frequency is investigated based on NCEP/NCAR reanalysis data and tropical cyclone data from China Meteorological Administration for the period 1950–2018. A statistically significant positive correlation is found between the late spring AO and summer tropical cyclone genesis frequency. The diagnosis results show that the low-level relative vorticity, high-level divergence, vertical wind shear and the mid-low level relative humidity are all beneficial for the genesis of the western North Pacific tropical cyclones during the positive AO years. Moreover, the western Pacific subtropical high shifts eastward and northward and tends to be much weaker. On the contrary, during the negative AO years, the tropical cyclone formation is reduced because of the strengthened western Pacific subtropical high combined with an anticyclonic vorticity in the lower troposphere. The possible mechanism involved the variations of the storm track in the North Pacific. It is showed that during the positive (negative) AO years the storm track is moving northward (southward) and there is a cyclonic (an anticyclonic) vorticity anomaly in the lower troposphere in the western North Pacific in the subsequent summer through the interaction between the synoptic-scale eddies and low-frequency mean flow. The resulting anomalous local Hadley circulation could lead to the change of the western Pacific subtropical high and further contribute to the western North Pacific tropical cyclogenesis.
-
Key words:
- Arctic Oscillation /
- tropical cyclone /
- western North Pacific /
- storm track
-
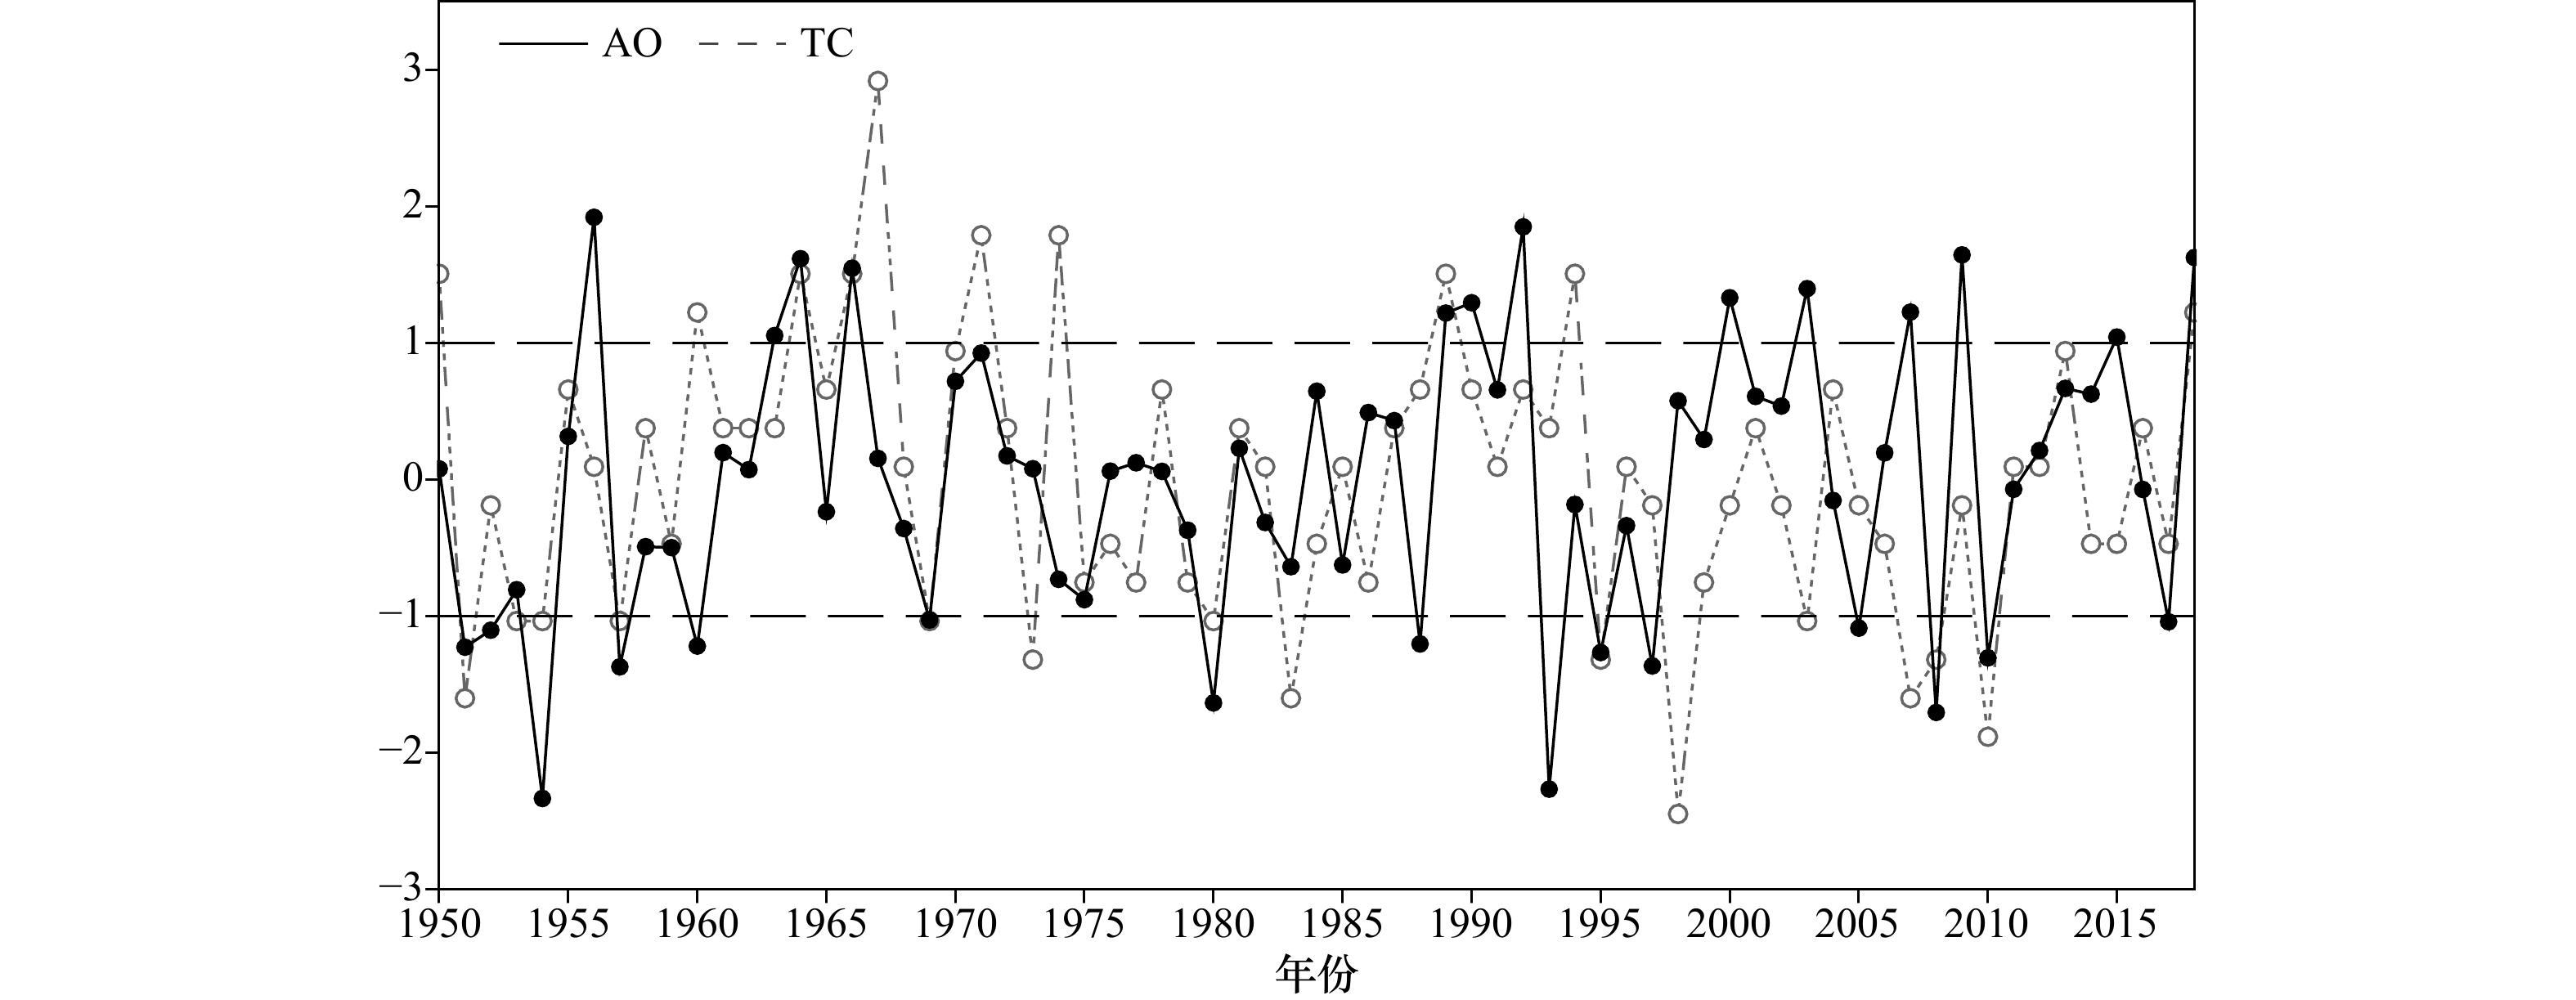
图 1 1950–2018年标准化的晚春(5月)AO指数(黑色实线)与夏季(6–9月)西北太平洋热带气旋生成频数(浅灰色虚线)的年际变化序列
Fig. 1 Normalized time series of the late spring (May) Arctic Oscillation (AO) index (black solid line) and tropical cyclone (TC) frequency over the western North Pacific (grey dashed line) in the subsequent summer (June to September) for the period of 1950–2018

图 2 1950–2018年期间夏季平均海平面气压场(SLP,等值线;间隔:0.1 hPa)和850 hPa风场(UV850,矢量;单位:m/s)(a)以及500 hPa垂直速度(O500,黑色等值线;间隔:1.5×10⁻³ Pa/s)和500 hPa位势高度场(H500,红色及蓝色等值线)(b)回归到晚春AO指数的分布
b中红色及蓝色特征值线分别表征多年平均及将回归结果叠加其上的西太平洋副热带高压位置。深色和浅色阴影分别表示海平面气压(a)、垂直速度(b)通过95%和90%信度水平验证
Fig. 2 Regression distributions of the summer mean sea level pressure (SLP, contours; interval: 0.1 hPa) and 850 hPa wind (UV850, vectors; unit: m/s) (a), 500 hPa vertical velocity (O500, black contours; interval: 1.5×10⁻³ Pa/s) and 500 hPa geopotential height (H500, red and blue contours) (b) on the late spring AO index
Red and blue lines in b denote the multi-year mean and superimposed the regressed anomalies on the multi-year mean western Pacific Subtropical High. Heavy and light shadings indicate the SLP (a), vertical velocity (b) anomalies significant above 95% and 90% confidence level, respectively

图 3 将1950–2018年期间夏季平均对流层低层850 hPa相对涡度(等值线;间隔:0.5×10⁻⁶ s−1)(a),对流层上层200 hPa散度(等值线;间隔:0.75×10⁻⁶ s−1)(b),200~850 hPa之间纬向风的垂直切变(等值线;间隔:0.3 m/s)(c)以及700~500 hPa平均相对湿度(等值线;间隔:0.3%)(d)回归到晚春AO指数的分布型
深色和浅色阴影分别表示通过95%和90%信度水平
Fig. 3 Regression distributions of the summer mean 850 hPa vorticity (contours; interval: 0.5×10⁻⁶ s−1) (a), 200 hPa divergence (contours; interval: 0.75×10⁻⁶ s−1) (b), vertical zonal wind shear between 200−850 hPa (contours; interval: 0.3 m/s) (c) and 700−500 hPa mean relative humidity (contours; interval: 0.3%) (d) on the late spring AO index
Heavy and light shadings indicate the areas with the anomaly values significant above 95% and 90% confidence level, respectively
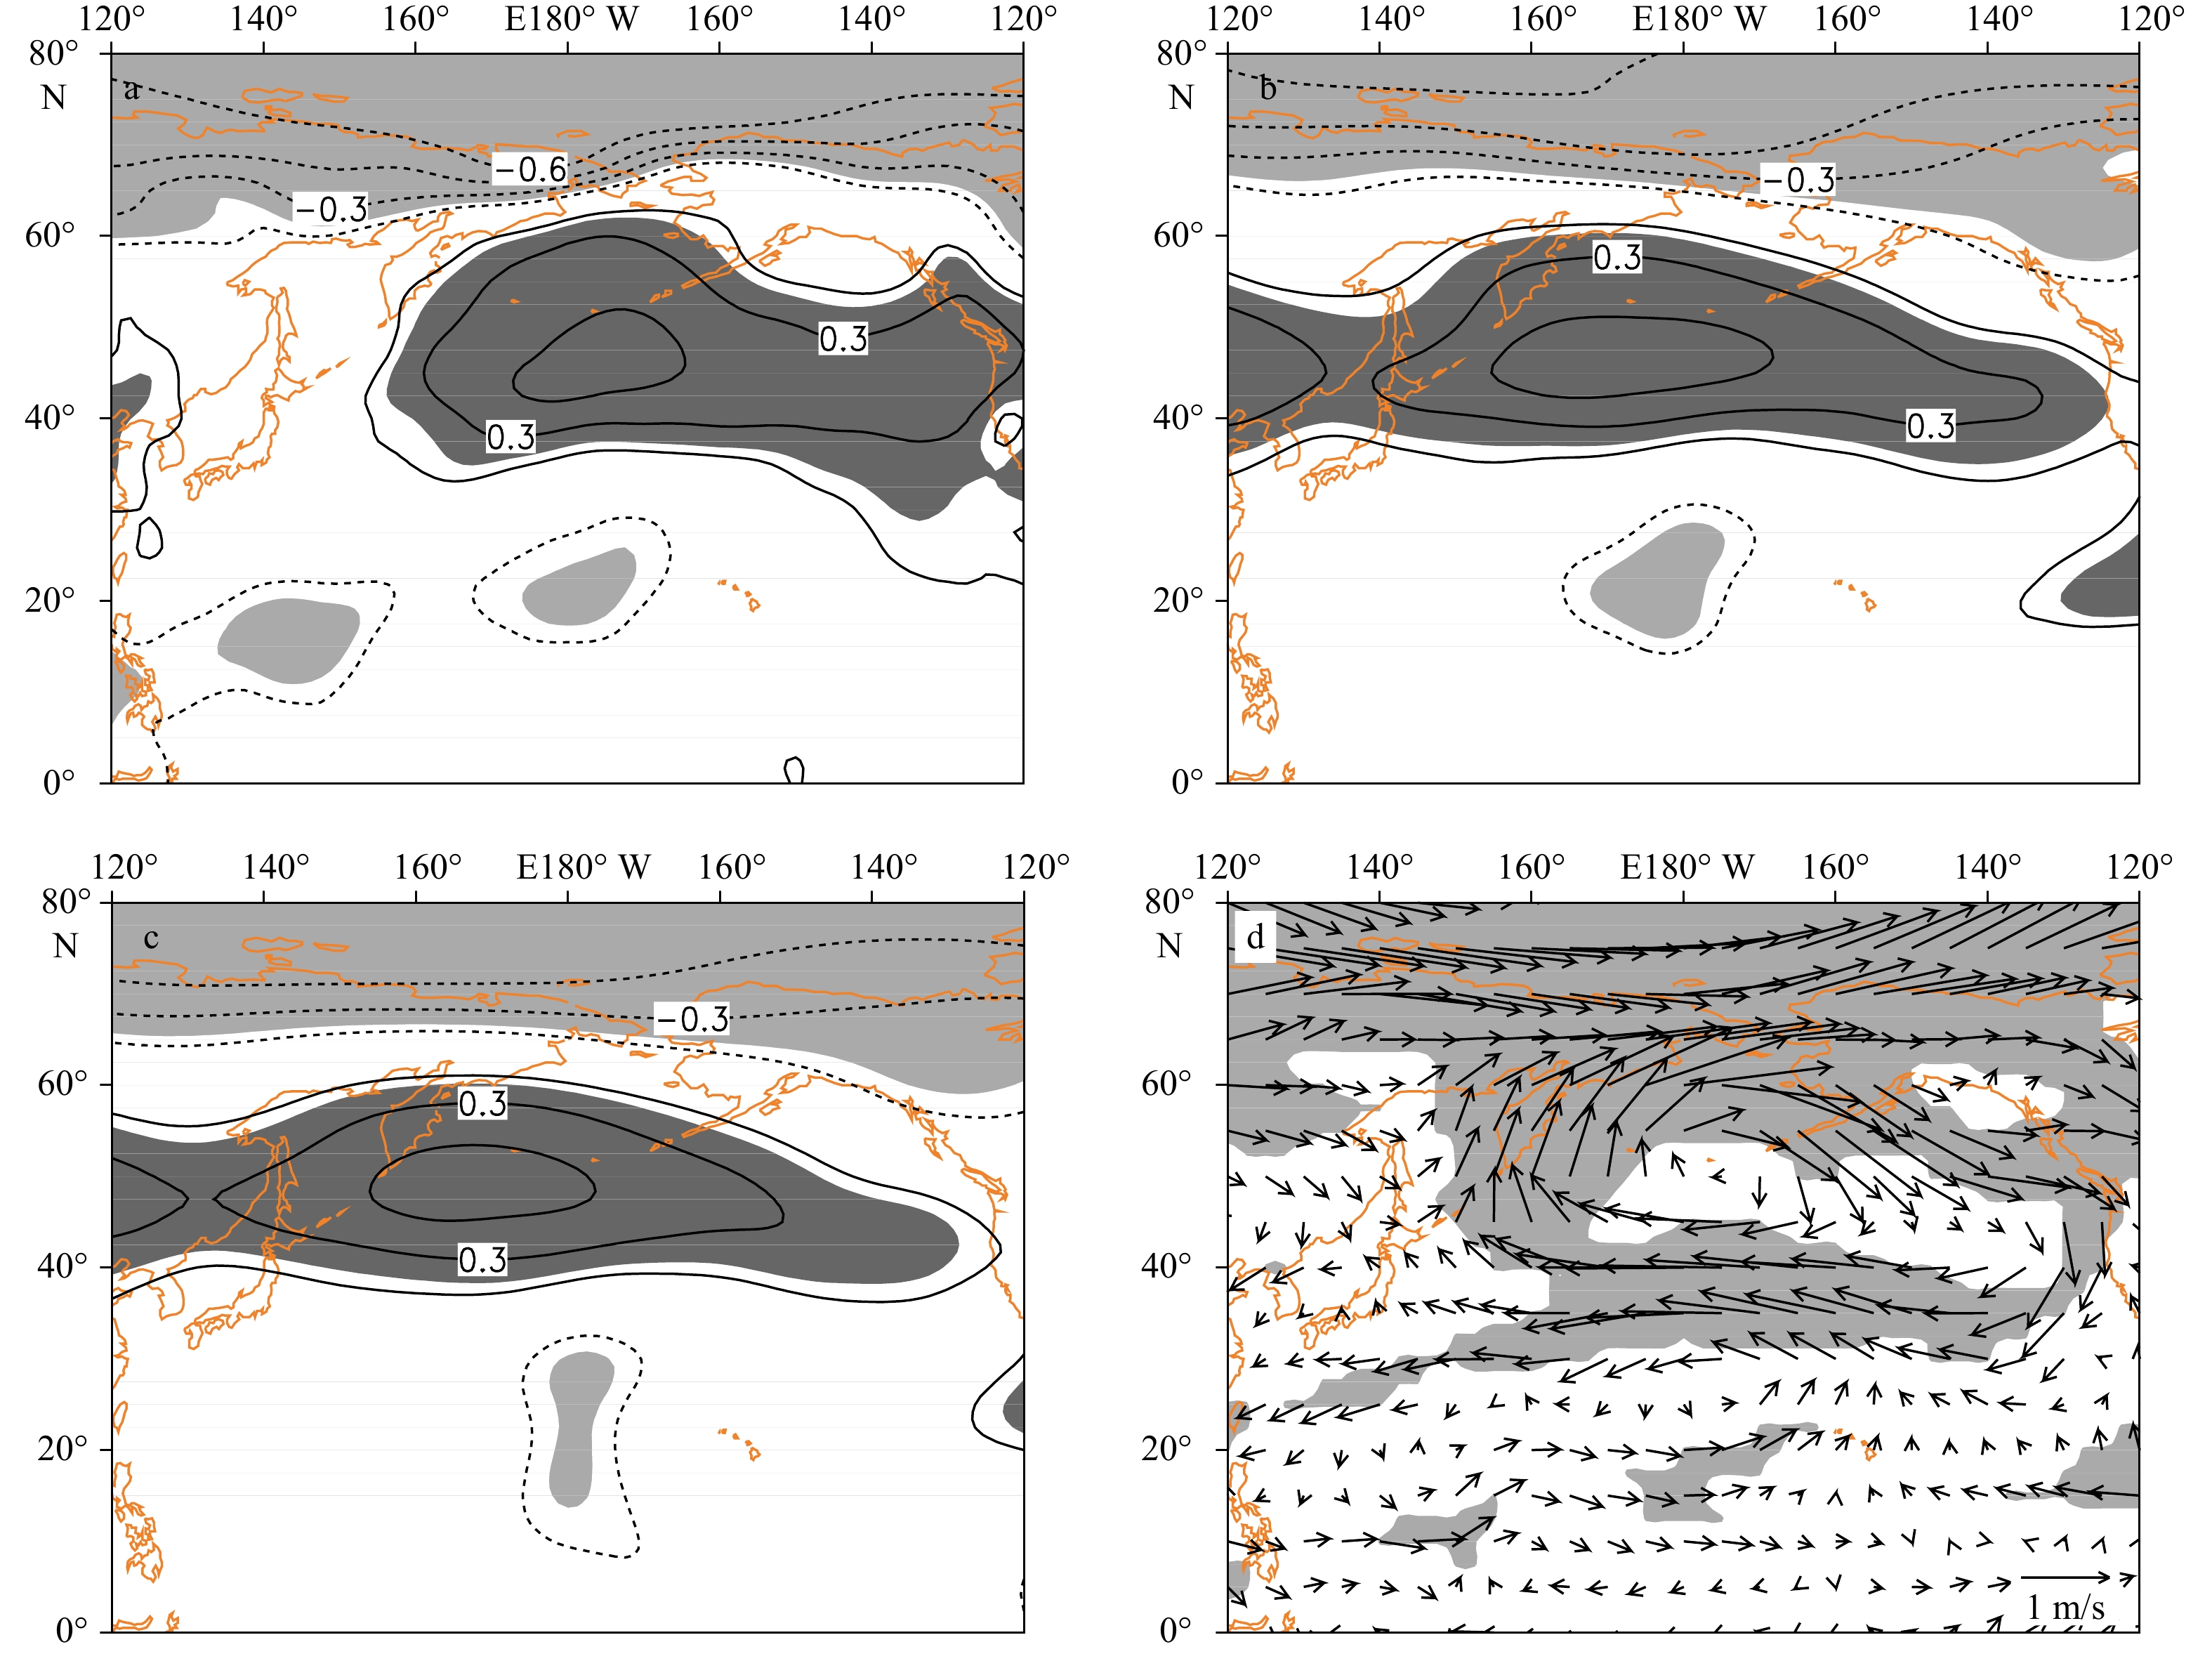
图 4 1950−2018年期间晚春AO指数与同期海平面气压场(a),500 hPa位势高度场(b),以及200 hPa位势高度场(c)的相关分布,将同期850 hPa风场(矢量;单位:m/s)回归到春晚AO指数的分布型(d)
a、b和c中等值线间隔为0.15,阴影表示通过95%信度检验的区域
Fig. 4 Correlation patterns between late spring AO index and the simultaneous sea level pressure (a), 500 hPa geopotential height (b), and 200 hPa geopotential height (c) for the period 1950–2018, regressed pattern 850 hPa wind (vectors; unit: m/s) on the late spring AO index (d)
The contour interval is 0.15 in a, b and c. Significant values above the 95% confidence level are shaded

图 5 将1950−2018年期间5月北太平洋风暴轴(等值线;间隔:60 gpm)回归到同期AO指数的分布型(a),5月风暴轴(等值线;间隔:60 gpm)经验正交函数分解的第二模态的空间分布型(b)以及对应的标准化处理后的时间系数(即风暴轴位置指数STPI)(c)
a和b中深、浅色阴影分别通过95%、90%信度检验的区域。加粗黑色虚线表示多年平均风暴轴的轴线位置
Fig. 5 Regression of the North Pacific storm track (contours; interval: 60 gpm) on the May AO index (a), spatial pattern (contours; interval: 60 gpm) (b) and normalized time coefficients (defined as the Storm Track Position Index, STPI) (c) of the second leading empirical orthogonal function modes of the North Pacific storm track in May
Heavy and light shadings indicate the 95% and 90% confidence level in a and b. The axis of the multi-year mean storm track is marked by the thick black dashed line

图 6 将1950–2018年期间夏季平均850 hPa风场(矢量;单位:m/s)、850 hPa相对涡度(深色和浅色阴影分别表示通过95%和90%信度水平)及500 hPa位势高度场回归到风暴轴位置指数的空间分布型
红色及蓝色加粗线分别表征多年平均及将回归结果叠加其上的西太平洋副热带高压位置
Fig. 6 Regression distributions of storm track position index on the summer mean 850 hPa wind (vectors; unit: m/s), 850 hPa vorticity (anomalies significant above 95% and 90% confidence level are shaded with dark and shallow) and 500 hPa geopontential height during 1950–2018
Red and blue lines denote the multi-year mean western Pacific subtropical high and superimposed the regressed anomalies on it

图 7 将1950–2018年期间夏季平均西北太平洋局地(120°E~180°平均)经向环流回归到晚春风暴轴位置指数(a)以及晚春AO指数(b)的分布型
等值线间隔为0.25×10⁻² Pa/s,深、浅色阴影分别表示通过95%、90%信度检验的区域
Fig. 7 Regression distributions of the late spring strom track position index (a), AO index (b) on the summer mean vertical motion over western North Pacific local Hadley cell (120°E–180° average)
Contour interval is 0.25×10⁻² Pa/s. Heavy and light shadings denote the regions at the 99% and 95% confidence levels, respectively

图 8 1950–2018年期间晚春AO指数与同期海表温度指数场的相关分布(等值线;间隔:0.15)(a),标准化的AO指数(红色实线)与热带大西洋关键区海表温度指数(蓝色实线)的年际变化序列(b)以及两个序列之间的滑动相关系数(31 a滑动窗口,灰色阴影)(c)
a中深、浅色阴影分别表示通过95%、90%信度检验的区域。c中蓝色水平线表示95%信度水平
Fig. 8 Correlation of the late spring AO index and the simultaneous SST (contours; interval: 0.15) (a), normalized time series of the AO index (red line) and northern tropical Atlantic SST (blue line) (b) and the 31 a sliding correlations (grey shadings) between the two series (c) during 1950−2018
Heavy and light shadings in a denote the regions at the 95% and 90% confidence levels, respectively. The horizontal blue line in c indicates the 95% confidence level
-
[1] Chen Guanghua, Tam C Y. Different impacts of two kinds of Pacific Ocean warming on tropical cyclone frequency over the western North Pacific[J]. Geophysical Research Letters, 2010, 37(1): L01803. [2] Zhan Ruifen, Wang Yuqing, Lei Xiaotu. Contributions of ENSO and east Indian Ocean SSTA to the interannual variability of Northwest Pacific tropical cyclone frequency[J]. Journal of Climate, 2011, 24(2): 509−521. [3] Cao Xi, Chen Shangfeng, Chen Guanghua, et al. Intensified impact of northern tropical Atlantic SST on tropical cyclogenesis frequency over the western North Pacific after the late 1980s[J]. Advances in Atmospheric Sciences, 2016, 33(8): 919−930. [4] 吴胜安, 李涛, 孔海江. 夏季西北太平洋台风生成数的敏感性因子[J]. 热带气象学报, 2011, 27(6): 797−804. doi: 10.3969/j.issn.1004-4965.2011.06.002Wu Sheng’an, Li Tao, Kong Haijiang. Sensitivity factors for typhoon genesis over the western North Pacific during July−September[J]. Journal of Tropical Meteorology, 2011, 27(6): 797−804. doi: 10.3969/j.issn.1004-4965.2011.06.002 [5] Wang Huijun, Sun Jianqi, Fan Ke. Relationships between the North Pacific Oscillation and the typhoon/hurricane frequencies[J]. Science in China Series D: Earth Sciences, 2007, 50(9): 1409−1416. [6] 崔绚, 周波涛, 范可. 卑尔根气候模式中亚洲−太平洋涛动和影响西北太平洋热带气旋频数的环流背景的关系[J]. 气候与环境研究, 2010, 15(2): 120−128.Cui Xuan, Zhou Botao, Fan Ke. Linkage between Asian-Pacific oscillation and the large-scale atmospheric circulations related to the tropical cyclone frequency over the western North Pacific in Bergen climate model[J]. Climatic and Environmental Research, 2010, 15(2): 120−128. [7] Choi K S, Cha Yumi, Kang S D, et al. Influence of the Arctic Oscillation on the TC activity around Taiwan[J]. Theoretical and Applied Climatology, 2014, 116(3/4): 695−706. [8] 周群, 张润宇. 2017年7月西北太平洋热带气旋活动特征及其与北极涛动的联系[J]. 海洋预报, 2018, 35(4): 1−7. doi: 10.11737/j.issn.1003-0239.2018.04.001Zhou Qun, Zhang Runyu. Characteristic of tropical cyclone activity over the western North Pacific in July 2017 and its link to the arctic oscillation[J]. Marine Forecasts, 2018, 35(4): 1−7. doi: 10.11737/j.issn.1003-0239.2018.04.001 [9] Zhou Botao, Cui Xuan. Interdecadal change of the linkage between the North Atlantic Oscillation and the tropical cyclone frequency over the western North Pacific[J]. Science China Earth Sciences, 2014, 57(9): 2148−2155. [10] 高建芸, 吕心艳, 张秀芝, 等. 南海−西北太平洋季风槽中热带气旋群发的研究Ⅱ. 影响机制研究[J]. 海洋学报, 2011, 33(3): 28−37.Gao Jianyun, Lü Xinyan, Zhang Xiuzhi, et al. Research on the cluster of tropical cyclogenesis in the South China Sea−western North Pacific monsoon trough[J]. Haiyang Xuebao, 2011, 33(3): 28−37. [11] 于玉斌. 冷空气影响热带气旋发生发展的研究进展[J]. 海洋学报, 2012, 34(3): 173−178.Yu Yubin. Research advances of cold air impacts on the tropical cyclone genesis and development[J]. Haiyang Xuebao, 2012, 34(3): 173−178. [12] Thompson D W J, Wallace J M. The Arctic Oscillation signature in the wintertime geopotential height and temperature fields[J]. Geophysical Research Letters, 1998, 25(9): 1297−1300. [13] Gong Daoyi, Wang Shaowu, Zhu Jinhong. East Asian winter monsoon and Arctic Oscillation[J]. Geophysical Research Letters, 2001, 28(10): 2073−2076. [14] Chen Wen, Yang Song, Huang Ronghui. Relationship between stationary planetary wave activity and the East Asian winter monsoon[J]. Journal of Geophysical Research, 2005, 110(14): D14110. [15] Chen Wen, Zhou Qun. Modulation of the Arctic Oscillation and the East Asian winter climate relationships by the 11-year solar cycle[J]. Advances in Atmospheric Sciences, 2012, 29(2): 217−226. [16] Gong Daoyi, Yang Jing, Kim S J, et al. Spring Arctic Oscillation-East Asian summer monsoon connection through circulation changes over the western North Pacific[J]. Climate Dynamics, 2011, 37(11): 2199−2216. [17] Wu Zhiwei, Wang Bin, Li Jianping, et al. An empirical seasonal prediction model of the East Asian summer monsoon using ENSO and NAO[J]. Journal of Geophysical Research Atmospheres, 2009, 114(D18): D18120. [18] Gu Wei, Li Chongyin, Li Weijing, et al. Interdecadal unstationary relationship between NAO and East China’s summer precipitation patterns[J]. Geophysical Research Letters, 2009, 36(13): L13702. [19] Tian Baoqiang, Fan Ke. Relationship between the late spring NAO and summer extreme precipitation frequency in the middle and lower reaches of the Yangtze River[J]. Atmospheric and Oceanic Science Letters, 2012, 5(6): 455−460. [20] 龚道溢. 北极涛动对东亚夏季降水的预测意义[J]. 气象, 2003, 29(6): 3−6. doi: 10.3969/j.issn.1000-0526.2003.06.001Gong Daoyi. Arctic Oscillations’s significance for prediction of East Asian summer monsoon rainfall[J]. Meteorological Monthly, 2003, 29(6): 3−6. doi: 10.3969/j.issn.1000-0526.2003.06.001 [21] Gong Daoyi, Ho C H. Arctic Oscillation signals in the East Asian summer monsoon[J]. Journal of Geophysical Research: Atmospheres, 2003, 108(D2): 4066. [22] Choi K S, Kang S D, Kim H D. Possible relationship between North Korean total rainfall and Arctic Oscillation in May[J]. Theoretical and Applied Climatology, 2013, 112(3/4): 483−494. [23] 张乐英, 徐海明, 施宁. 春季北极涛动对盛夏长江流域地表气温的影响[J]. 大气科学, 2015, 39(5): 1049−1058.Zhang Leying, Xu Haiming, Shi Ning. Influence of the spring Arctic Oscillation on midsummer surface air temperature over the Yangtze River valley[J]. Chinese Journal of Atmospheric Sciences, 2015, 39(5): 1049−1058. [24] Chen Shangfeng, Yu Bin, Chen Wen. An analysis on the physical process of the influence of AO on ENSO[J]. Climate Dynamics, 2014, 42(3/4): 973−989. [25] Chen Shangfeng, Yu Bin, Chen Wen. An interdecadal change in the influence of the spring Arctic Oscillation on the subsequent ENSO around the early 1970s[J]. Climate Dynamics, 2015, 44(3/4): 1109−1126. [26] Zhou Shuntai, Miller A J. The interaction of the Madden–Julian oscillation and the Arctic oscillation[J]. Journal of Climate, 2005, 18(1): 143−159. [27] Choi K S, Byun H R. Possible relationship between western North Pacific tropical cyclone activity and Arctic Oscillation[J]. Theoretical and Applied Climatology, 2010, 100(3/4): 261−274. [28] Choi K S, Wu C C, Byun H R. Possible connection between summer tropical cyclone frequency and spring Arctic Oscillation over East Asia[J]. Climate Dynamics, 2012, 38(11/12): 2613−2629. [29] Cao Xi, Chen Shangfeng, Chen Guanghua, et al. On the weakened relationship between spring Arctic Oscillation and following summer tropical cyclone frequency over the western North Pacific: a comparison between 1968−1986 and 1989−2007[J]. Advances in Atmospheric Sciences, 2015, 32(10): 1319−1328. [30] 黄荣辉, 皇甫静亮, 刘永, 等. 西太平洋暖池对西北太平洋季风槽和台风活动影响过程及其机理的最近研究进展[J]. 大气科学, 2016, 40(5): 877−896.Huang Ronghui, Huangfu Jingliang, Liu Yong, et al. Progress in recent research on the processes and physical mechanisms involved in the influence of the western Pacific warm pool on the monsoon trough and tropical cyclone activity over the western North Pacific[J]. Chinese Journal of Atmospheric Sciences, 2016, 40(5): 877−896. [31] 张庆红, 郭春蕊. 热带气旋生成机制的研究进展[J]. 海洋学报, 2008, 30(4): 1−11.Zhang Qinghong, Guo Chunrui. Overview of the studies on tropical cyclone genesis[J]. Haiyang Xuebao, 2008, 30(4): 1−11. [32] Blackmon M L. A climatological spectral study of the 500 mb geopotential height of the Northern hemisphere[J]. Journal of the Atmospheric Sciences, 1976, 33(8): 1607−1623. [33] 袁超, 徐海明. 春季北太平洋风暴轴的年际与年代际变化特征及其与太平洋海温异常的关系[J]. 气象学报, 2016, 74(6): 860−875.Yuan Chao, Xu Haiming. Inter-annual and inter-decadal variability of the spring storm track over the North Pacific and its association with SST anomalies[J]. Acta Meteorologica Sinica, 2016, 74(6): 860−875. [34] Zhan Ruifen, Wang Yuqing, Wen Min. The SST gradient between the southwestern Pacific and the western Pacific warm pool: a new factor controlling the northwestern Pacific tropical cyclone genesis frequency[J]. Journal of Climate, 2013, 26(7): 2408−2415. [35] Huo Liwei, Guo Pinwen, Hameed S N, et al. The role of tropical Atlantic SST anomalies in modulating western North Pacific tropical cyclone genesis[J]. Geophysical Research Letters, 2015, 42(7): 2378−2384. [36] Wang Lei. Contrasting two spring SST predictors for the number of western North Pacific tropical cyclones[J]. Atmospheric and Oceanic Science Letters, 2016, 9(6): 420−427. -

 下载:
下载:
计量
- 文章访问数: 604
- HTML全文浏览量: 135
- PDF下载量: 43
- 被引次数: 0
