

Surplus production model of settled species based on stock enhancement and its simulation analyses
-
摘要: 为应对渔业资源的日益衰退,增殖放流成为了目前补充资源、维持资源可持续利用的主要手段之一。增殖放流实施后,渔业资源的可持续特征是学者们普遍关心,却又无法使用传统剩余产量模型有效解决的问题。本研究基于传统的Schaefer剩余产量模型,提出了一个适用于增殖放流情况下的剩余产量模型(增殖剩余产量模型),模拟分析了不同增殖放流和捕捞策略对模型的影响。该模型的形式与Schaefer剩余产量模型相似,但加入了描述增殖群体增长特征的参数—有效增殖率,以此来表示增殖放流的群体对产量产生的影响。结果显示,合理的增殖放流可以起到增加最大可持续产量的效果,使用增殖剩余产量模型能够得到合理的最大可持续产量等关键指标的估算结果。与无增殖放流情况相比,在增殖放流影响下,海域原存资源(海域原本存在的群体)达到最大可持续产量时所需的生物量较小,而可承受的捕捞努力量则有所增加。增殖剩余产量模型所反映的原存群体和增殖群体之间会产生抑制作用。在该作用影响下,不同增殖放流和捕捞策略会对模型的评估结果产生影响。与传统模型相比,该模型将增殖放流纳入最大可持续产量的评估过程,提高了增殖放流影响下最大可持续产量评估的准确性,可用于诸如海洋牧场等边界较清晰的海域内增殖定栖性种类最大可持续产量的估算。Abstract: In order to cope with the declining fishery resources, stock enhancement has become one of the main methods of restocking and maintaining the sustainable use of resources. After the implementation of enhancement, the sustainable characteristics of fishery resources are a problem that scholars generally care about, but can not be effectively solved by using traditional surplus production models. Based on the traditional Schaefer surplus yield model, this study proposed a surplus production model (enhancement surplus production model) suitable for the case of stock enhancement, and simulated and analyzed the effects of different enhancement and fishing strategies on the model. The form of this model is similar to the Schaefer surplus production model, but it adds a parameter describing the growth characteristics of the enhancement stock-the effective enhancement rate (e) to express the impact of the stock enhancement on the yield. The results show that reasonable enhancement quantity can increase the maximum sustainable yield (MSY), and the use of the enhancement surplus production model can obtain reasonable estimates of MSY and other key indicators. Compared with the non-enhancement situation, under the influence of stock enhancement, the biomass required to reach MSY (BMSY) is small, while the maximum sustainable fishing effort (EMSY) increased. Inhibition occurs between the existing stock (the stock that originally existed in the sea area) and the enhancement stock reflected in the enhancement surplus production model. Under the influence of this effect, different enhancement and fishing strategies will affect the assessment results of the model. Compared with the traditional model, this model assesses the MSY under the effect of stock enhancement, and improves the accuracy of the results, which can be used to estimate the MSY of enhancement species in well-defined sea areas such as marine ranching.
-
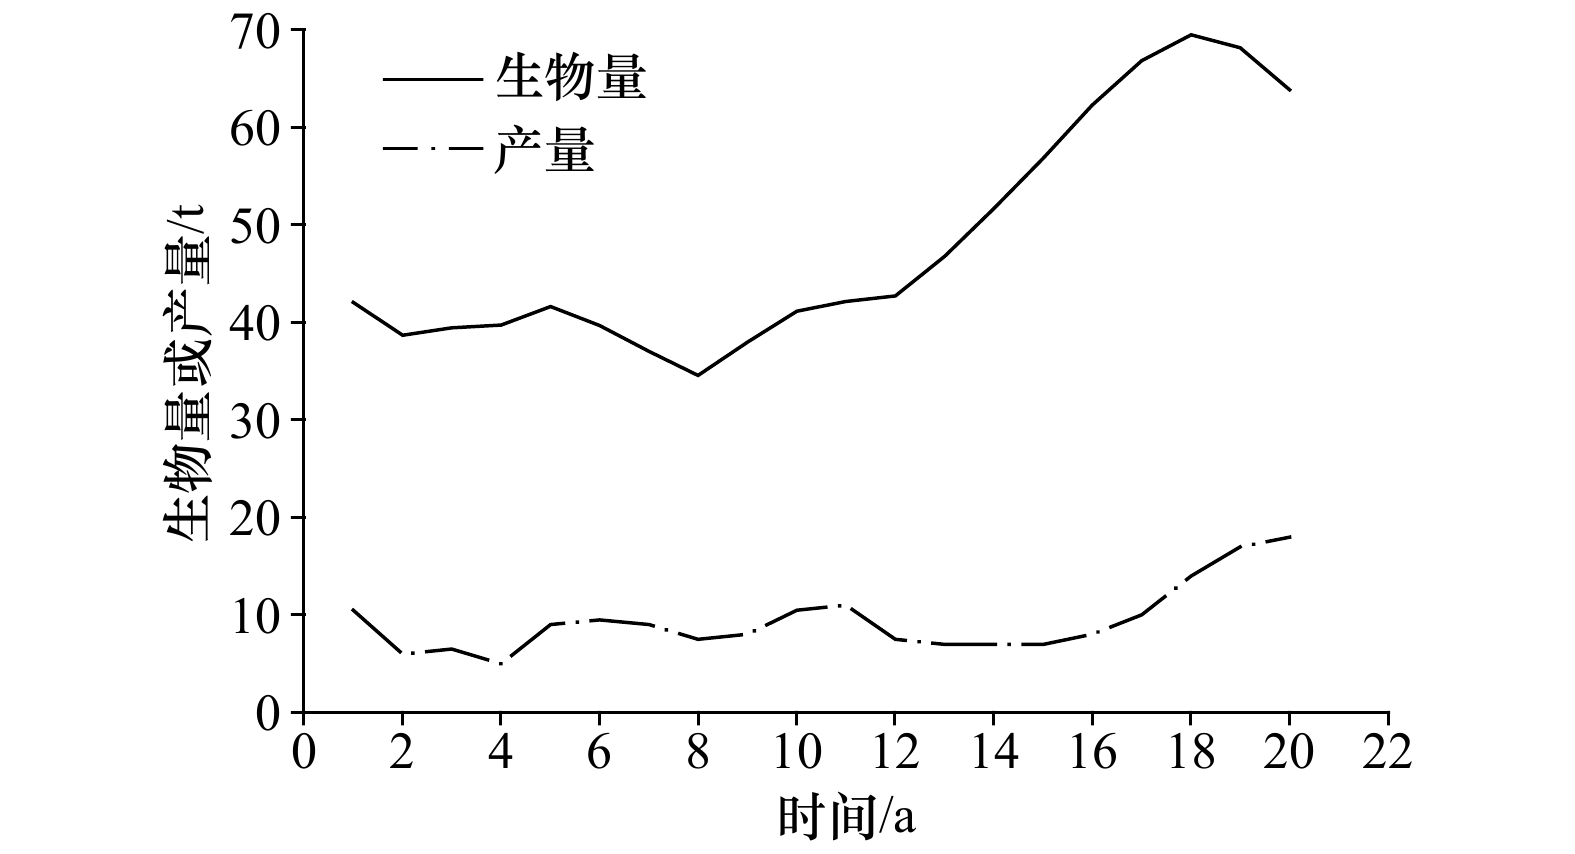
图 1 海洋牧场刺参(Stichopus japonicus)增殖模拟生物量和产量变化
Fig. 1 Simulation changes of biomass and yield of Stichopus japonicus enhancement in marine ranching
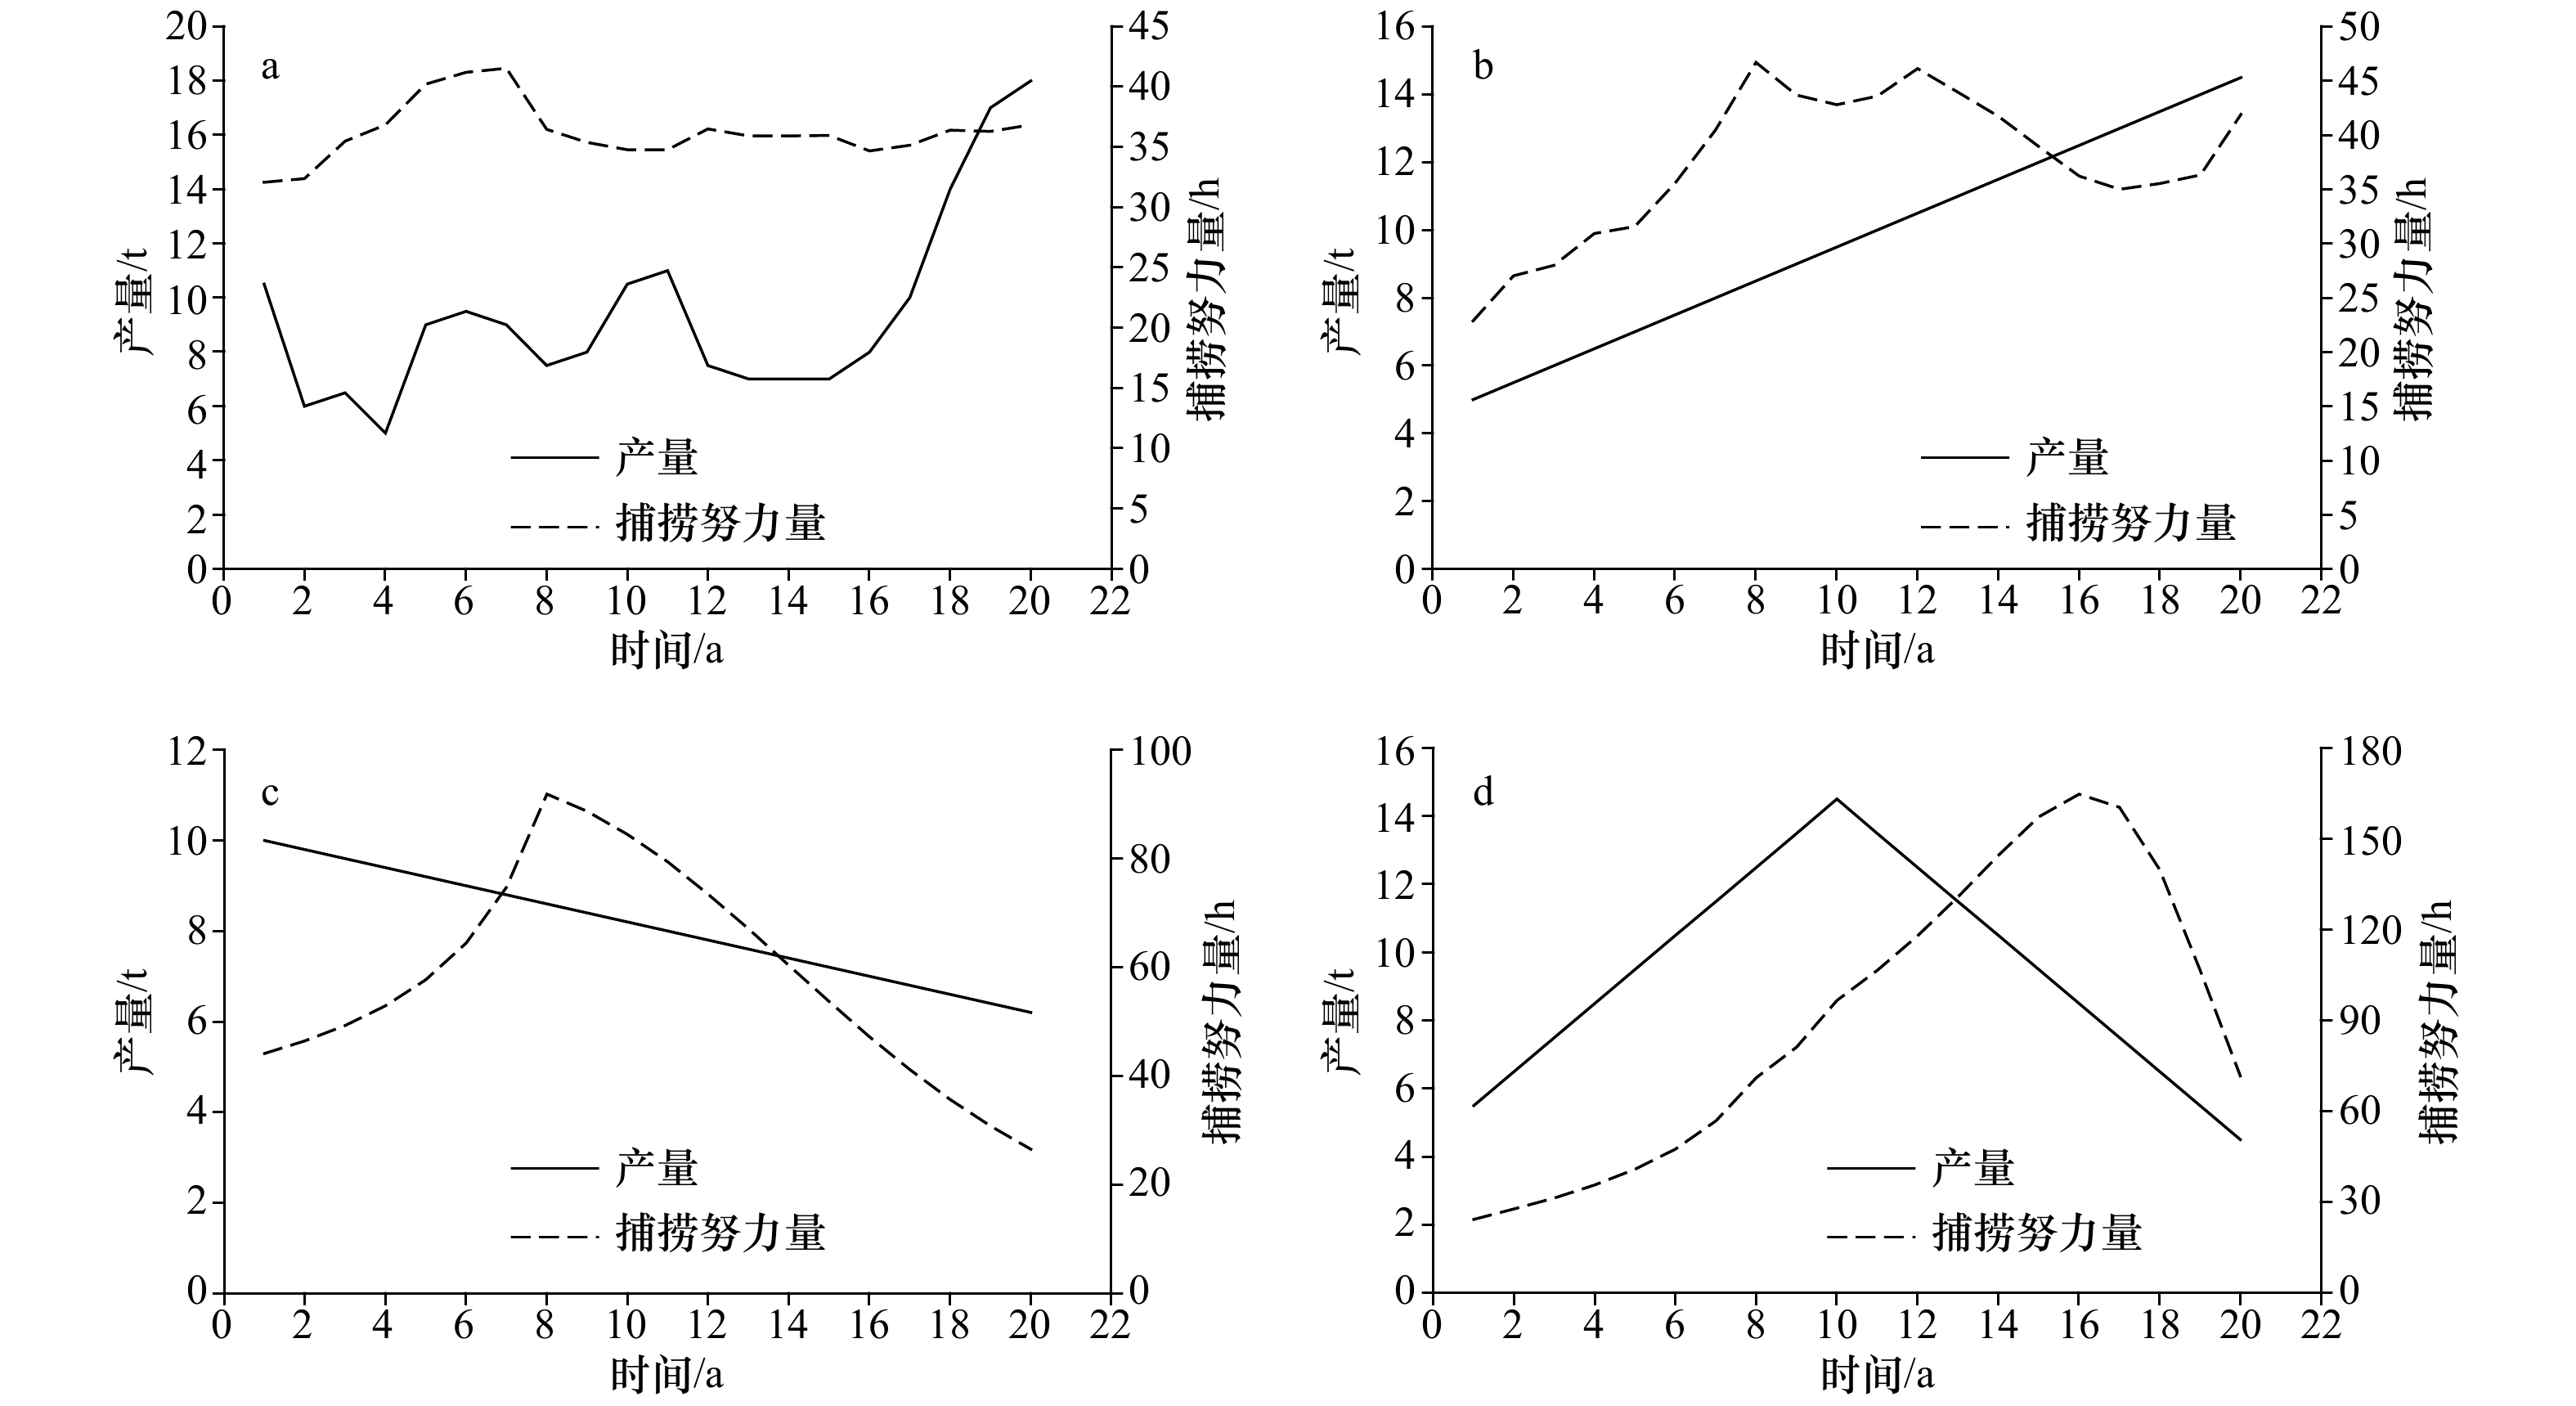
图 2 模拟4种捕捞努力量和产量的变化趋势
a. 现实情况;b. 产量持续增加;c. 产量持续下降;d. 产量先增后降(增殖放流在第8年开始)
Fig. 2 Trends of fishing effort and yield of the four simulated scenarios
a. Real situation; b. increasing yield; c. decreasing yield; d. yield increases first and then decreases (the stock enhancement is implemented from the 8th year)
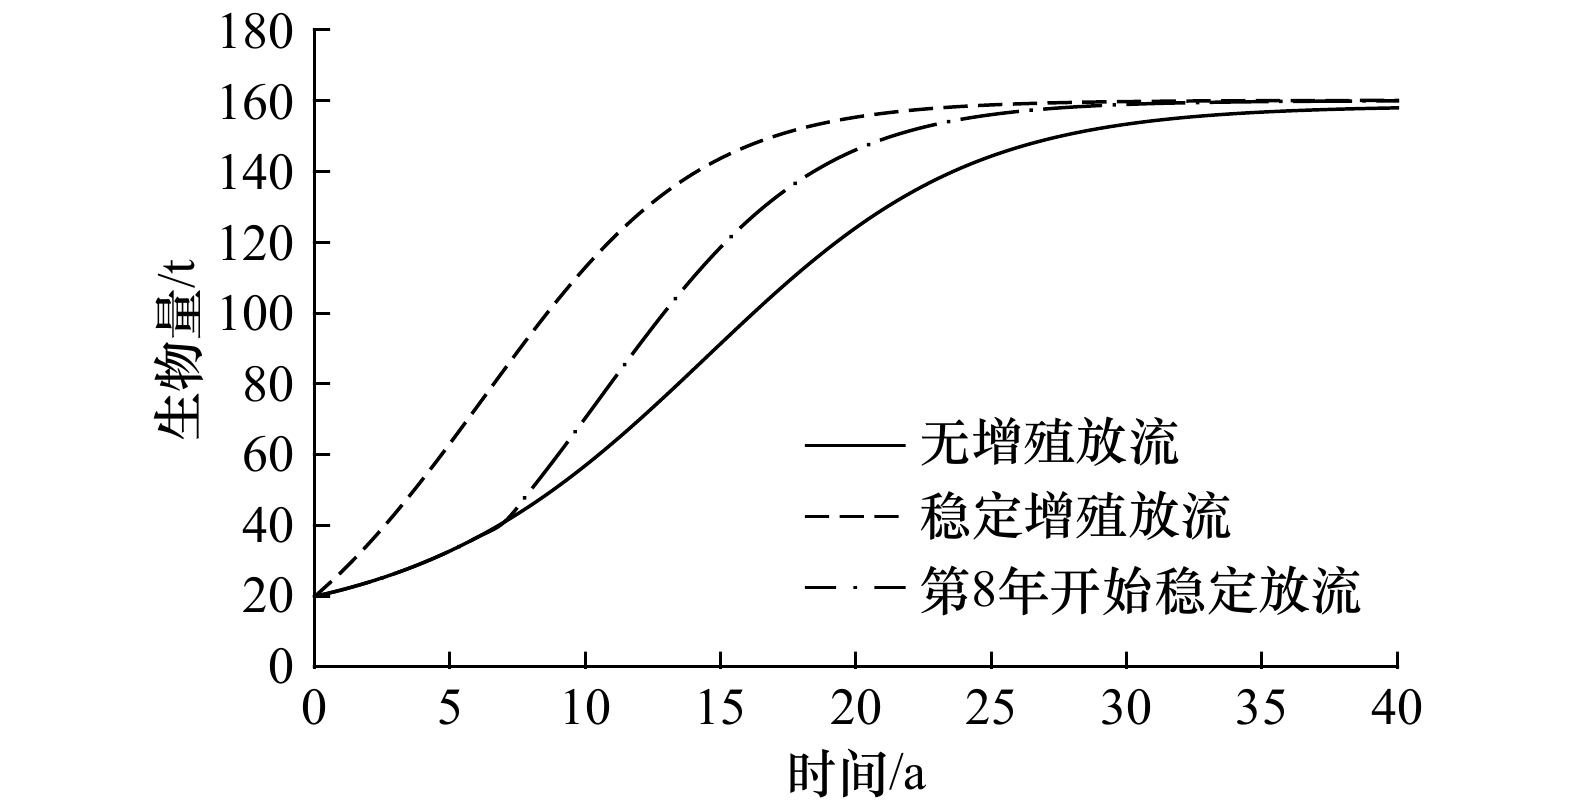
图 3 有无增殖放流情况下渔业资源群体逻辑斯蒂增长示意图
Fig. 3 Schematic diagram of logistic growth of fishery stock with or without enhancement
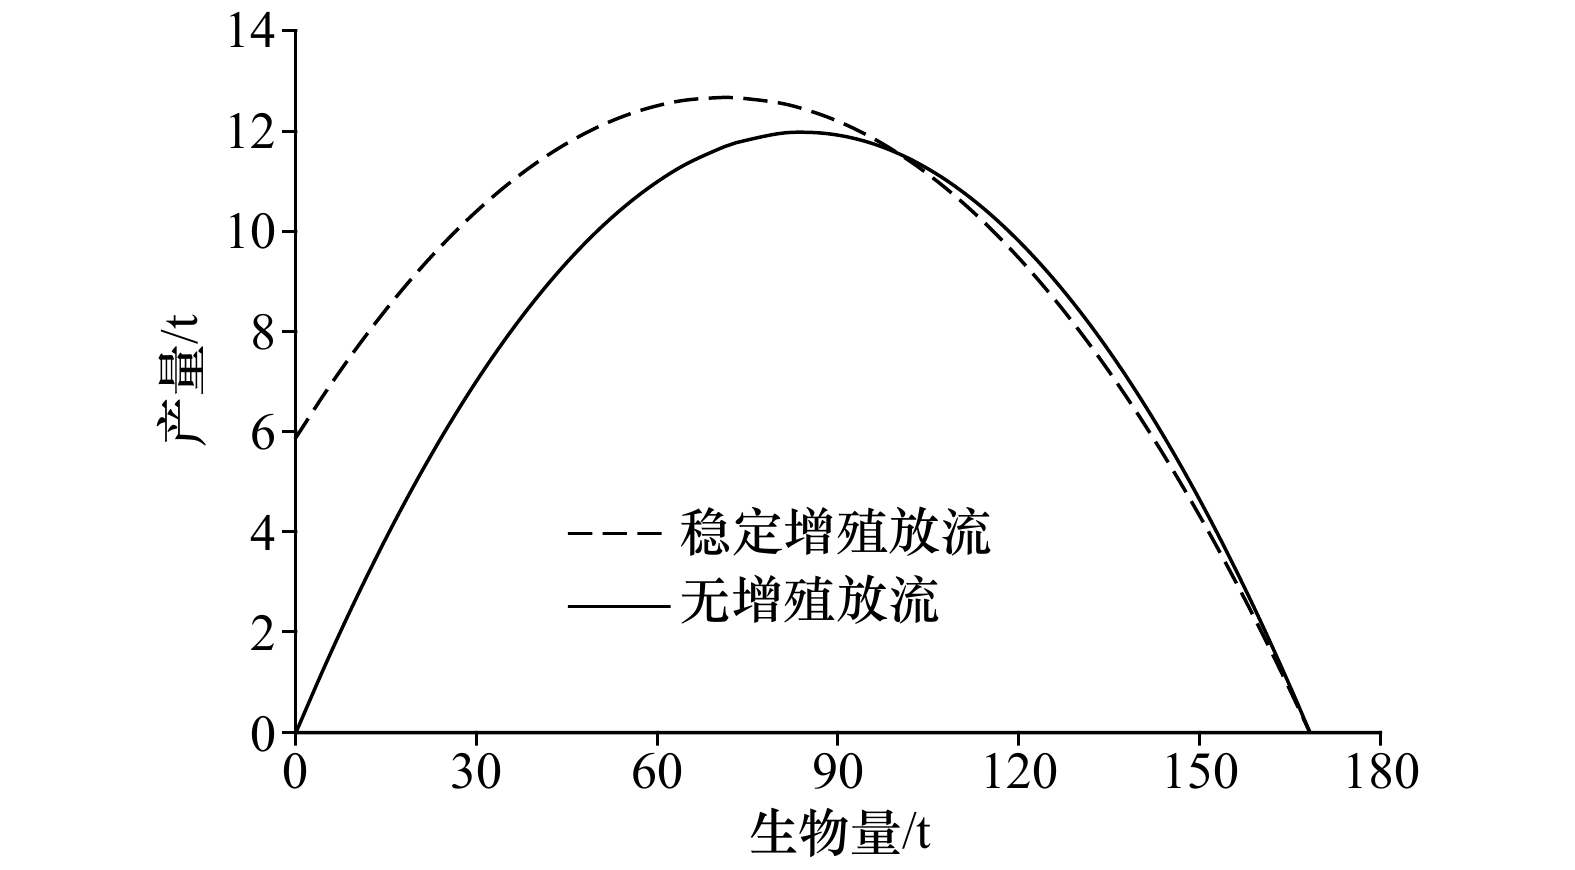
图 4 有无增殖放流情况下产量−生物量关系示意图
Fig. 4 Schematic diagram of the relationship of yield-biomass with or without enhancement
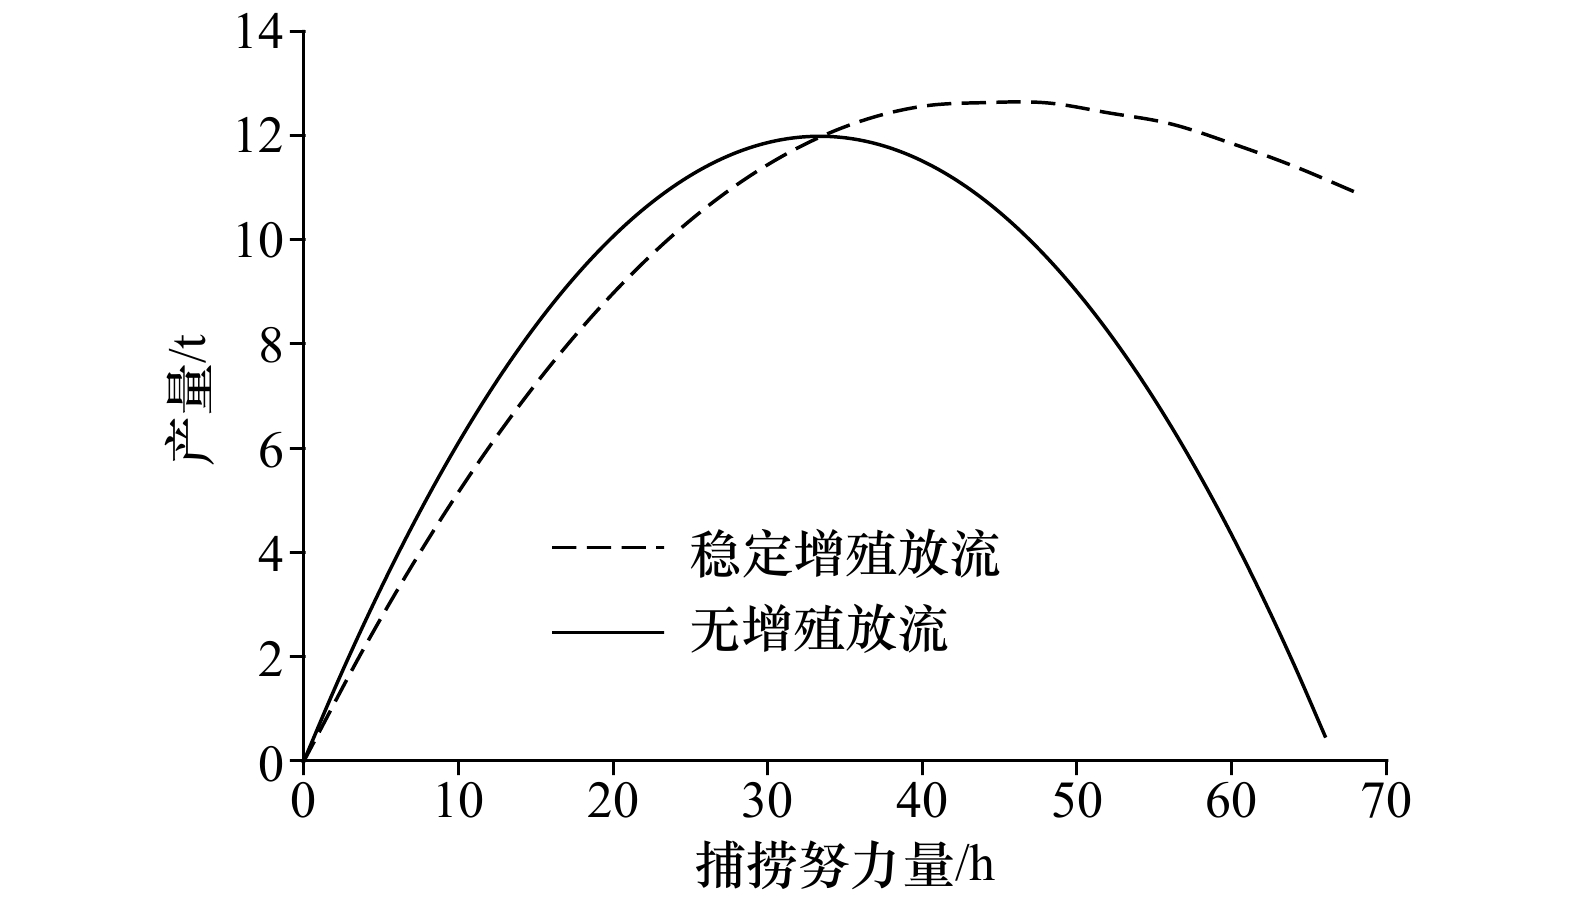
图 5 有无增殖放流情况下产量−捕捞努力量关系示意图
Fig. 5 Schematic diagram of the relationship of yield-fishing effort with or without enhancement
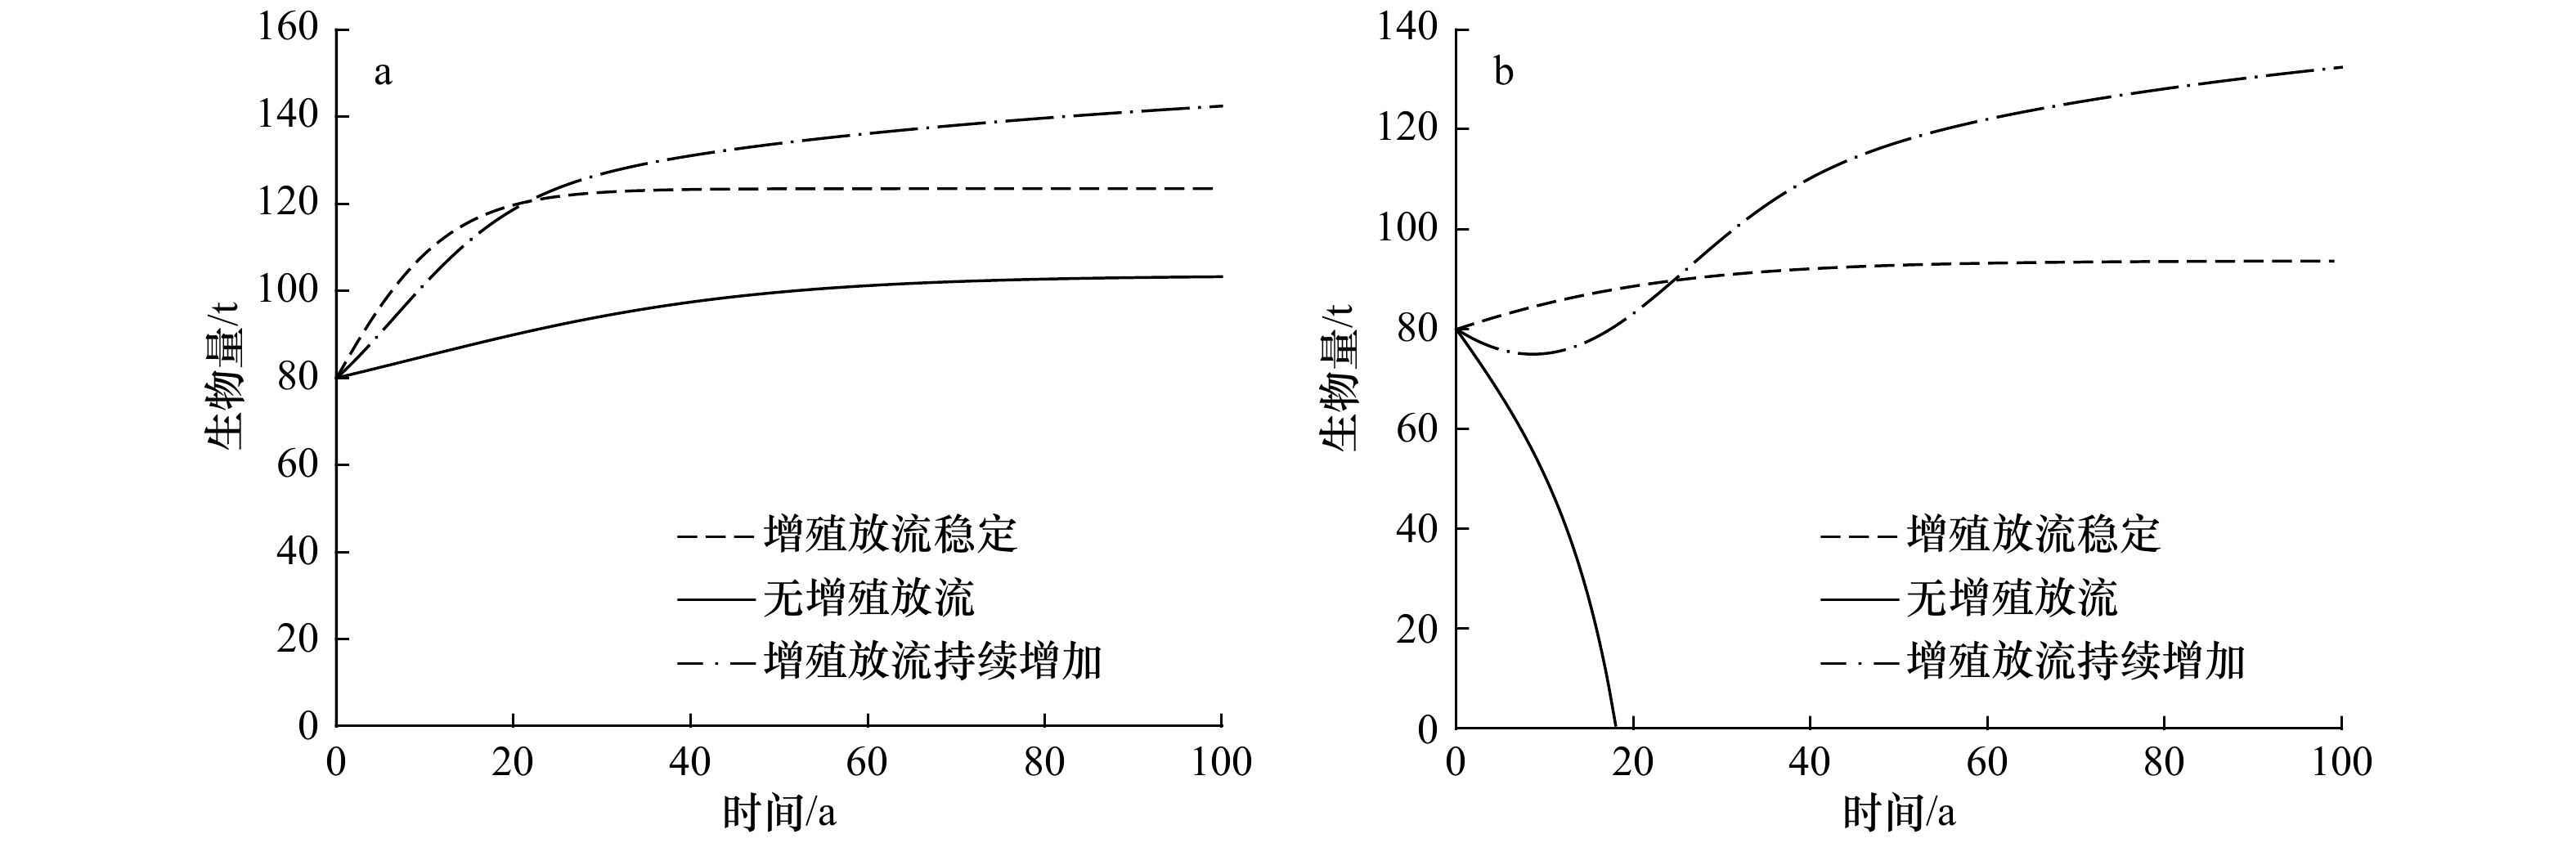
图 6 捕捞作用下不同增殖放流数量对渔业资源生物量的影响
a. 年产量等于9 t;b. 年产量等于12 t
Fig. 6 Effects of different stock enhancement numbers on fishery resource biomass under fishing
a. Annual yield equals to 9 t; b. annual yield equals to 12 t
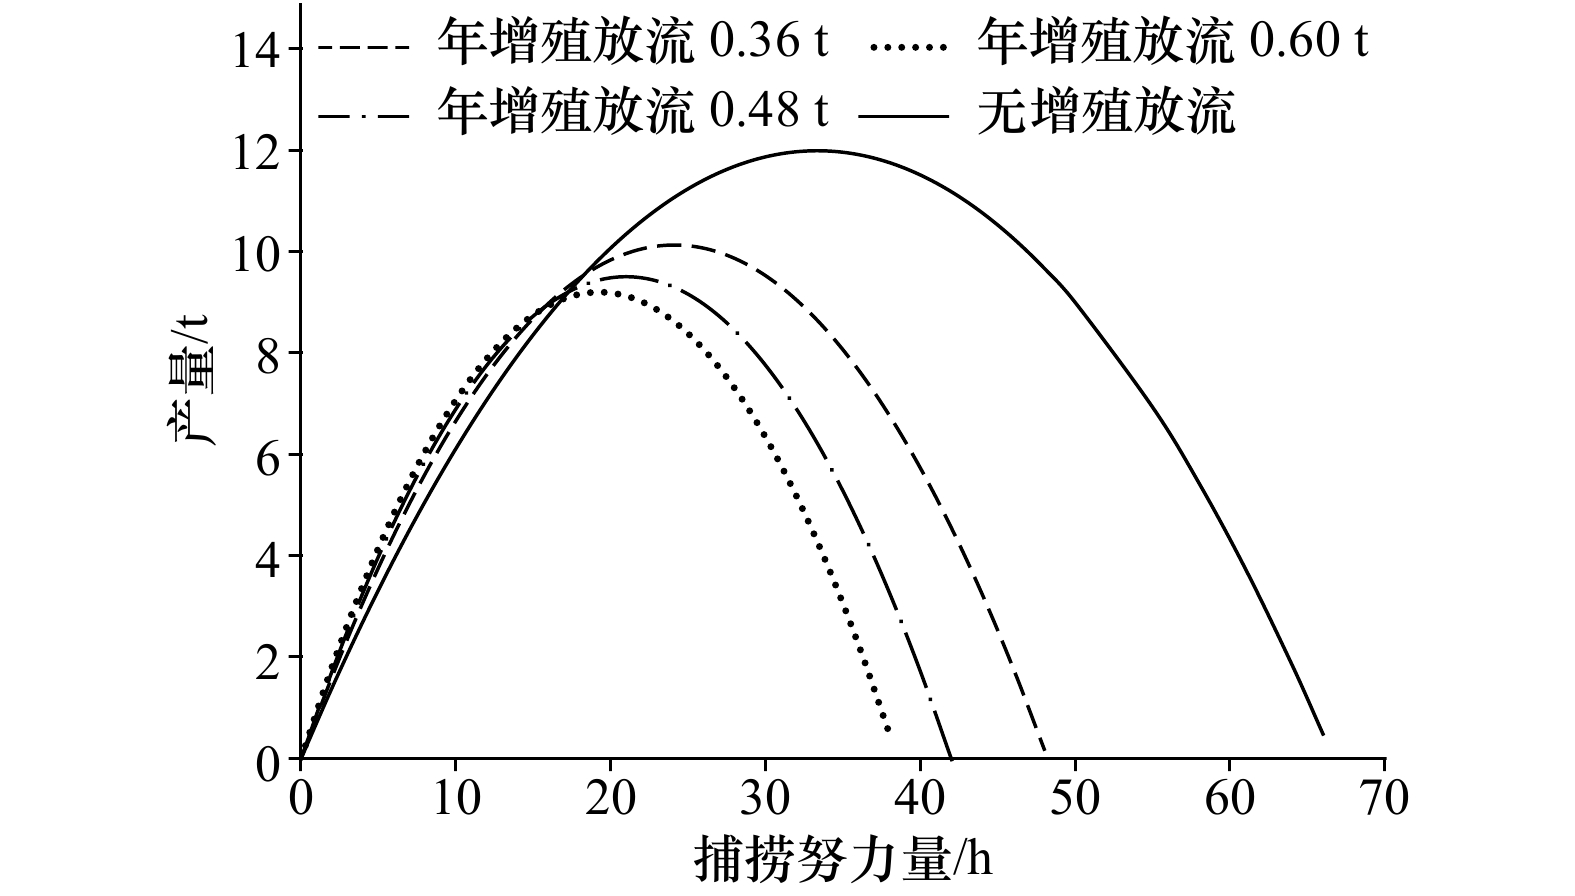
图 7 不同增殖放流数量对海域中原存渔业资源产量−捕捞努力量的影响
Fig. 7 The effects of different stock enhancement numbers on the relationship between yield-fishing effort for the fishery resources that original existed in the sea area
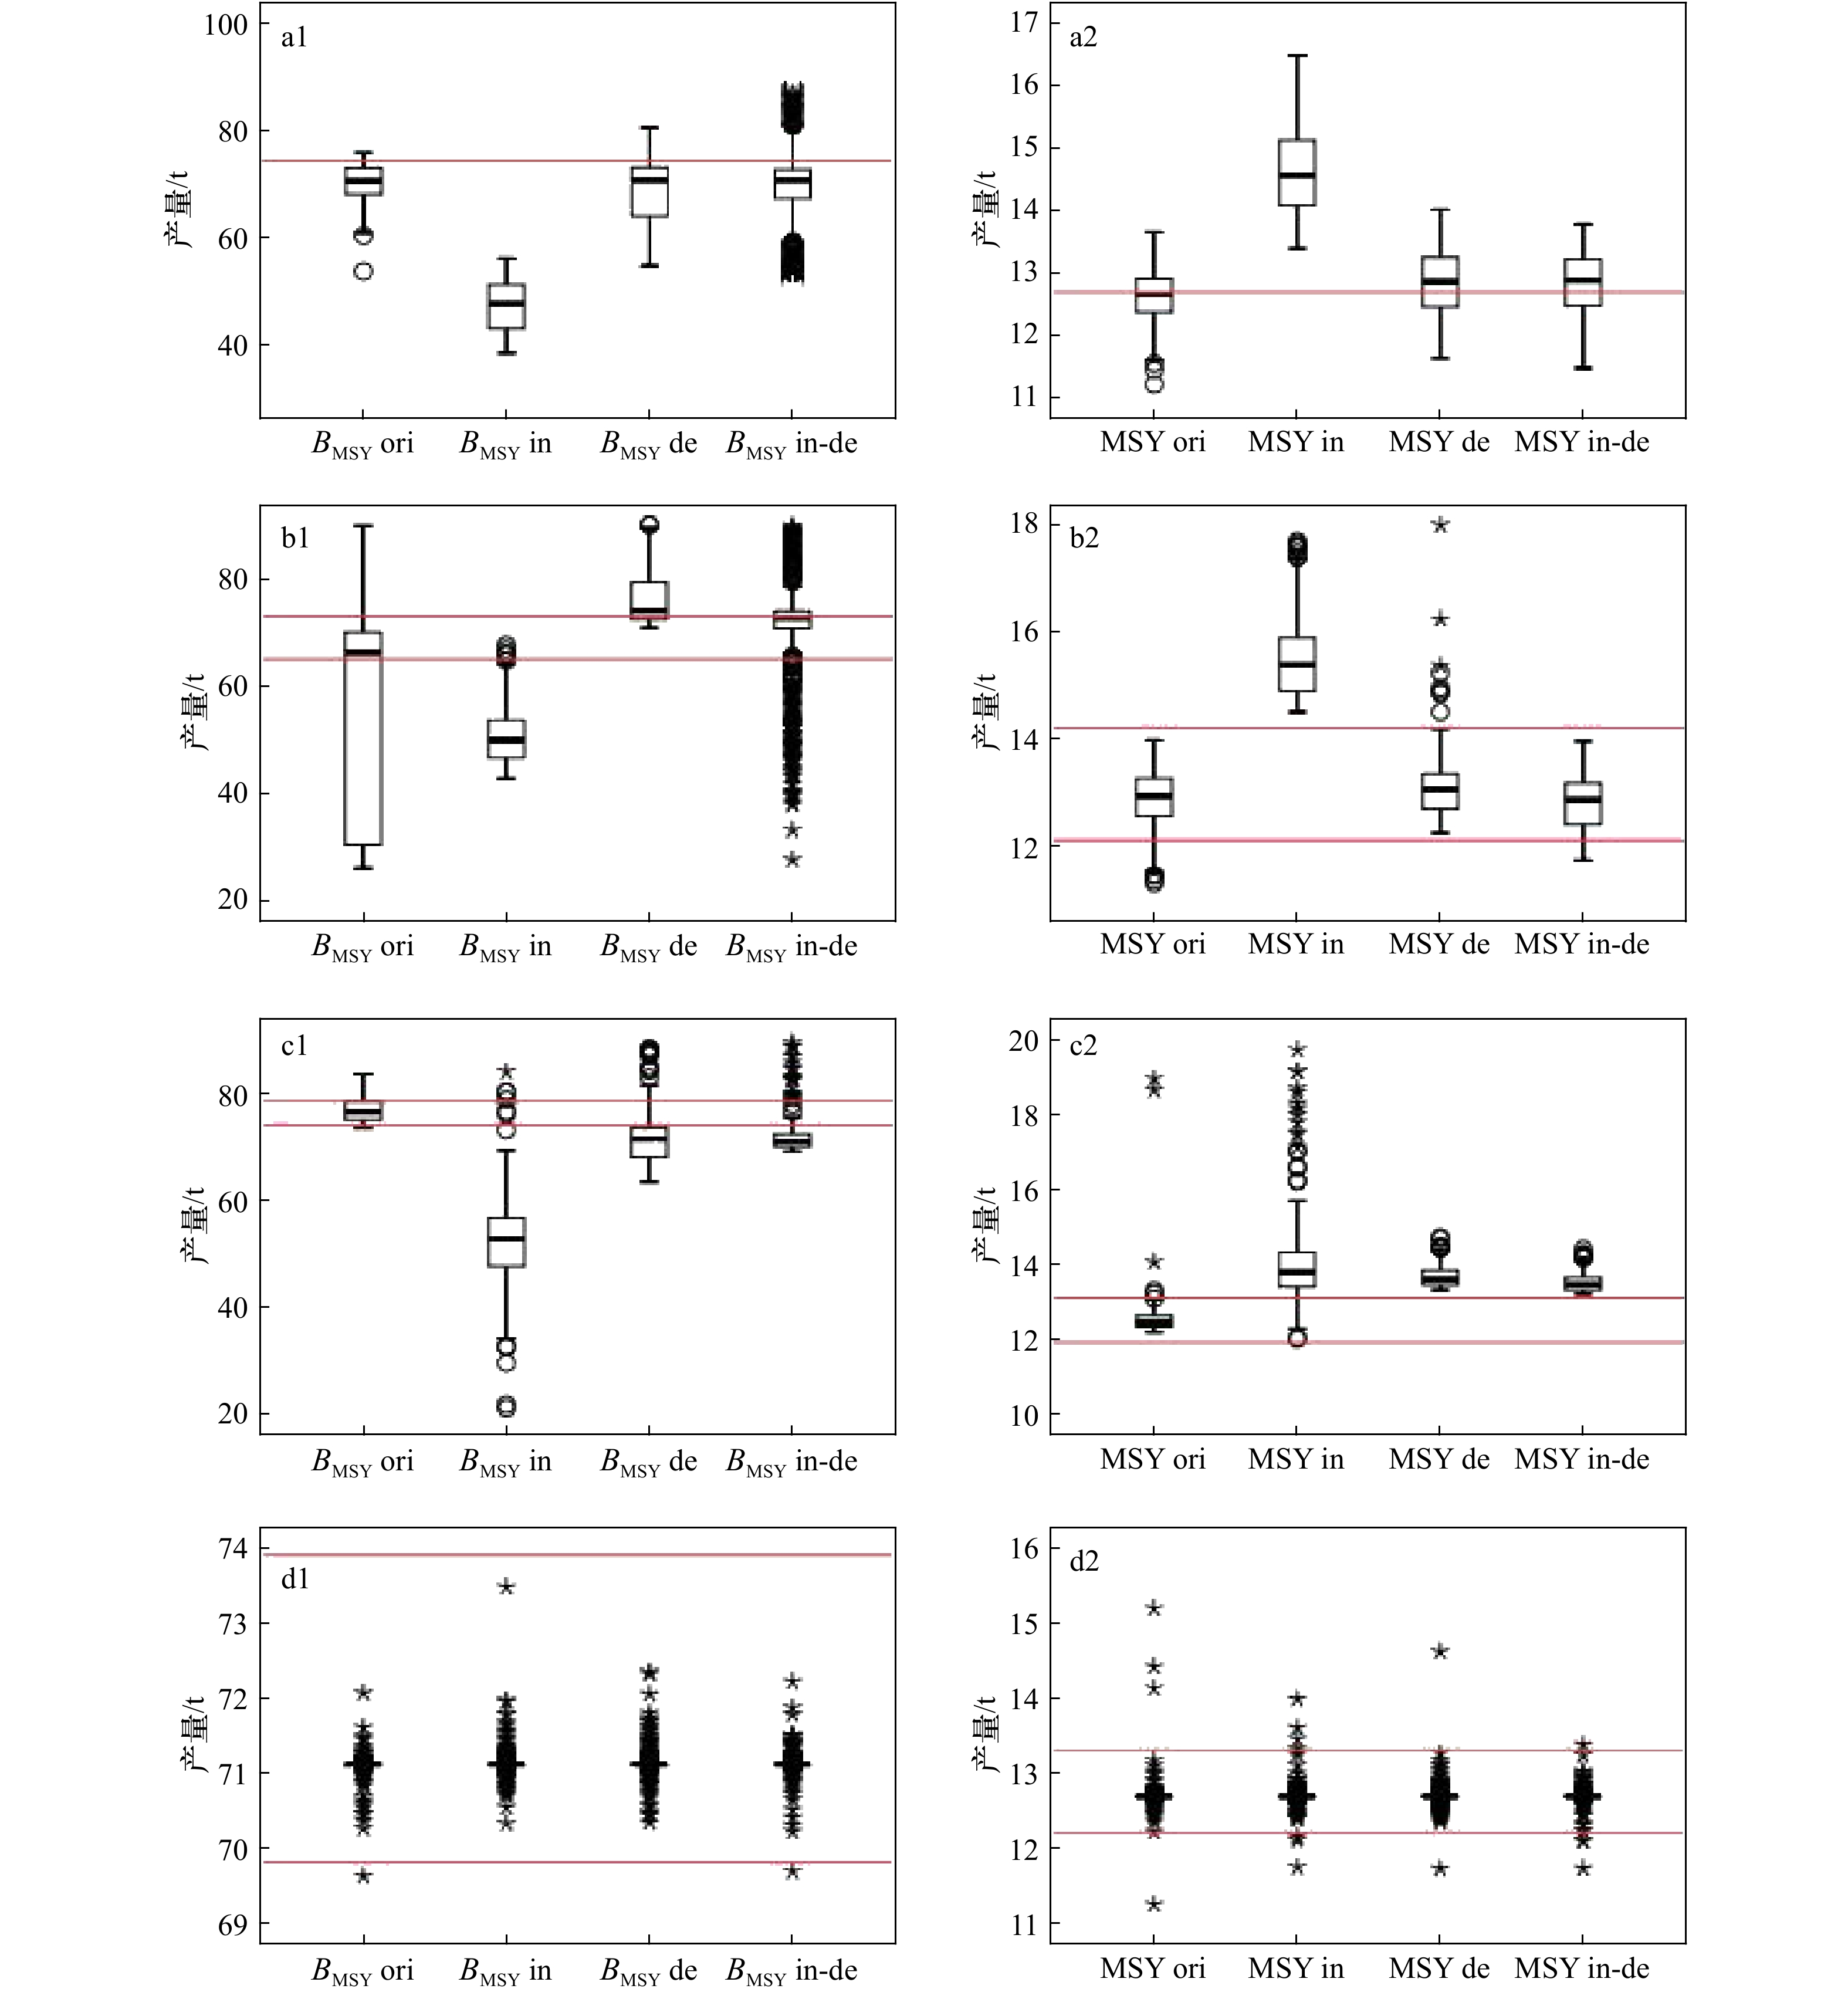
图 8 不同增殖和捕捞策略下BMSY(左)和MSY(右)的模拟估算结果
a. 增殖放流量稳定;b. 增殖放流量持续增加;c. 增殖放流量持续减少;d. 增殖放流量随机。横坐标中ori代表实际产量情况,in代表产量持续增加,de代表产量持续下降,in-de代表产量先增后降。箱子代表25%~75%的范围,箱内横线表示中值,圆圈表示离散值,星号表示极端值。横线表示真实值或真实值的上下限
Fig. 8 The simulation estimate results of BMSY (left) and MSY (right) under different stock enhancement and fishing strategies
a. Constant enhancement; b. increasing enhancement; c. decreasing enhancement; d. random enhancement. Ori, in, de and in-de in abscissa represent the actual situation of yield, increasing yield, decreasing yield and yield increase first then decrease, respectively. Boxes illustrate the interquartile range (25%−75% quantiles), and the line in the box represents the middle value, circle represents outlier, and asterisk represents extreme. Transverse lines represent the true value or the upper and lower limits of the true value
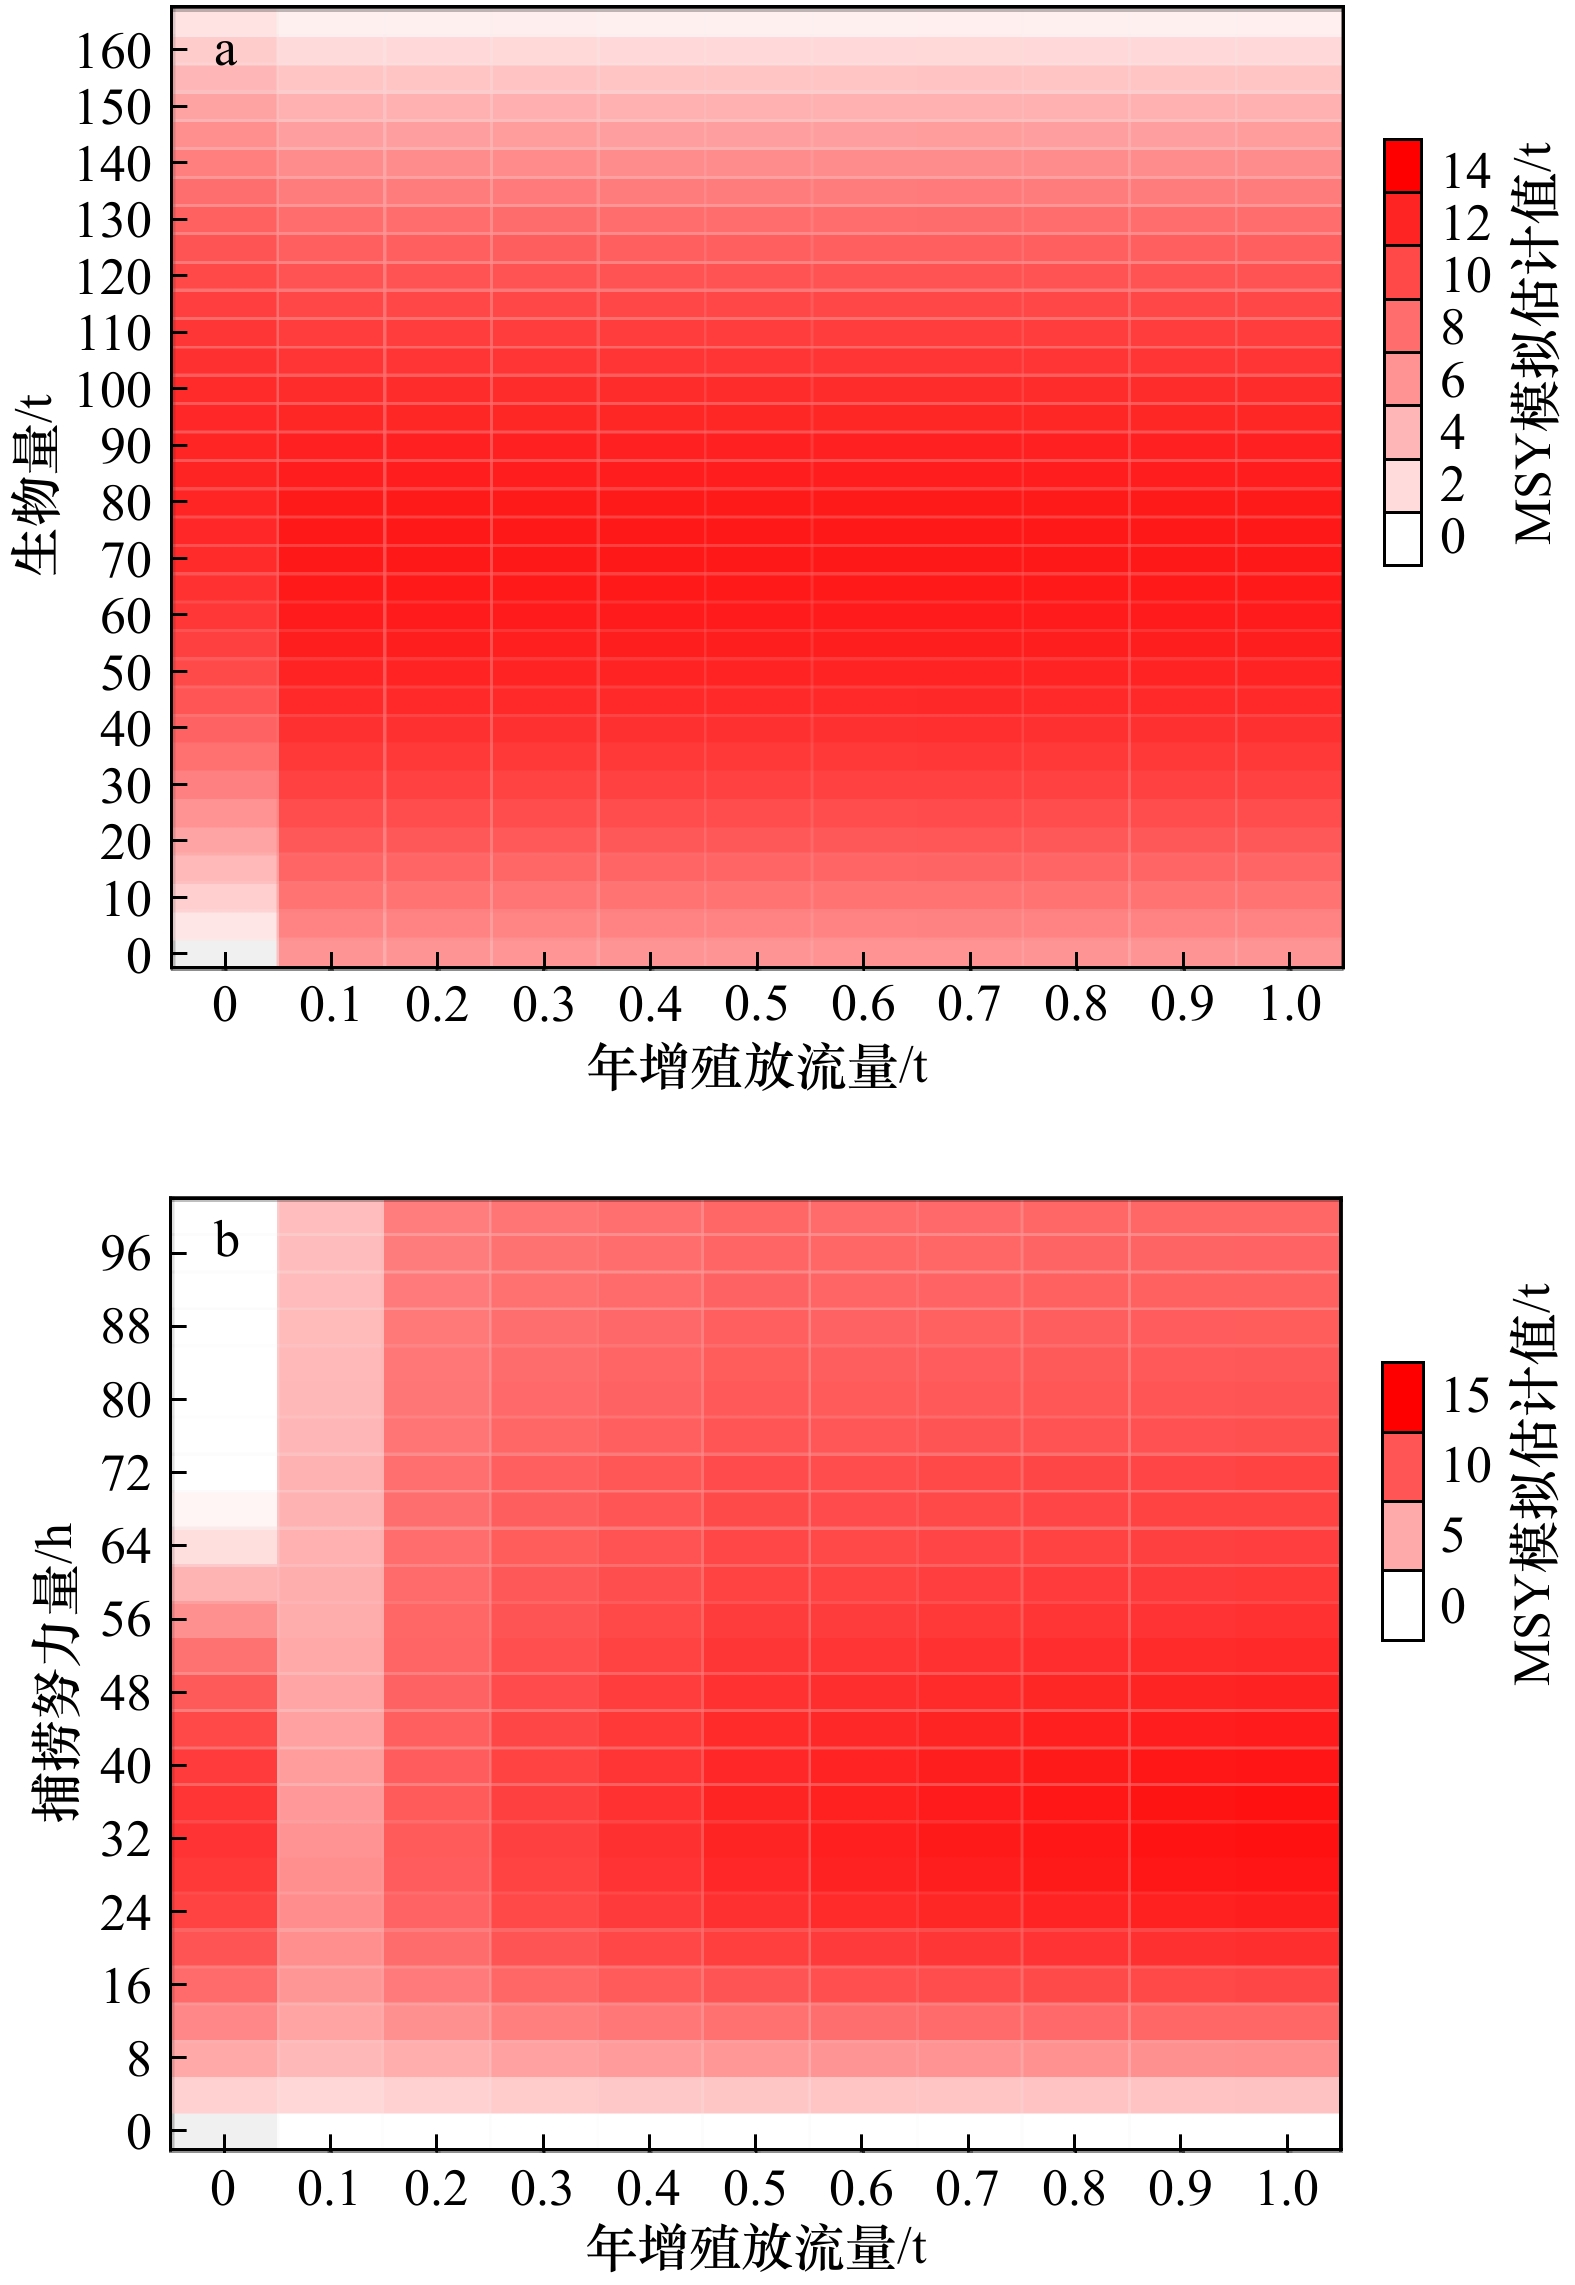
图 9 不同生物量和捕捞努力量与不同年增殖放流量水平组合下MSY的模拟估算值
a. 不同生物量与增殖放流量组合;b. 不同捕捞努力量与年增殖放流量组合
Fig. 9 The simulation estimates of MSY under combinations of different biomass and fishing effort levels with different stock enhancement levels
a. Combinations of different biomass with different stock enhancement levels; b. combinations of different fishing effort with stock enhancement levels
表 1 以刺参(Stichopus japonicus)增殖为基础的海洋牧场定栖性种类模拟参数
Tab. 1 Simulation parameters of Stichopus japonicus enhancement in marine ranching
增殖策略 参数名称 参数值 增殖放流量稳定 内禀增长率r 0.285 环境容纳量K 170 t 年增殖苗种量J 0.48 t,第8年开始增殖放流 有效增殖率e 0.245 苗种平均体重${\overline W_J}$ 2 g 成体平均体重${\overline W_a}$ 100 g 增殖放流量持续增加 内禀增长率r 0.219 环境容纳量K 170 t 年增殖苗种量J [0.36 t, 0.60 t],第8年开始均匀增加 有效增殖率e 0.294 苗种平均体重${\overline W_J}$ 2 g 成体平均体重${\overline W_a}$ 100 g 增殖放流量持续减少 内禀增长率r 0.241 环境容纳量K 170 t 年增殖苗种量J [0.60 t, 0.36 t],第8年开始均匀减少 有效增殖率e 0.177 苗种平均体重${\overline W_J}$ 2 g 成体平均体重${\overline W_a}$ 100 g 增殖放流量随机 内禀增长率r 0.226 环境容纳量K 170 t 年增殖苗种量J [0.40 t, 0.56 t],第8年开始随机增殖 有效增殖率e 0.245 苗种平均体重${\overline W_J}$ 2 g 成体平均体重${\overline W_a}$ 100 g 无增殖放流 内禀增长率r 0.285 环境容纳量K 170 t 年增殖苗种量J 0 注:参数值根据与专家交流的结果设定。  下载: 导出CSV
-
[1] Burden M, Fujita R. Better fisheries management can help reduce conflict, improve food security, and increase economic productivity in the face of climate change[J]. Marine Policy, 2019, 108: 103610. doi: 10.1016/j.marpol.2019.103610 [2] 唐启升. 我国专属经济区渔业资源增殖战略研究[M]. 北京: 海洋出版社, 2019.Tang Qisheng. Study on the Strategy of Fishery Resources Enhancement in China’s Exclusive Economic Zone[M]. Beijing: China Ocean Press, 2019. [3] 李忠义, 林群, 李娇, 等. 中国海洋牧场研究现状与发展[J]. 水产学报, 2019, 43(9): 1870−1880.Li Zhongyi, Lin Qun, Li Jiao, et al. Present situation and future development of marine ranching construction in China[J]. Journal of Fisheries of China, 2019, 43(9): 1870−1880. [4] Thiaw M, Gascuel D, Jouffre D, et al. A surplus production model including environmental effects: application to the Senegalese white shrimp stocks[J]. Progress in Oceanography, 2009, 83(1/4): 351−360. [5] Reid K B, Jiao Yan, Nudds T. State-space production models and graphical methods for assessing and communicating the status of the lake Nipigon whitefish (Coregonus clupeaformis) fishery[C]// Quebec City: American Fisheries Society 144th Annual Meeting. 2014. [6] Shibata Y, Yamada M, Wada T, et al. A surplus production model considering movements between two areas using spatiotemporal differences in cpue: application to sea ravens Hemitripterus villosus off Fukushima as a practical marine protected area after the nuclear accident[J]. Marine and Coastal Fisheries: Dynamics, Management, and Ecosystem Science, 2015, 7(1): 325−337. doi: 10.1080/19425120.2015.1050536 [7] 倪剑锋. 剩余产量模型在不同渔业中的研究[D]. 青岛: 中国海洋大学, 2003.Ni Jianfeng. The research on performances of surplus production models under different fishing scenarios[D]. Qingdao: Ocean University of China, 2003. [8] Schaefer M B. Some aspects of the dynamics of populations important to the management of the commercial marine fisheries[J]. Inter-American Tropical Tuna Commission Bulletin, 1954, 1(2): 23−56. [9] 王玉. 剩余产量模型的研究[D]. 青岛: 中国海洋大学, 2013.Wang Yu. Study of the surplus production models[D]. Qingdao: Ocean University of China, 2013. [10] Hilborn R, Walters C J. Quantitative Fisheries Stock Assessment: Choice, Dynamics and Uncertainty[M]. New York: Chapman and Hall, 1992. [11] Haddon M. Modelling and Quantitative Methods in Fisheries[M]. 2nd ed. New York: Chapman & Hall/CRC, 2011. [12] Quinn II T J, Deriso R B. Quantitative Fish Dynamics[M]. New York: Oxford University Press, 1999. [13] 张广文, 陈新军, 李纲. 东黄海鲐鱼生物经济模型及管理策略探讨[J]. 上海海洋大学学报, 2009, 18(4): 447−452.Zhang Guangwen, Chen Xinjun, Li Gang. Bio-economic model and its application of chub mackerel in the East China Sea and Yellow Sea[J]. Journal of Shanghai Ocean University, 2009, 18(4): 447−452. [14] 李纲, 陈新军. 夏季东海渔场鲐鱼产量与海洋环境因子的关系[J]. 海洋学研究, 2009, 27(1): 1−8. doi: 10.3969/j.issn.1001-909X.2009.01.001Li Gang, Chen Xinjun. Study on the relationship between catch of mackerel and environmental factors in the East China Sea in summer[J]. Journal of Marine Sciences, 2009, 27(1): 1−8. doi: 10.3969/j.issn.1001-909X.2009.01.001 [15] 李钢, 郑晓琼, 朱国平, 等. 基于水温因子的东、黄海鲐鱼剩余产量模型建立[J]. 上海海洋大学学报, 2011, 20(1): 108−113.Li Gang, Zheng Xiaoqiong, Zhu Guoping, et al. Establishment of surplus production model for chub mackerel (Scomber japonicus) in the East China Sea and Yellow Sea based on the sea surface temperature[J]. Journal of Shanghai Ocean University, 2011, 20(1): 108−113. [16] 张魁, 陈作志. 应用贝叶斯状态空间建模对东海带鱼的资源评估[J]. 中国水产科学, 2015, 22(5): 1015−1026.Zhang Kui, Chen Zuozhi. Using Bayesian state-space modelling to assessTrichiurus japonicus stock in the East China Sea[J]. Journal of Fishery Sciences of China, 2015, 22(5): 1015−1026. -

计量
- 文章访问数: 602
- HTML全文浏览量: 245
- PDF下载量: 34
- 被引次数: 0
