

Stock assessment for Atlantic yellowfin tuna based on Bayesian state-space production model
-
摘要: 黄鳍金枪鱼(Thunnus albacares)是全球远洋渔业的重要目标鱼种,要实现有效的管理,对其进行科学的资源评估是必不可少的。本文以大西洋黄鳍金枪鱼为研究对象,根据国际大西洋金枪鱼养护委员会的渔获量和单位捕捞努力量渔获量数据,使用贝叶斯状态空间模型进行资源评估,并探讨不同剩余产量函数和单位捕捞努力量渔获量数据对评估的影响。结果表明,使用美国、委内瑞拉、日本和中国台北4个船队的单位捕捞努力量渔获量数据及Fox剩余产量函数时模型拟合效果最佳。关键参数环境容纳量和内禀增长率的估计中值和95%置信区间分别为178 (140,229)×104 t和0.210(0.159,0.274);当前资源量为72.5×10⁴ t,最大可持续产量为13.7×10⁴ t时,种群既没有遭受资源型过度捕捞,也没有捕捞型过度捕捞发生。敏感性分析表明,当渔获量数据存在误报率(70%、80%、90%、110%、120%和130%)时,生物量的评估结果偏高,而捕捞死亡率的结果偏低,但种群均处于健康状态;预测分析显示,当总允许可捕量设为11×104 t时,资源在2024年前仍基本保持健康状态。本研究与国际大西洋金枪鱼养护委员会现有的评估结果基本一致,且模型较稳健,可以为管理决策提供建议。根据模型结果,建议总允许可捕量为11×104 t或更低,以使资源达到可持续开发水平。Abstract: Yellowfin tuna (Thunnus albacares) is an important fishing target for offshore fisheries worldwide. Stock assessment is essential for its fishery management of sustainable exploitation. According to catch and catch per unit effort (CPUE) data from the International Commission for Conservation of Atlantic Tunas (ICCAT), the Bayesian state space model was conducted to make stock assessment in an open environment (Just Another Bayesian Biomass Assessment) and to compare the effects of different surplus production forms and CPUE data on the assessment. The results showed that the model performed best with the Fox surplus production form and CPUE data of four fleets (United States, Venezuela, Japan and Chinese Taipei). The median and 95% confidence intervals for carrying capacity, intrinsic growth rate were 178 (140, 229)×104 t and 0.210 (0.159, 0.274), respectively. The current stock was not overfished (B/BMSY=1.109) and was not subject to overfishing (F/FMSY=0.893). Sensitivity analysis revealed that when the rates of reported catch divided by the actual catch were 70%, 80%, 90%, 110%, 120%, and 130%, the current biomass assessment results were higher with lower fishing rate, but the stock was still in a healthy status. When the total allowable catch (TAC) was set at 11×104 t, the stock would remain basically healthy until 2024. The results from this stock assessment is generally consistent with ICCAT's current stock assessment results, so it is recommended to set a TAC of 11×104 t to keep the stock status healthy and sustainable exploitation of this important fishery.
-
Key words:
- Atlantic Ocean /
- yellowfin tuna /
- stock assessment /
- surplus production model /
- sensitivity analysis
-
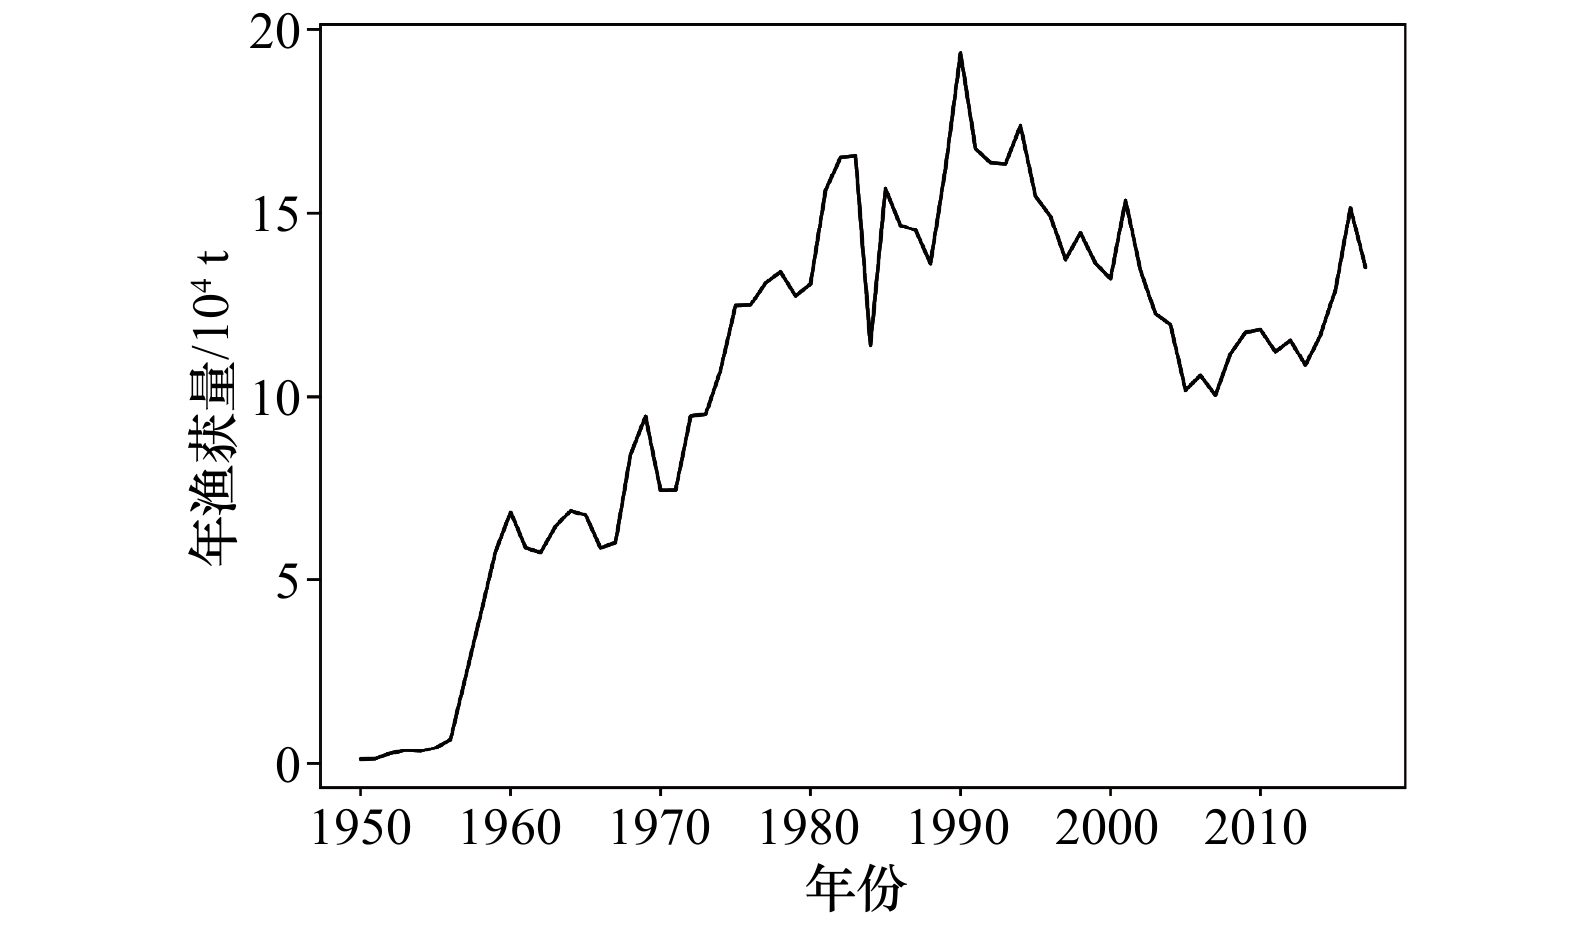
图 1 大西洋黄鳍金枪鱼1950−2017年的年渔获量
Fig. 1 The annual catch of Atlantic yellowfin tuna from 1950 to 2017

图 2 大西洋黄鳍金枪鱼JABBA模型S1−S8方案的CPUE指数趋势
黑色实线为模型预测的CPUE结果,阴影区域为其95%置信区间。彩色线段为各船队的CPUE数据
Fig. 2 Time-series of input CPUE of Atlantic yellowfin tuna and predicted CPUE of S1−S8 scenarios in JABBA
The solid black line represents the CPUE predicted by JABBA, and the shaded area is its 95% confidence interval. The colored lines are the CPUE data of each fleet
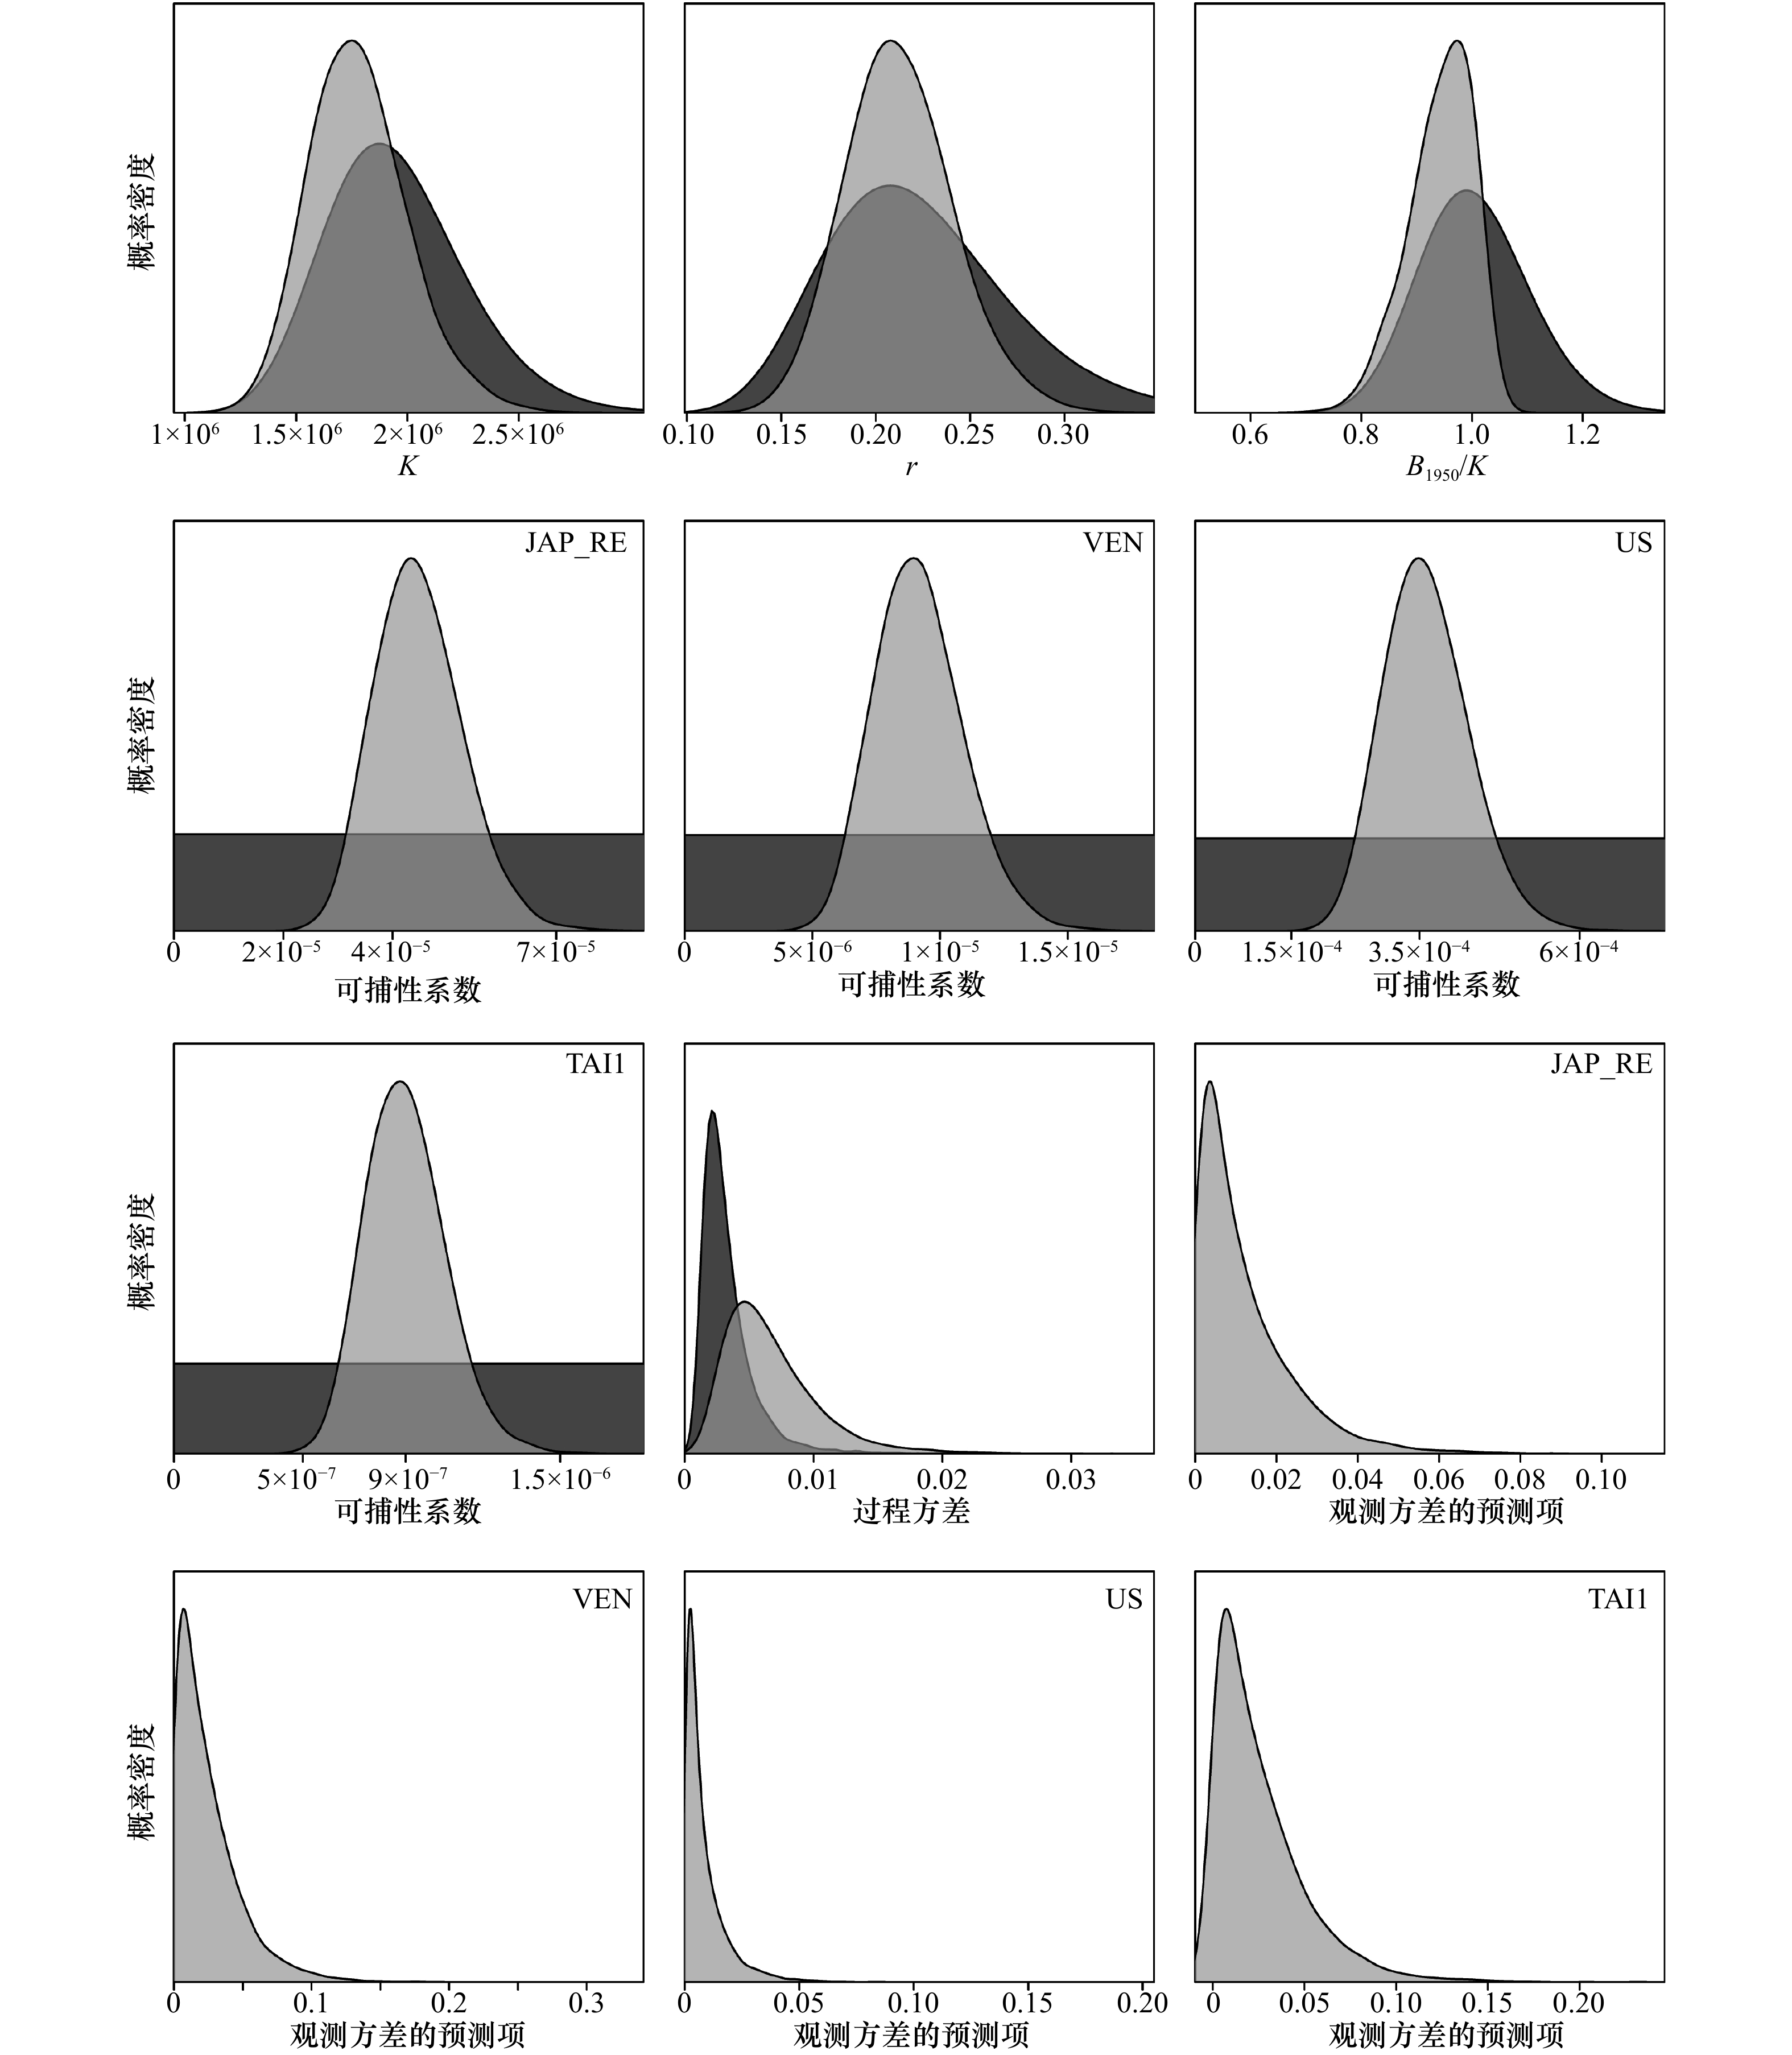
图 3 大西洋黄鳍金枪鱼JABBA基础模型参数先验分布(深色)和后验分布(浅色)
Fig. 3 Priors (dark) and posteriors (light) of parameters of base case in JABBA for Atlantic yellowfin tuna
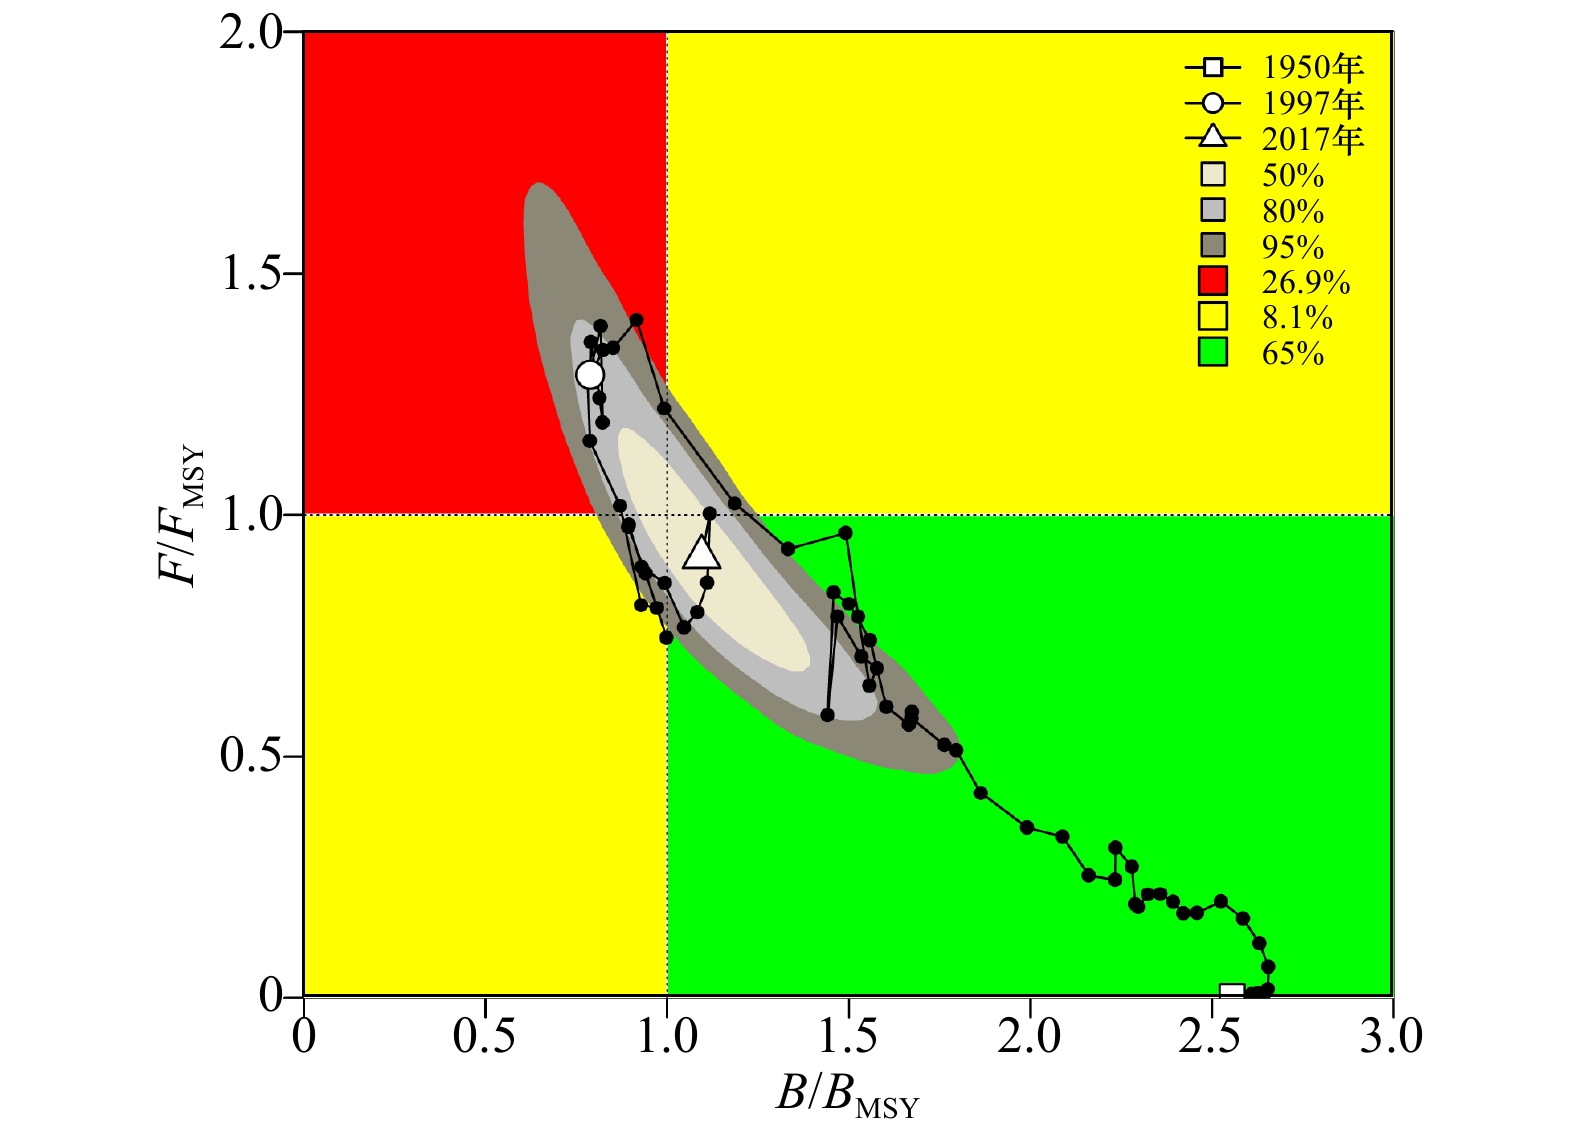
图 4 1950−2017年大西洋黄鳍金枪鱼JABBA模型基础模型资源开发状态变化图
黑色点线展示了B/BMSY和F/FMSY在1950−2017年的变化,3个深浅不同的灰色区域分别代表2017年资源状态的置信区间,2017年资源状态落在红色、黄色和绿色象限的概率分别为26.9%、8.1%和65%
Fig. 4 Kobe phase plot showing estimated trajectories (1950−2017) of B/BMSY and F/FMSY of Atlantic yellowfin tuna of base case in JABBA
The black dotted line shows the interannual variation of B/BMSY and F/FMSY between 1950 and 2017, three different shades of gray area represent the confidence intervals of the stock status in 2017. The probabilities of the stock falling in the red, yellow and green quadrants are 26.9%, 8.1% and 65%, respectively, in 2017
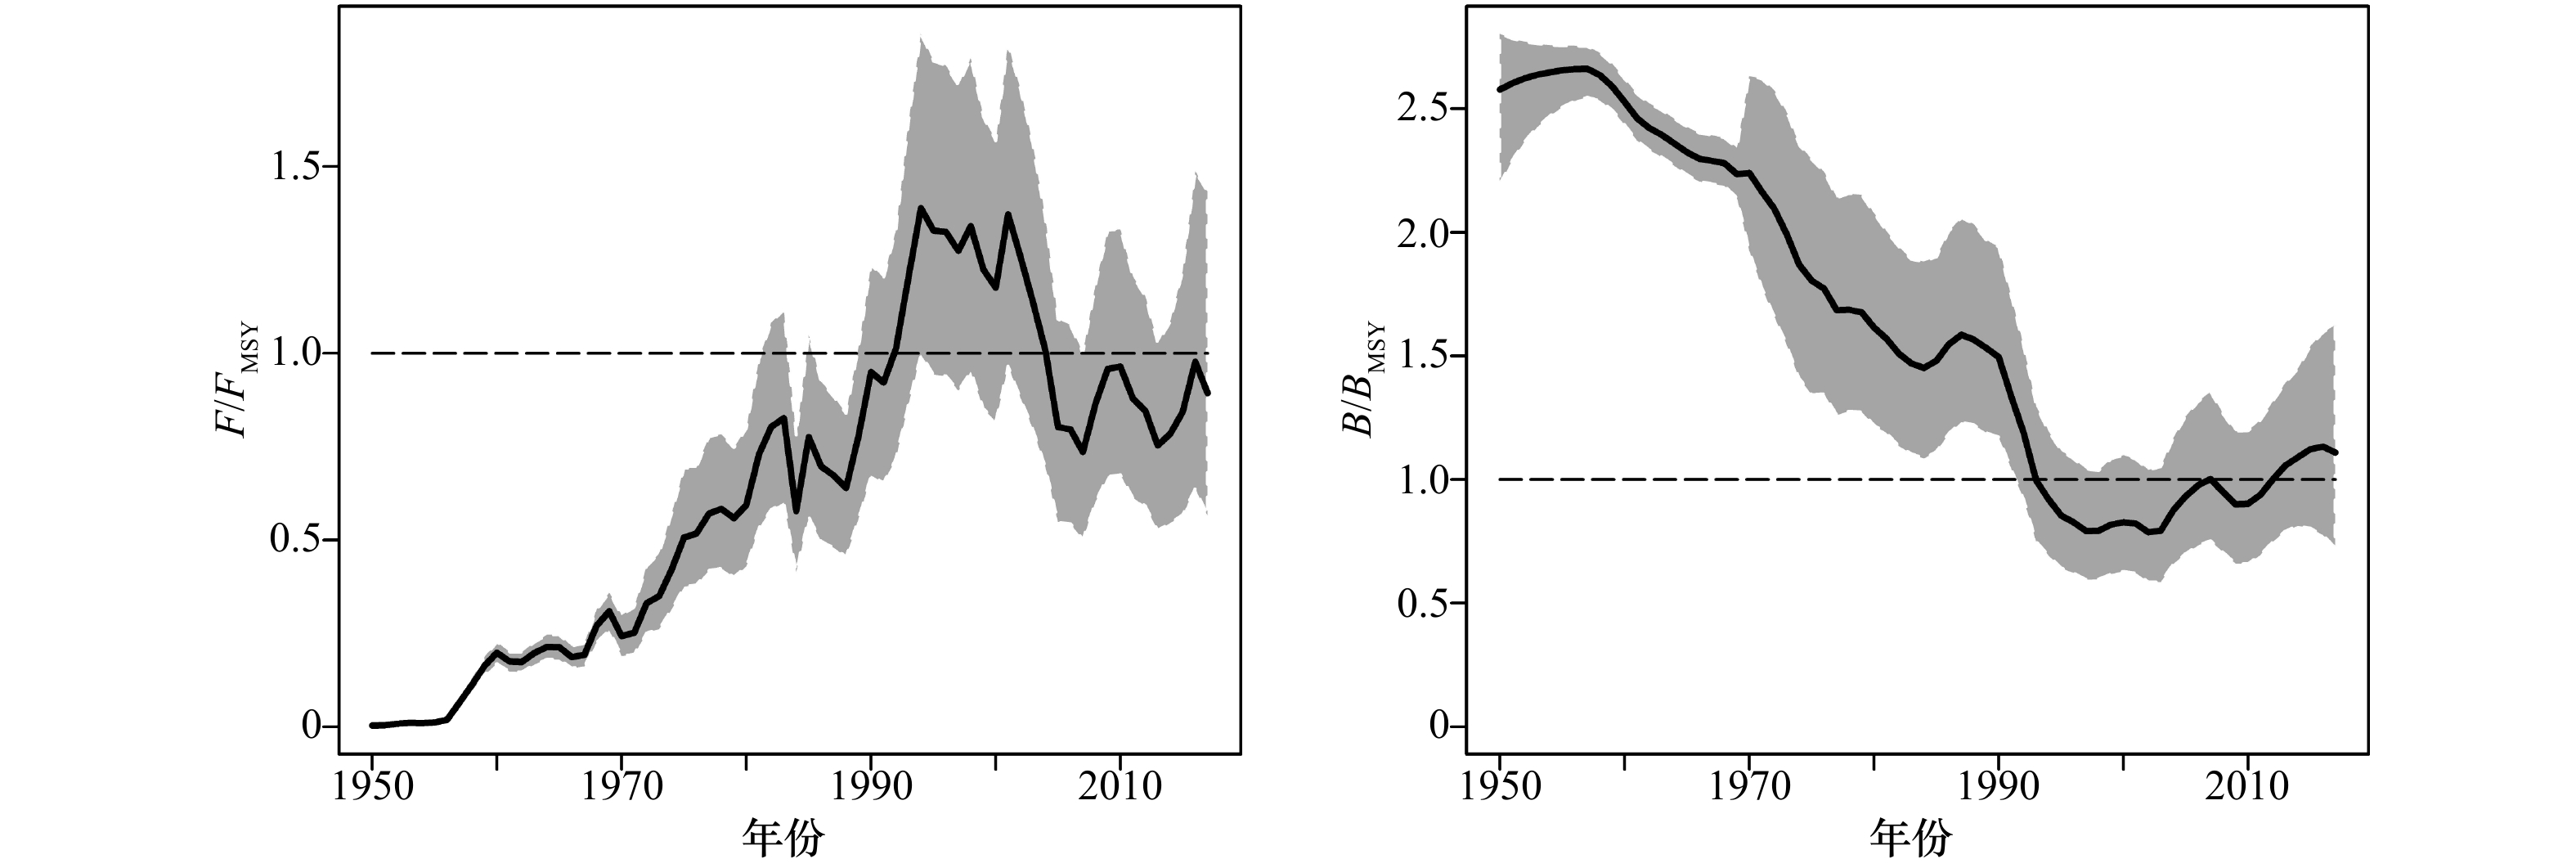
图 5 大西洋黄鳍金枪鱼JABBA基础模型1950−2017年F/FMSY和B/BMSY趋势
阴影区域为95%置信区间
Fig. 5 F/FMSY and B/BMSY of Atlantic yellowfin tuna from 1950 to 2017 of base case in JABBA
The shaded area is its 95% confidence interval

图 6 不同TAC目标下的大西洋黄鳍金枪鱼JABBA模型基础模型B/BMSY预测(2019−2027年)
Fig. 6 Future projection (2019−2027) of B/BMSY of Atlantic yellowfin tuna of base case in JABBA under different TACs

图 7 大西洋黄鳍金枪鱼JABBA基础模型B、B/BMSY、F、F/FMSY的回溯性分析
Refer和2016−2012年表示输入数据序列的末年分别为2017年和2016−2012年
Fig. 7 Retrospective analysis of B, B/BMSY, F, F/FMSY of base case in JABBA of Atlantic yellowfin tuna
Refer and 2016−2012 indicate that the last year of input data are 2017 and 2016−2012
表 1 大西洋黄鳍金枪鱼各延绳钓船队标准化CPUE数据
Tab. 1 Standardized CPUE for each longline fleet of Atlantic yellowfin tuna
船队 缩写 时间跨度 日本 JAP 1971−2014年 乌拉圭1 URU1 1982−1991年 乌拉圭2 URU2 1992−2010年 巴西 BR 1978−2012年 委内瑞拉 VEN 1991−2014年 美国 US 1987−2014年 中国台北1 TAI1 1970−1992年 中国台北2 TAI2 1993−2014年  下载: 导出CSV
表 2 大西洋黄鳍金枪鱼JABBA模型S1−S8方案设置
Tab. 2 Different scenarios (S1−S8) of Atlantic yellowfin tuna in JABBA
方案 产量函数 CPUE数据 S1 Pella-Tomlinson JAP,URU1, URU2, BR, VEN,US,TAI1,TAI2 S2 Pella-Tomlinson JAP,VEN,US,TAI1 S3 Pella-Tomlinson JAP_RE,VEN,US,TAI1 S4 Fox JAP_RE,VEN,US,TAI1 S5 Fox VEN,US,TAI1 S6 Fox JAP_RE,US,TAI1 S7 Fox JAP_RE,VEN,TAI1 S8 Fox JAP_RE,VEN,US 注:JAP_RE代表JAP去掉1976年之前的数据,即1976−2014年的数据。
下载: 导出CSV
表 3 大西洋黄鳍金枪鱼JABBA模型中K和r有信息和无信息的先验分布设定以及后验分布
Tab. 3 The informative and non-informative prior and posterior distributions for K and r in the JABBA for Atlantic yellowfin tuna
情况 先验分布 后验分布 K/104 t r K/104 t r S4(K和r均为有信息先验) U[139.2,265.8] U[0.14,0.34] 177(140,227) 0.211(0.162,0.273) K为无信息先验,r为有信息先验 U[20,3000] U[0.14,0.34] 161(114,232) 0.231(0.159,0.331) K为有信息先验,r无信息先验 U[139.2,265.8] U[0.01,2] 180(136,242) 0.207(0.144,0.285) 注:后验分布中,K和r的数值分别为其中值和95%置信区间。
下载: 导出CSV
表 4 大西洋黄鳍金枪鱼JABBA模型S1−S8方案的拟合效果
Tab. 4 Goodness of fitting of S1−S8 scenarios in JABBA for Atlantic yellowfin tuna
拟合指标 S1 S2 S3 S4 S5 S6 S7 S8 RMSE 49.8 23.7 23.1 23.0 22.9 22.2 24.8 22.4 DIC 885.7 397.2 346.1 345.3 68.4 254.5 43.2 330.5
下载: 导出CSV
表 5 大西洋黄鳍金枪鱼JABBA基础模型参数后验估计值及其95%置信区间
Tab. 5 Posterior estimates and 95% confidence intervals of parameter of base case in JABBA for Atlantic yellowfin tuna
参数 中值 2.5% 97.5% K/104 t 178 140 229 r 0.210 0.159 0.274 B1950/K 0.949 0.809 1.035 FMSY 0.210 0.159 0.274 BMSY/104 t 65.4 51.3 84.3 MSY/104 t 13.7 12.0 16.0 B2017/BMSY 1.109 0.723 1.624 F2017/FMSY 0.893 0.565 1.432
下载: 导出CSV
表 6 不同TAC目标下大西洋黄鳍金枪鱼2019−2027年B>BMSY的概率
Tab. 6 The probability that B>BMSY of Atlantic yellowfin tuna under different TAC targets in 2019−2027
TAC/104 t 2019年 2020年 2021年 2022年 2023年 2024年 2025年 2026年 2027年 8.8 0.712 0.793 0.852 0.892 0.921 0.941 0.956 0.966 0.974 9.35 0.717 0.784 0.836 0.873 0.901 0.924 0.940 0.950 0.957 9.9 0.718 0.778 0.824 0.856 0.882 0.904 0.922 0.934 0.944 10.45 0.720 0.766 0.806 0.835 0.857 0.880 0.894 0.908 0.919 11.0 0.714 0.751 0.785 0.808 0.831 0.846 0.864 0.876 0.887 12.1 0.715 0.733 0.749 0.762 0.772 0.783 0.790 0.798 0.806 13.2 0.718 0.711 0.705 0.701 0.695 0.692 0.686 0.685 0.680
下载: 导出CSV
表 7 不同TAC目标下大西洋黄鳍金枪鱼2019−2027年F>FMSY的概率
Tab. 7 The probability that F>FMSY of Atlantic yellowfin tuna under different TAC targets in 2019−2027
TAC/104 t 2019年 2020年 2021年 2022年 2023年 2024年 2025年 2026年 2027年 8.8 0.022 0.016 0.012 0.01 0.008 0.006 0.005 0.004 0.004 9.35 0.035 0.028 0.022 0.017 0.015 0.013 0.011 0.011 0.008 9.9 0.050 0.042 0.034 0.028 0.023 0.02 0.018 0.016 0.016 10.45 0.071 0.062 0.053 0.048 0.041 0.036 0.033 0.030 0.027 11.0 0.101 0.091 0.083 0.074 0.068 0.062 0.058 0.053 0.051 12.1 0.166 0.163 0.159 0.151 0.150 0.144 0.145 0.140 0.139 13.2 0.258 0.266 0.276 0.279 0.286 0.289 0.294 0.298 0.303
下载: 导出CSV
表 8 不同TAC目标下大西洋黄鳍金枪鱼2019−2027年处于健康状态的概率
Tab. 8 The probability that the Atlantic yellowfin tuna is in healthy status under different TAC targets in 2019−2027
TAC/104 t 2019年 2020年 2021年 2022年 2023年 2024年 2025年 2026年 2027年 8.8 0.712 0.793 0.852 0.892 0.921 0.941 0.956 0.966 0.974 9.35 0.717 0.784 0.836 0.873 0.901 0.924 0.940 0.950 0.957 9.9 0.718 0.778 0.824 0.856 0.882 0.904 0.922 0.934 0.944 10.45 0.720 0.766 0.806 0.835 0.857 0.880 0.894 0.908 0.919 11.0 0.714 0.751 0.785 0.808 0.831 0.846 0.863 0.876 0.887 12.1 0.715 0.732 0.747 0.761 0.772 0.782 0.789 0.797 0.805 13.2 0.700 0.693 0.687 0.684 0.678 0.677 0.672 0.671 0.668
下载: 导出CSV
表 9 不同渔获量误报比例下大西洋黄鳍金枪鱼JABBA基础模型评估资源状态
Tab. 9 Stock status of Atlantic yellowfin tuna in different mis-reported rates of catches of base case in JABBA
报告渔获量占实际渔获量的比例/% B2017/104 t B2017/BMSY F2017 F2017/FMSY 资源健康/% 70 77.7 1.227 0.175 0.854 70.1 80 73.9 1.165 0.185 0.896 65.6 90 70.9 1.119 0.191 0.914 63.1 100 72.5 1.109 0.187 0.893 65.0 110 72.7 1.081 0.186 0.886 64.3 120 77.4 1.094 0.175 0.845 67.1 130 80.4 1.078 0.169 0.824 64.5 注:资源健康(%)指2017年资源未遭受资源型过度捕捞和捕捞型过度捕捞的概率。
下载: 导出CSV
-
[1] Matsumoto T, Satoh K. Stock assessment for Atlantic yellowfin tuna using a non-equilibrium production model[J]. ICCAT’s Collective Volume of Scientific Papers, 2017, 73(2): 451−474. [2] Satoh K, Yokoi H, Nishida T, et al. Stock assessment for Atlantic yellowfin tuna using age structured production model[J]. ICCAT’s Collective Volume of Scientific Papers, 2017, 73(2): 577−631. [3] Tropical Species Group. Alternative virtual population analyses of yellowfin tuna (Thunnus albacares), 1970−2010[J]. ICCAT’s Collective Volume of Scientific Papers, 2012, 68(3): 1044−1059. [4] Walter J, Sharma R. Atlantic ocean yellowfin tuna stock assessment 1950−2014 using stock synthesis[J]. ICCAT's Collective Volume of Scientific Papers, 2017, 73(2): 510−576. [5] 官文江, 田思泉, 朱江峰, 等. 渔业资源评估模型的研究现状与展望[J]. 中国水产科学, 2013, 20(5): 1112−1120. doi: 10.3724/SP.J.1118.2013.01112Guan Wenjiang, Tian Siquan, Zhu Jiangfeng, et al. A review of fisheries stock assessment models[J]. Journal of Fishery Sciences of China, 2013, 20(5): 1112−1120. doi: 10.3724/SP.J.1118.2013.01112 [6] Winker H, Carvalho F, Kapur M. JABBA: Just another bayesian biomass assessment[J]. Fisheries Research, 2018, 204: 275−288. doi: 10.1016/j.fishres.2018.03.010 [7] Mcallister M, Pikitch E K, Babcock E A. Using demographic methods to construct Bayesian priors for the intrinsic rate of increase in the Schaefer model and implications for stock rebuilding[J]. Canadian Journal of Fisheries and Aquatic Sciences, 2001, 58(9): 1871−1890. doi: 10.1139/f01-114 [8] Punt A E, Hilborn R. Fisheries stock assessment and decision analysis: The Bayesian approach[J]. Reviews in Fish Biology and Fisheries, 1997, 7(1): 35−63. doi: 10.1023/A:1018419207494 [9] Meyer R, Millar R B. BUGS in Bayesian stock assessments[J]. Canadian Journal of Fisheries and Aquatic Sciences, 1999, 56(6): 1078−1087. doi: 10.1139/f99-043 [10] Buckland S T, Newman K B, Thomas L, et al. State-space models for the dynamics of wild animal populations[J]. Ecological Modelling, 2004, 171(1/2): 157−175. [11] De Bruyn P, Murua H, Aranda M. The Precautionary approach to fisheries management: How this is taken into account by tuna regional fisheries management organisations (RFMOs)[J]. Marine Policy, 2013, 38: 397−406. doi: 10.1016/j.marpol.2012.06.019 [12] International Commission for the Conservation of Atlantic Tunas(ICCAT). Report of the 2016 ICCAT yellowfin tuna stock assessment meeting[R]. San Sebastian, Spain: ICCAT, 2016. [13] Satoh K, Matsumoto T. Japanese longline CPUE for yellowfin tuna (Thunnus albacares) in the Atlantic Ocean standardized using GLM up to 2014[J]. ICCAT’s Collective Volume of Scientific Papers, 2017, 73(1): 270−289. [14] Huang J H W. Standardized catch rate index for yellowfin tuna (Thunnus albacares) from the Taiwanese longline fishery in the Atlantic Ocean, 1970−2014[J]. ICCAT’s Collective Volume of Scientific Papers, 2017, 73(1): 404−422. [15] Satoh K, Matsumoto T. Exploration of historical changes of target species for Japanese longline in the Atlantic Ocean and application to standardization of CPUE of yellowfin[J]. ICCAT’s Collective Volume of Scientific Papers, 2017, 73(1): 290−317. [16] Walter J. Standardized catch rate in number and weight of yellowfin tuna (Thunnus albacares) from the United States pelagic longline fishery 1987−2015[J]. ICCAT’s Collective Volume of Scientific Papers, 2017, 73(1): 323−368. [17] Indian Ocean Tuan Commission (IOTC). Report of the fifth session of the IOTC working party on temperate tunas. (IOTC-2014-WPTmT05-R[E])[R]. Busan: 5th Working Party on Temperate Tunas, Indian Ocean Tuna Commission, 2014. [18] Chen Jiahua, Chen Zehua. Extended Bayesian information criteria for model selection with large model spaces[J]. Biometrika, 2008, 95(3): 759−771. doi: 10.1093/biomet/asn034 [19] Mohn R. The retrospective problem in sequential population analysis: An investigation using cod fishery and simulated data[J]. ICES Journal of Marine Science, 1999, 56(4): 473−488. doi: 10.1006/jmsc.1999.0481 [20] 官文江, 高峰, 雷林, 等. 渔业资源评估中的回顾性问题[J]. 上海海洋大学学报, 2012, 21(5): 841−847.Guan Wenjiang, Gao Feng, Lei Lin, et al. Retrospective problem in fishery stock assessment[J]. Journal of Shanghai Ocean University, 2012, 21(5): 841−847. [21] 吕翔. 大西洋金枪鱼资源开发与保护现状分析[D]. 上海: 上海海洋大学, 2016Lü Xiang. Analysis of status with utilization and conservation of the tuna resources in the Atlantic Ocean[D]. Shanghai: Shanghai Ocean University, 2016. [22] International Commission for the Conservation of Atlantic Tunas (ICCAT). Report of the working group to evaluate Atlantic yellowfin tuna[J]. ICCAT’s Collective Volume of Scientific Papers, 1994, 42(2): 1−116. [23] International Commission for the Conservation of Atlantic Tunas (ICCAT). Report of the 2017 ICCAT Atlantic swordfish stock assessment session[J]. ICCAT’s Collective Volume of Scientific Papers, 2017, 74: 841−967. [24] Winker H, Kerwath S, Merino G, et al. Bayesian state-space surplus production model JABBA assessment of Atlantic bigeye tuna (Thunnus obesus) stock[J]. ICCAT's Collective Volume of Scientific Papers, 2019, 75(7): 2129−2168. [25] Mourato B L, Winker H, Carvalho F, et al. Stock assessment of Atlantic blue marlin (Makaira nigricans) using a Bayesian state-space surplus production model JABBA[J]. ICCAT’s Collective Volume of Scientific Papers, 2018, 75(5): 1003−1025. [26] International Commission for the Conservation of Atlantic Tunas (ICCAT). Report of the Standing Committee on Research and Statistics (SCRS)[R]. Madrid, Spain: International Commission for the Conservation of Atlantic Tunas, 2018. [27] Dortel E, Sardenne F, Bousquet N, et al. An integrated Bayesian modeling approach for the growth of Indian Ocean yellowfin tuna[J]. Fisheries Research, 2014, 163: 69−84. [28] Eveson J P, Million J, Sardenne F, et al. Estimating growth of tropical tunas in the Indian Ocean using tag-recapture data and otolith-based age estimates[J]. Fisheries Research, 2015, 163: 58−68. doi: 10.1016/j.fishres.2014.05.016 [29] Zagaglia C R, Lorenzzetti J A, Stech J L. Remote sensing data and longline catches of yellowfin tuna (Thunnus albacares) in the equatorial Atlantic[J]. Remote Sensing of Environment, 2004, 93(1/2): 267−281. [30] 官文江, 吴佳文. 剩余产量模型形状参数对印度洋黄鳍金枪鱼资源评估的影响[J]. 上海海洋大学学报, 2019, 28(2): 298−304.Guan Wenjiang, Wu Jiawen. Impacts of shape parameter of surplus production model on stock assessment of Indian Ocean yellowfin tuna[J]. Journal of Shanghai Ocean University, 2019, 28(2): 298−304. [31] Punt A E, Hilborn R. BAYES-SA-Bayesian stock assessment methods in fisheries. User’s manual[M]. Rome: FAO, 2001. [32] Chen Y, Breen P A, Andrew N L. Impacts of outliers and mis-specification of priors on Bayesian fisheries-stock assessment[J]. Canadian Journal of Fisheries and Aquatic Sciences, 2000, 57(11): 2293−2305. doi: 10.1139/f00-208 [33] 李纲, 陈新军, 官文江. 基于贝叶斯方法的东、黄海鲐资源评估及管理策略风险分析[J]. 水产学报, 2010, 34(5): 740−750. doi: 10.3724/SP.J.1231.2010.05941Li Gang, Chen Xinjun, Guan Wenjiang. Stock assessment and risk analysis of management strategies for Scomber japonicus in the East China Sea and Yellow Sea using a Bayesian approach[J]. Journal of Fisheries of China, 2010, 34(5): 740−750. doi: 10.3724/SP.J.1231.2010.05941 [34] Mcallister M K, Kirkwood G P. Bayesian stock assessment: a review and example application using the logistic model[J]. ICES Journal of Marine Science, 1998, 55(6): 1031−1060. doi: 10.1006/jmsc.1998.0425 [35] Myers R A, Hutchings J A, Barrowman N J. Why do fish stocks collapse? The example of cod in Atlantic Canada[J]. Ecological Applications, 1997, 7(1): 91−106. doi: 10.1890/1051-0761(1997)007[0091:WDFSCT]2.0.CO;2 [36] 张魁, 陈作志. 应用贝叶斯状态空间建模对东海带鱼的资源评估[J]. 中国水产科学, 2015, 22(5): 1015−1026.Zhang Kui, Chen Zuozhi. Using Bayesian state-space modelling to assess Trichiurus japonicus stock in the East China Sea[J]. Journal of Fishery Sciences of China, 2015, 22(5): 1015−1026. [37] 张魁, 刘群, 廖宝超, 等. 渔业数据失真对两种非平衡剩余产量模型评估结果的影响比较[J]. 水产学报, 2018, 42(9): 1378−1389.Zhang Kui, Liu Qun, Liao Baochao, et al. Comparative effects of distorted fishery data on assessment results of two non-equilibrium surplusproduction models[J]. Journal of Fisheries of China, 2018, 42(9): 1378−1389. -

计量
- 文章访问数: 966
- HTML全文浏览量: 371
- PDF下载量: 63
- 被引次数: 0
