

Environmental capacity change and loss assessment of Qinzhou Bay in Guangxi induced by large-scale reclamation and land-based sewage discharge
-
摘要: 在2004–2019年间,人类通过大规模围填海以及陆源排污等活动对钦州湾造成了不可逆转的深远影响。本文基于卫星遥感影像和海图资料,利用非结构网格有限体积海洋模型建立的高精度钦州湾水动力–水质模型,分析了十几年来人类活动的累积效应对钦州湾水质的影响。受围填海和陆源排污两者的影响,钦州湾内化学需氧量(COD)的浓度略有下降(0.976 mg/L下降到0.909 mg/L),但湾内无机氮(DIN)和无机磷(DIP)的浓度分别从0.146 mg/L和0.023 mg/L增加到0.230 mg/L和0.027 mg/L,无机氮的浓度增加较为显著;统计结果表明,湾内超四类水质海域面积和重度富营养化水域面积大幅度增加,水质环境状况不容乐观。此外根据钦州湾内排污的特点,利用分担率法计算了不同时期下钦州湾的环境容量,结果表明湾内排污量远超最大允许排污量,茅岭江、钦江两条河流的排污量亟需削减;由于围填海导致的海湾面积减小和水交换能力降低,钦州湾环境容量较2008年有明显下降。对茅尾海局部采用排海通量最优法的计算表明,茅岭江应当分担比钦江更多的排污量,才能有利于茅尾海内的水质改善。通过估算发现双重人为压力共同对钦州湾造成了约每年26.95亿元的环境容量价值损失,因此在开发利用海洋前应慎重考虑环境容量损失的补偿方案。Abstract: From 2004 to 2019, human activities have caused a profound and irreversible impact on Qinzhou Bay (QZB) through large-scale land reclamation and land-based sewage discharge. In this study, based on the satellite images and marine charts, a hydro-biogeochemical model was established to analyze the cumulative effect of human activities on water quality in Qinzhou Bay during the past decades. Under the double anthropogenic pressures, the concentration of chemical oxygen demand (COD) in QZB has slightly decreased from 0.976 mg/L to 0.909 mg/L. But the concentration of inorganic nitrogen (DIN) and inorganic phosphorus (DIP) increased obviously from 0.146 mg/L and 0.023 mg/L to 0.230 mg/L and 0.027 mg/L, respectively. The statistical results show that the area of heavily polluted and severe eutrophication water has increased dramatically, indicating the water quality in QZB being degenerated. According to the characteristics of pollution discharge in the bay, the share rate method was used to calculate the environment capacity in different scenarios. The results show that the actual emissions far exceed the maximum allowed amount in the bay, particularly in Maoling River and Qinjiang River, where the emissions of pollutants need to be reduced urgently. Because of the decrease of the water area and water exchange capacity caused by land reclamation, the environment capacity has reduced compare to the historical situation. The calculation of sewage discharge optimization method for Maowei Sea indicates that Maoling River should share more sewage discharge than Qinjiang River, which is conducive to the improvement of water quality in Maowei Sea. It is estimated that the environmental capacity value loss of Qinzhou Bay caused by two anthropogenic pressures is approximate 2.695 billion per year, so compensation should be considered before exploitation and utilization of the coastal ocean.
-
Key words:
- human activities /
- water quality /
- pollutant transport /
- environment capacity /
- ocean model
-
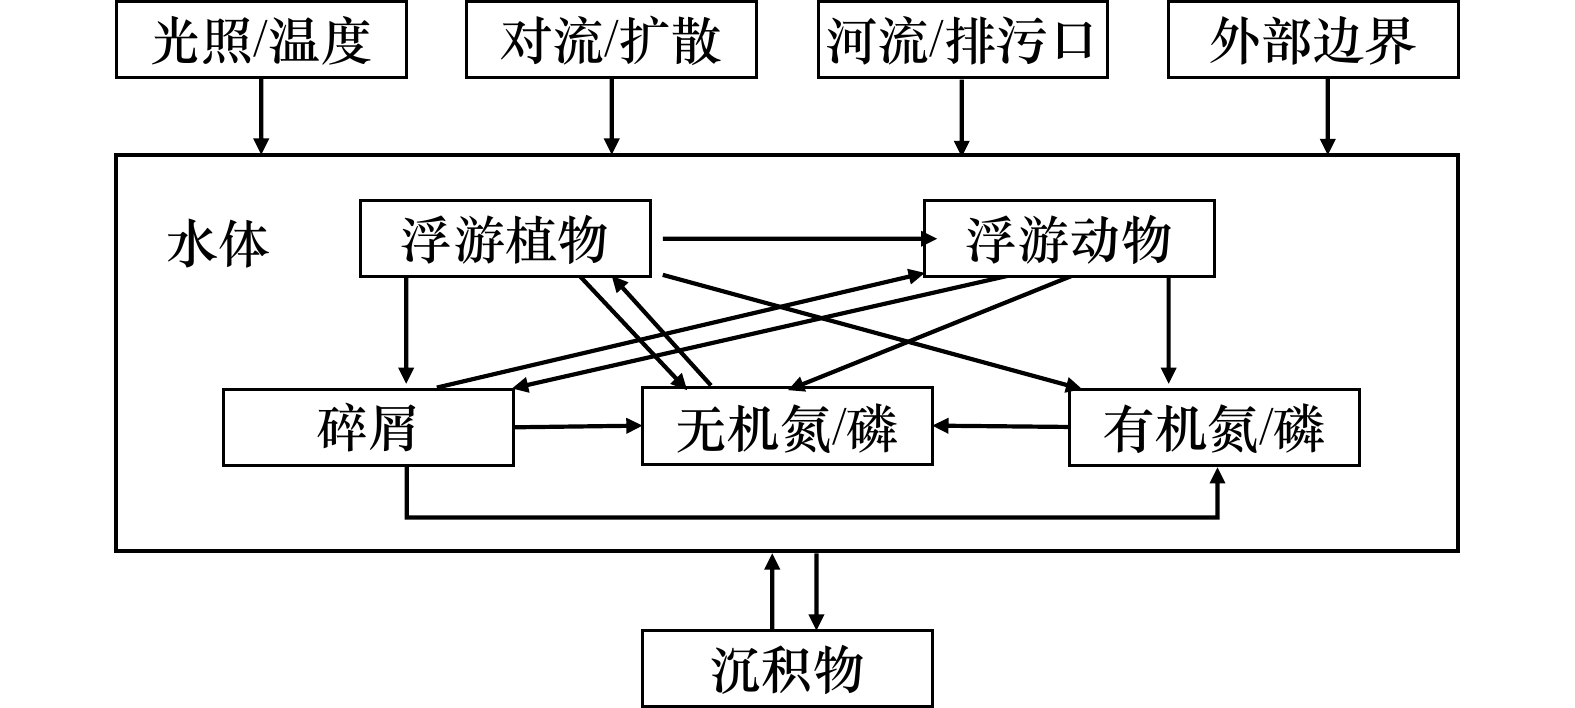
图 2 营养盐–浮游植物–浮游动物–碎屑(NPZD)模式的框架结构
Fig. 2 The framework of the Nutrient-Phytoplankton-Zooplankton-Detritus (NPZD) model
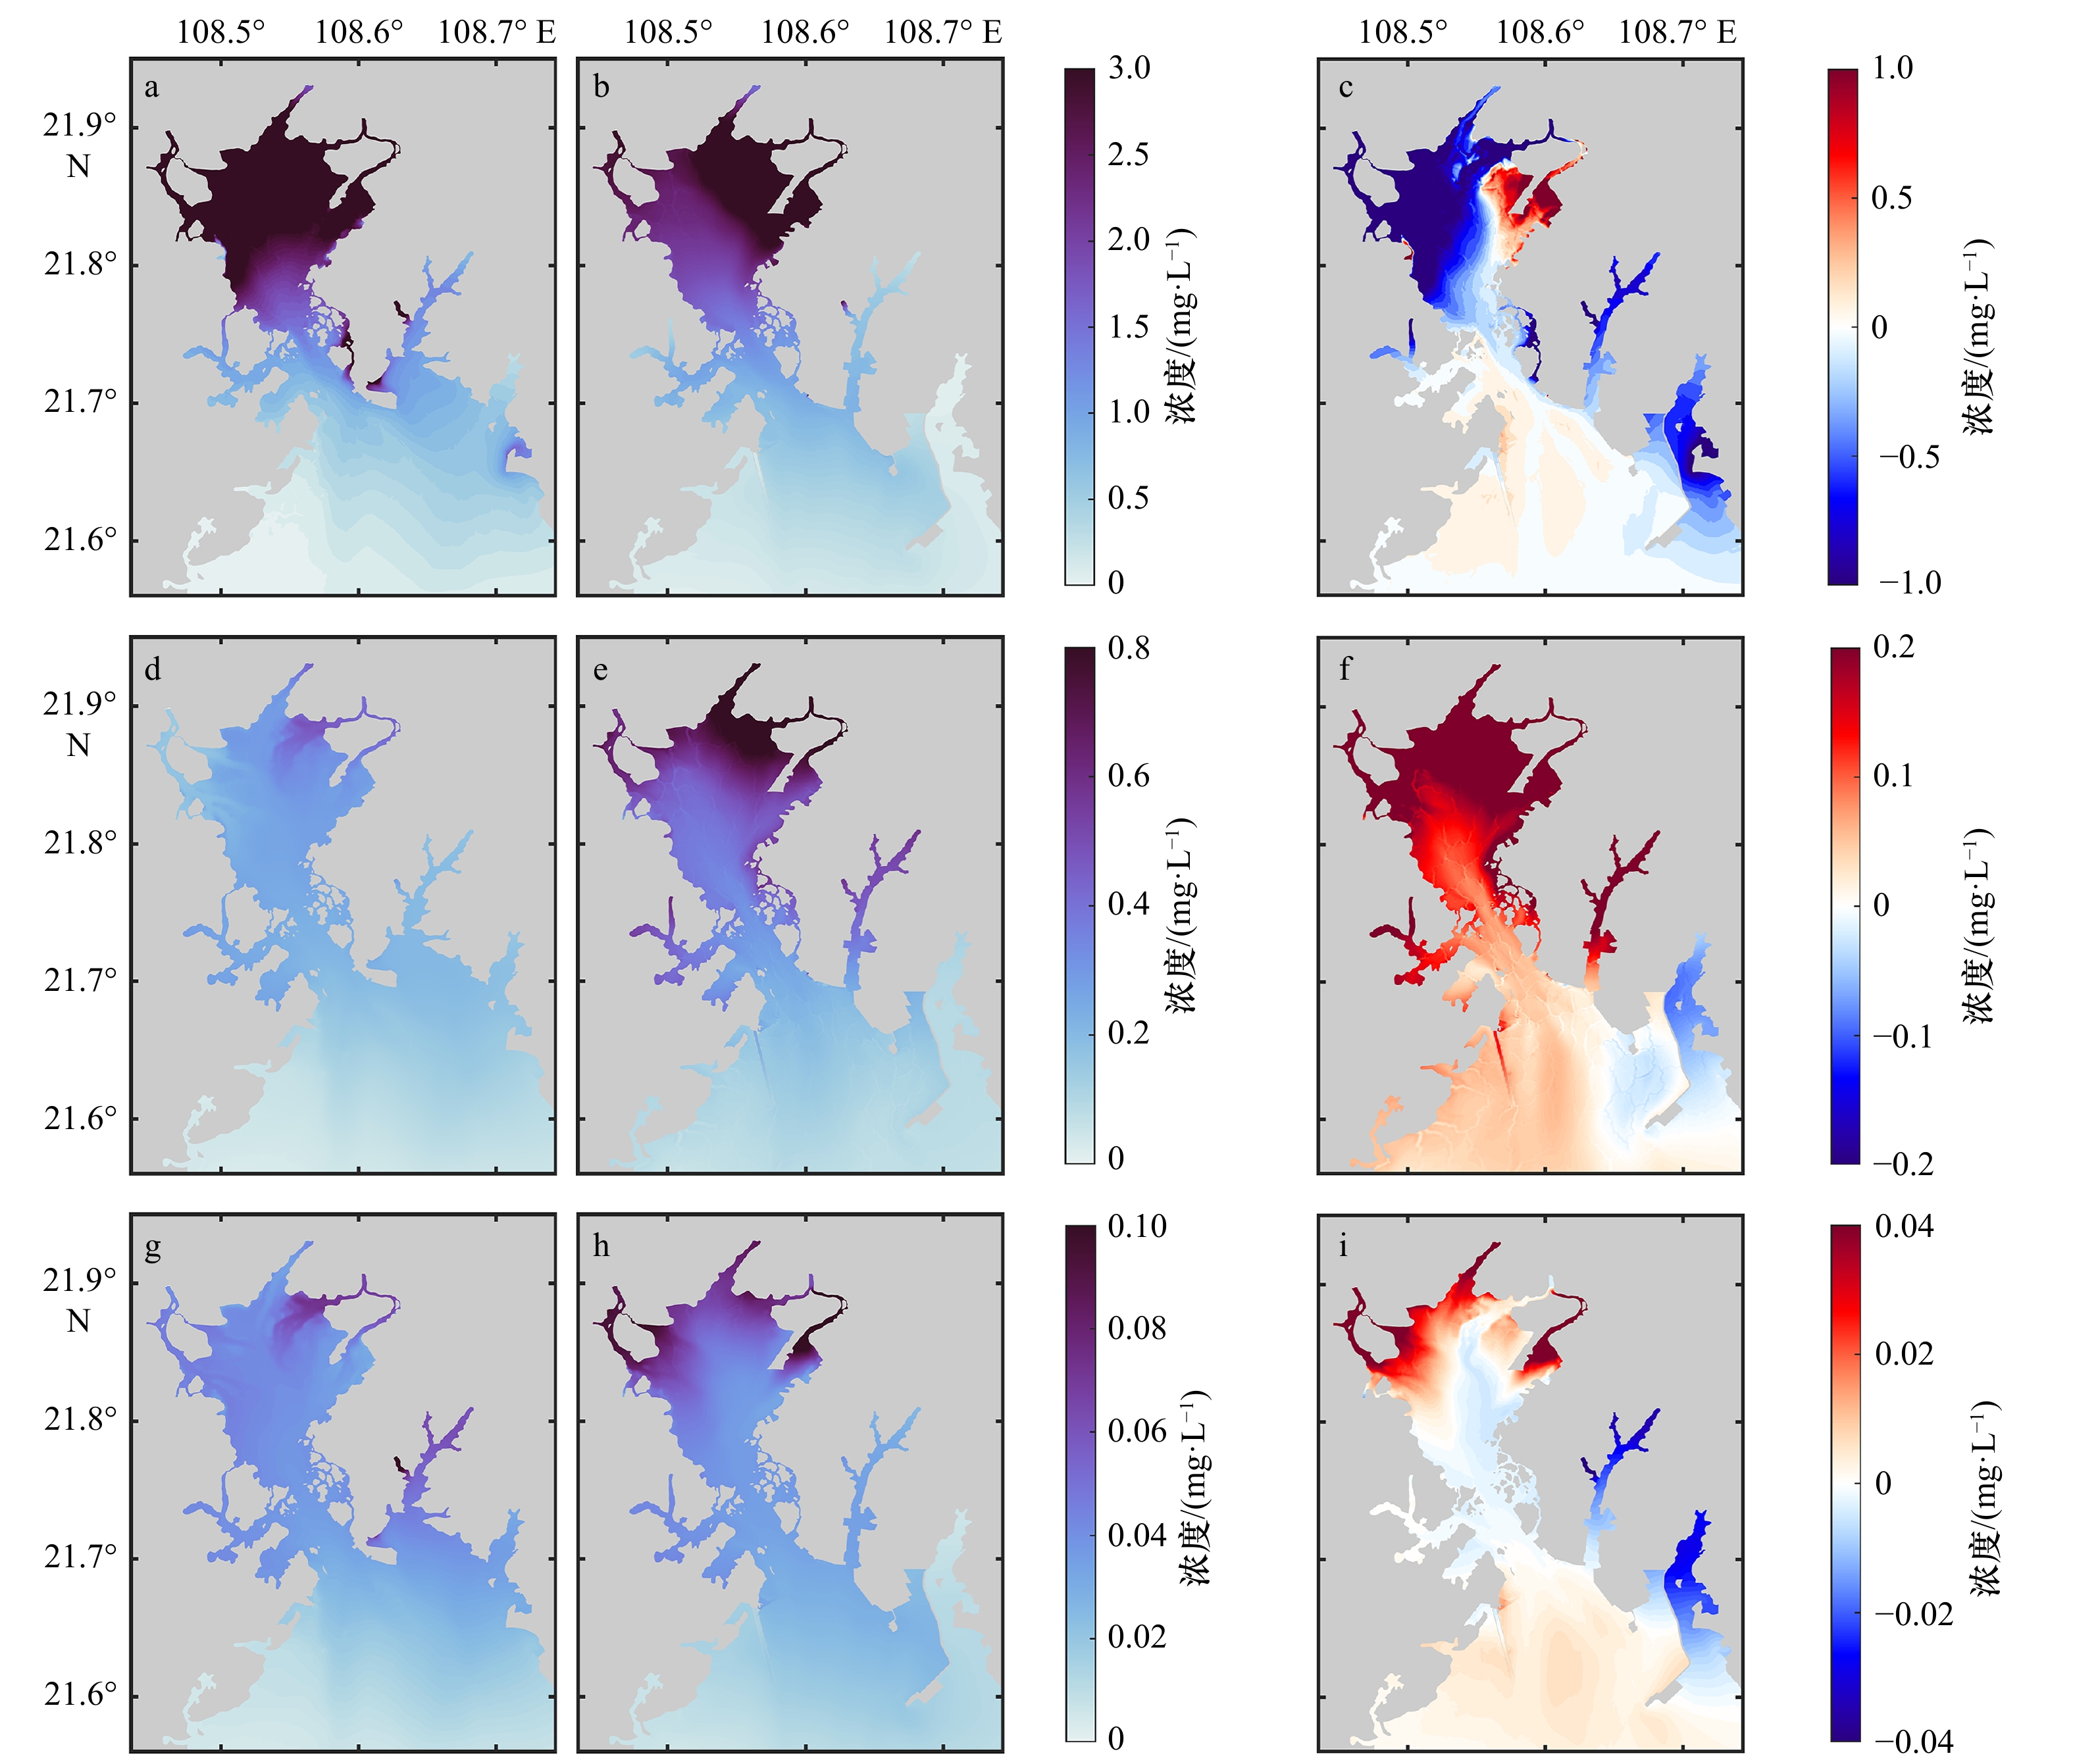
图 3 各类污染物浓度分布及差异
a−c: 化学需氧量;d−f: 溶解无机氮;g−i: 溶解无机磷;左:2008年;中:2018年;右:2018年减2008年之差
Fig. 3 Concentration distribution of three pollutants and their difference
a−c: Chemical oxygen demand; d−f: dissolved inorganic nitrogen; g−i: dissolved inorganic phosphorus; left column for the year of 2008, middle column represents for the year of 2018, right column represents the difference of 2018 minus 2008
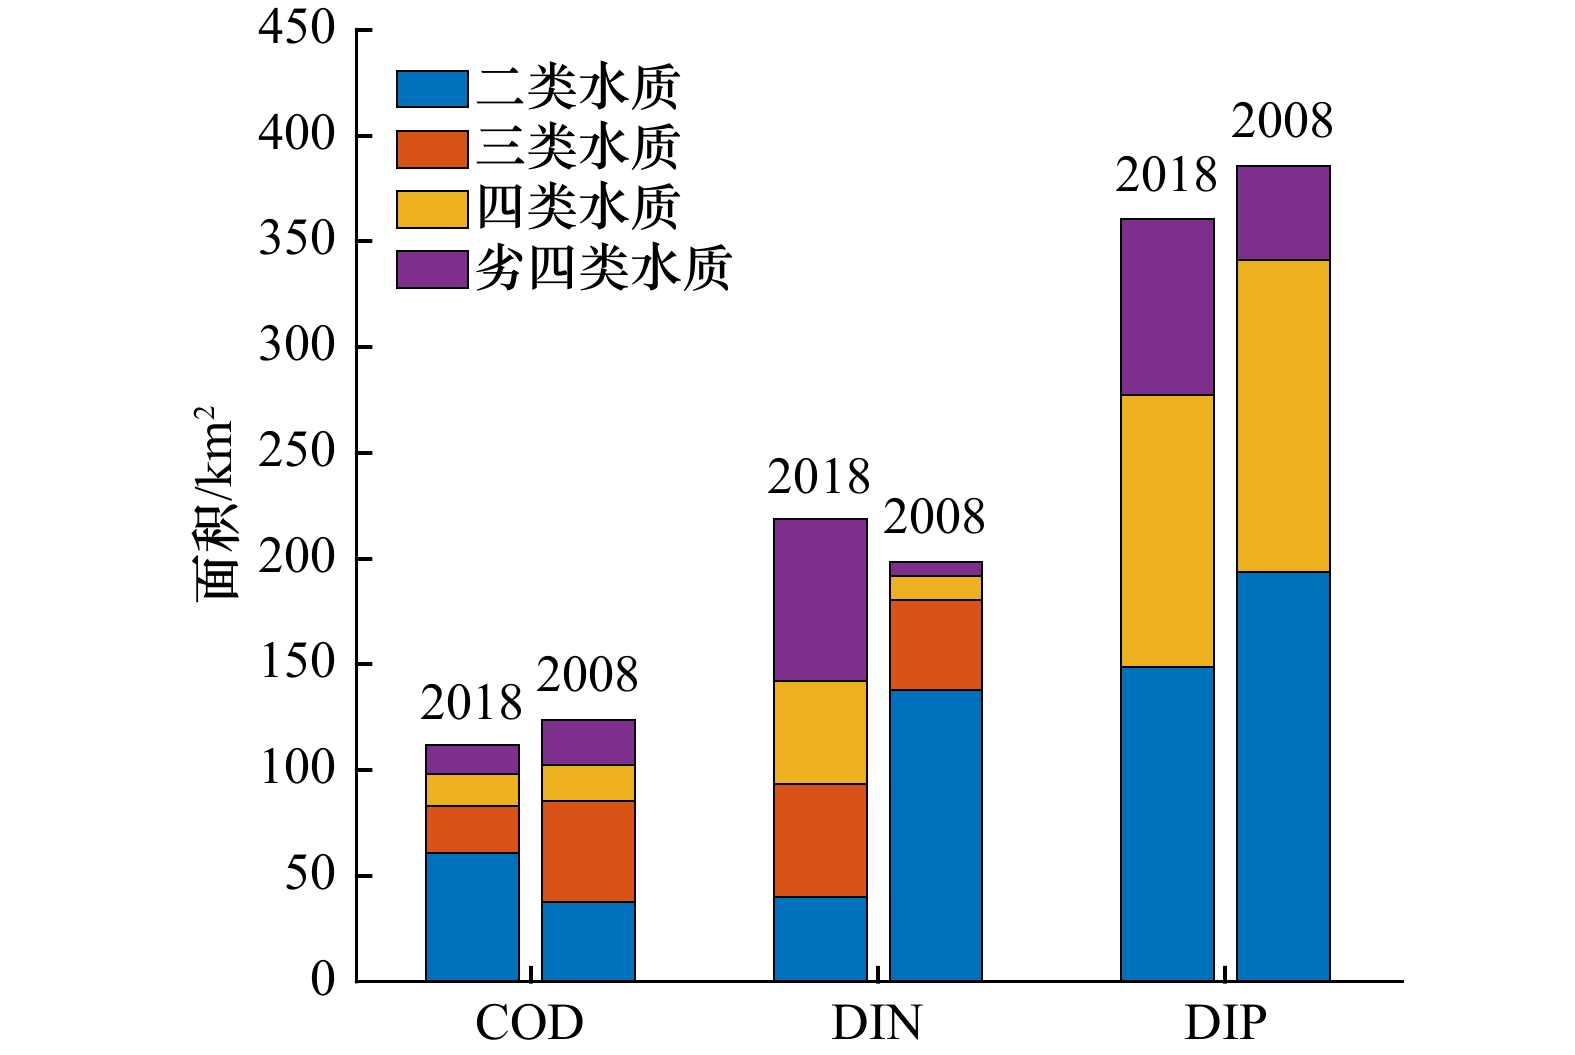
图 4 钦州湾不同类别水质面积统计图
Fig. 4 Statistical results of different water quality standard areas in Qinzhou Bay

图 5 湾内水体富营养化程度分布
蓝线代表不同类别富营养化程度的分界线
Fig. 5 The eutrophication degree distribution of water body in the Qinzhou Bay
The blue line showing the boundary of different eutrophication degree
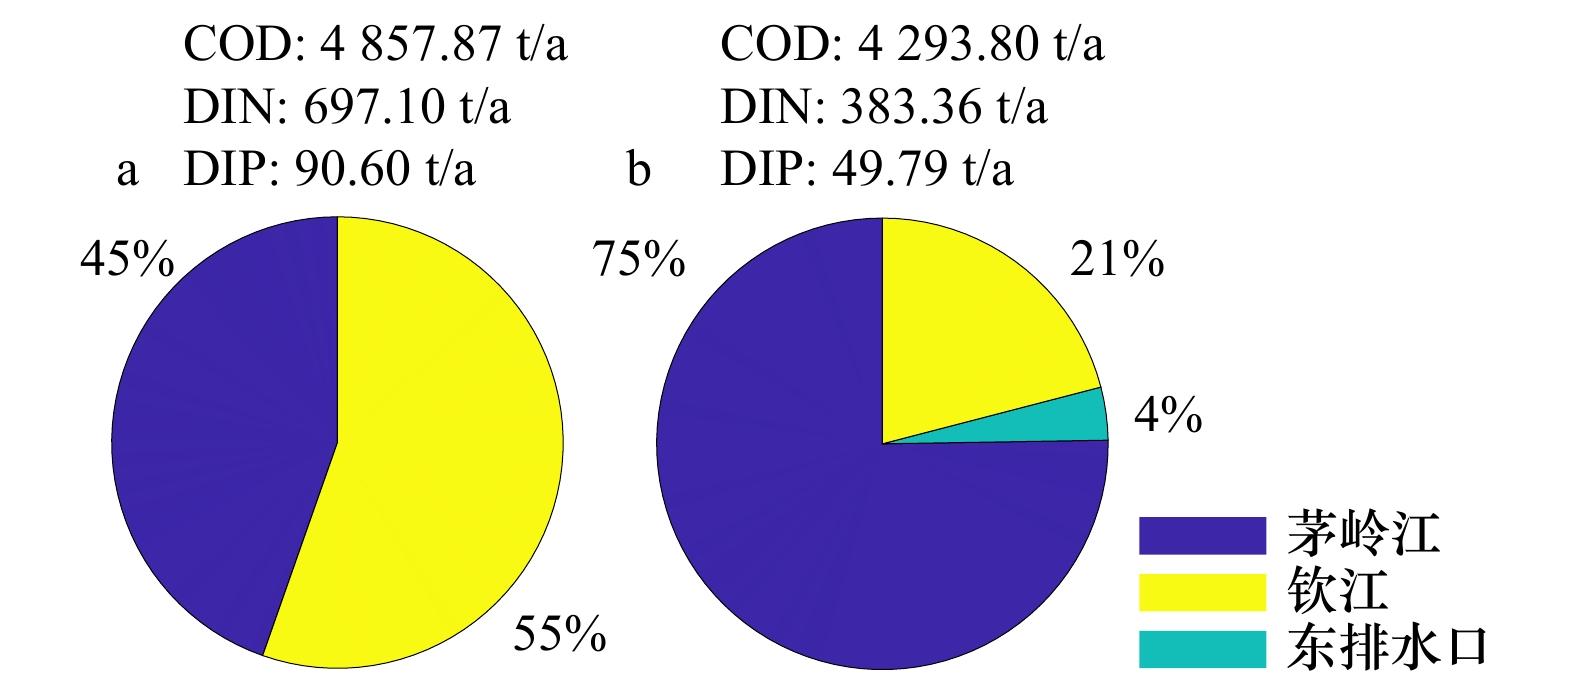
图 6 2008年(a)和2018年(b)茅尾海内排海通量最优法允许排放量和排污布局计算结果
Fig. 6 Results of the allowed emissions and sewage layout through optimal drainage flux in the Maowei Sea in 2008 (a) and 2018 (b)
表 1 2008年钦州湾各河流/排污口污染物通量
Tab. 1 Pollutant discharge of rivers and sewage outlets in the Qinzhou Bay in 2008
序号 排污口名称 COD/
(t∙a−1)DIN/
(t∙a−1)DIP/
(t∙a−1)1 钦州港勒沟桥排污口 3 191.09 0.74 0.23 2 钦州港果鹰大道临时污水排放口 1 143.42 20.20 9.62 3 钦州港起步工业园东排水 546.88 7.34 7.51 4 钦州港起步工业园西排水 555.36 4.21 4.10 5 钦州燃煤电厂排水口 420.15 2.30 3.21 6 钦州市犀牛脚镇排污口 1 287.04 1.89 0.99 7 茅岭江 16 615.09 962.26 188.75 8 钦江 13 527.56 2 111.93 229.39 总计 37 286.59 3 111.11 444.03  下载: 导出CSV
表 2 2018年钦州湾各河流/排污口污染物通量
Tab. 2 Pollutant discharge of rivers and sewage outlets in the Qinzhou Bay in 2018
序号 排污口名称 COD/
(t∙a−1)DIN/
(t∙a−1)DIP/
(t∙a−1)1 钦州市犀牛角镇排污口 8.19 1.04 0.90 2 钦州港金桂纸业排污口 121.84 21.96 0.49 3 钦州市钦州港果鹰大道排污口 5.41 0.24 0.38 4 钦州国星油气有限公司旁排污口 311.60 32.07 2.11 5 钦州市东排水口(茶山江) 4 405.80 532.02 179.50 6 钦州港旧国土局办公楼旁排污口 2.86 0.24 0.06 7 钦州港东排水口 67.66 1.56 0.33 8 钦州七十二泾旅游码头排污口 24.14 5.11 0.43 9 钦州港勒沟作业区排污口 1.60 0.59 0.01 10 茅岭江 7 919.30 2 194.20 217.40 11 钦江 8 937.70 1 589.30 117.17 总计 21 806.10 4 378.33 518.78
下载: 导出CSV
表 3 钦州湾水质模型所采用的主要参数
Tab. 3 Main parameters of the Qinzhou Bay water-quality model
参数 取值 浮游植物生长速率/d−1 1.5 浮游植物死亡率/d−1 0.05 浮游动物代谢速率/d−1 0.12 浮游动物死亡率/d−1 0.025 浮游动物摄食浮游植物速率/d−1 0.5 Redfield比值 16 浮游动物代谢产物无机营养盐的比重 0.75 浮游植物吸收DIN的半饱和系数/(mmol·m−3) 10 浮游植物吸收DIP的半饱和系数/(mmol·m−3) 0.16 生物碎屑沉降速率/(m·d−1) 0.3 COD自身降解系数 0.03
下载: 导出CSV
表 4 2018年和2008年条件下钦州湾水体中污染物平均浓度和超标海域面积
Tab. 4 Average concentration of pollutants and exceeding standard water quality area in Qinzhou Bay between 2008 and 2018
类别 COD DIN DIP 2018 2008 2018 2008 2018 2008 平均浓度/(mg∙L−1) 0.909 0.976 0.230 0.146 0.027 0.023 超一类水质面积/km2 112.10 123.61 218.65 198.66 360.79 385.70 超二类水质面积/km2 51.04 85.68 178.47 60.60 212.18 191.92 超三类水质面积/km2 28.76 37.93 125.28 18.11 212.18 191.92 超四类水质面积/km2 13.78 21.06 76.20 6.78 83.51 44.68
下载: 导出CSV
表 5 2018年和2008年条件下钦州湾各类富营养化水体面积
Tab. 5 Areas of different eutrophication water body in the Qinzhou Bay of 2008 and 2018
年份 轻度/km2 中度/km2 重度/km2 2018 54.63 (25.85%) 56.06 (26.46%) 100.67 (47.69%) 2008 52.98 (29.30%) 59.15 (32.72%) 68.63 (37.98%) 注:括号中为占比。
下载: 导出CSV
表 6 2018年钦州湾环境容量分配结果
Tab. 6 Results of environment capacity distribution in the Qinzhou Bay in the year of 2018
序号 排污口名称 COD现状排
放量/(t∙a−1)COD允许排放
量/(t∙a−1)削减量/
(t∙a−1)DIN现状排放
量/(t∙a−1)DIN允许排放
量/(t∙a−1)削减量/
(t∙a−1)DIP现状排放
量/(t∙a−1)DIP允许排放
量/(t∙a−1)削减量/(t∙a−1) 1 钦州市犀牛角镇排污口 8.19 35.12 — 1.04 2.13 — 0.90 1.57 — 2 钦州港金桂纸业排污口 121.84 166.34 — 21.96 14.67 7.29 0.49 0.21 0.28 3 钦州市钦州港果鹰大道排污口 5.41 6.10 — 0.24 0.13 0.11 0.38 0.14 0.24 4 钦州国星油气有限公司旁排污口 311.60 336.67 — 32.07 17.23 14.84 2.11 0.73 1.38 5 钦州市东排水口(茶山江) 4 405.80 626.14 3 779.66 532.02 42.88 489.14 179.50 11.57 167.93 6 钦州港旧国土局办公楼旁排污口 2.86 1.90 0.96 0.24 0.08 0.16 0.06 0.02 0.04 7 钦州港东排水口 67.66 57.83 9.83 1.56 0.66 0.9 0.33 0.12 0.21 8 钦州七十二泾旅游码头排污口 24.14 24.04 0.10 5.11 2.53 2.58 0.43 0.14 0.29 9 钦州港勒沟作业区排污口 1.60 1.51 0.09 0.59 0.27 0.32 0.01 0.01 — 10 茅岭江 7 919.30 1 596.86 6 322.44 2 194.20 235.37 1 958.83 217.40 13.34 204.06 11 钦江 8 937.70 1 270.25 7 667.45 1 589.30 128.11 1 461.19 117.17 7.56 109.61 合计 21 806.10 4 122.76 17 683.34 4 378.33 444.06 3 934.27 518.78 35.41 483.37 注:“—”代表不需要削减
下载: 导出CSV
表 7 2008年钦州湾环境容量分配结果
Tab. 7 Results of environment capacity distribution in the Qinzhou Bay in the year of 2008
序号 排污口名称 COD现状排放量/(t∙a−1) COD允许排
放量/(t∙a−1)削减量/
(t∙a−1)DIN现状排放
量/(t∙a−1)DIN允许排放
量/(t∙a−1)削减量/
(t∙a−1)DIP现状排放
量/(t∙a−1)DIP允许排放
量/(t∙a−1)削减量/
(t∙a−1)1 钦州港勒沟桥排污口 3 191.09 535.63 2 655.46 0.74 0.44 0.3 0.23 0.17 0.06 2 钦州港果鹰大道临时污水排放口 1 143.42 613.91 529.51 20.20 16.33 3.87 9.62 5.38 4.24 3 钦州港起步工业园东排水 546.88 402.66 144.22 7.34 5.74 1.6 7.51 4.02 3.49 4 钦州港起步工业园西排水 555.36 393.50 161.86 4.21 3.65 0.56 4.10 1.15 2.95 5 钦州燃煤电厂排水口 420.15 332.75 87.40 2.30 1.78 0.52 3.21 0.65 2.56 6 钦州市犀牛脚镇排污口 1 287.04 319.88 967.16 1.89 2.71 — 0.99 0.59 0.40 7 茅岭江 16 615.09 2 371.82 14 243.27 962.26 182.25 780.01 188.75 26.16 162.59 8 钦江 13 527.56 1 936.27 11 591.29 2 111.93 385.21 1 726.72 229.39 44.70 184.69 合计 37 286.59 6 906.42 30 380.17 3 111.11 598.11 2 513.00 444.03 82.82 361.21 注:“—”代表不需要削减
下载: 导出CSV
表 8 双重人为压力造成的海湾水环境容量的价值损失
Tab. 8 Environmental capacity value loss of the bay under two anthropogenic pressures
污染物 处理费用Ci/
(万元∙t−1)平均浓度
变化 ΔNi/
(mg∙L−1)损失的
纳潮量 ΔV/
(108 m3)Di/
(万元∙a−1)D/
(万元∙a−1)COD 0.87 –0.67 0.95 –20 212.0 269 532.2 DIN 6.47 0.84 188 451.7 DIP 73.03 0.04 101 292.6
下载: 导出CSV
-
[1] Wang Wei, Liu Hui, Li Yongqi, et al. Development and management of land reclamation in China[J]. Ocean & Coastal Management, 2014, 102: 415−425. [2] Jiang Shuai, Xu Nan, Li Zhichao, et al. Satellite derived coastal reclamation expansion in China since the 21st century[J]. Global Ecology and Conservation, 2021, 30: e01797. doi: 10.1016/j.gecco.2021.e01797 [3] 林磊, 刘东艳, 刘哲, 等. 围填海对海洋水动力与生态环境的影响[J]. 海洋学报, 2016, 38(8): 1−11.Lin Lei, Liu Dongyan, Liu Zhe, et al. Impact of land reclamation on marine hydrodynamic and ecological environment[J]. Haiyang Xuebao, 2016, 38(8): 1−11. [4] Gao Guandong, Wang Xiaohua, Bao Xianwen, et al. Land reclamation and its impact on tidal dynamics in Jiaozhou Bay, Qingdao, China[J]. Estuarine, Coastal and Shelf Science, 2014, 151: 285−294. doi: 10.1016/j.ecss.2014.07.017 [5] Li Li, Guan Weibing, Hu Jianyu, et al. Responses of water environment to tidal flat reduction in Xiangshan Bay: part I hydrodynamics[J]. Estuarine, Coastal and Shelf Science, 2018, 206: 14−26. doi: 10.1016/j.ecss.2017.11.003 [6] Shi Jinghao, Li Guangxue, Wang Ping, et al. Anthropogenic influences on the tidal prism and water exchanges in Jiaozhou Bay, Qingdao, China[J]. Journal of Coastal Research, 2011, 27(1): 57−72. [7] Li Keqiang, Zhang Li, Li Yan, et al. A three-dimensional water quality model to evaluate the environmental capacity of nitrogen and phosphorus in Jiaozhou Bay, China[J]. Marine Pollution Bulletin, 2015, 91(1): 306−316. doi: 10.1016/j.marpolbul.2014.11.020 [8] Yan Huakun, Wang Nuo, Yu Tiaolan, et al. Comparing effects of land reclamation techniques on water pollution and fishery loss for a large-scale offshore airport island in Jinzhou Bay, Bohai Sea, China[J]. Marine Pollution Bulletin, 2013, 71(1/2): 29−40. [9] 曹宇峰, 林春梅, 余麒祥, 等. 简谈围填海工程对海洋生态环境的影响[J]. 海洋开发与管理, 2015, 32(6): 85−88.Cao Yufeng, Lin Chunmei, Yu Qixiang, et al. Briefly discuss the impact of reclamation project on marine ecological environment[J]. Ocean Development and Management, 2015, 32(6): 85−88. [10] 董德信, 李谊纯, 陈宪云, 等. 海洋工程对钦州湾岸线地形及泥沙冲淤的影响[J]. 广西科学, 2015, 22(3): 266−273. doi: 10.3969/j.issn.1005-9164.2015.03.006Dong Dexin, Li Yichun, Chen Xianyun, et al. Impacts of ocean engineering on shoreline, topography and deposition-erosion environment in Qinzhou Gulf[J]. Guangxi Sciences, 2015, 22(3): 266−273. doi: 10.3969/j.issn.1005-9164.2015.03.006 [11] 李逸聪, 王义刚, 黄惠明. 湾口围填海对钦州湾水动力环境的影响[J]. 水运工程, 2017(3): 44−50. doi: 10.3969/j.issn.1002-4972.2017.03.009Li Yicong, Wang Yigang, Huang Huiming. Impacts of bay mouth reclamation on hydrodynamic environment of Qinzhou Bay[J]. Port & Waterway Engineering, 2017(3): 44−50. doi: 10.3969/j.issn.1002-4972.2017.03.009 [12] 杨留柱, 杨莉玲, 潘洪州, 等. 人类活动影响下的钦州湾近期滩槽冲淤演变特征[J]. 热带海洋学报, 2019, 38(6): 41−50.Yang Liuzhu, Yang Liling, Pan Hongzhou, et al. Characteristics of recent evolution in Qinzhou Bay influenced by human activities[J]. Journal of Tropical Oceanography, 2019, 38(6): 41−50. [13] 牙韩争, 董德信, 朱冬琳, 等. 岸线变化对钦州湾污染物输移扩散的影响[J]. 广西科学, 2018, 25(1): 51−56.Ya Hanzheng, Dong Dexin, Zhu Donglin, et al. Impact of shoreline changes on the pollutant transport and dispersion in Qinzhou Bay[J]. Guangxi Sciences, 2018, 25(1): 51−56. [14] 劳齐斌, 刘国强, 高劲松, 等. 钦州湾养殖区营养盐分布特征及富营养化状况研究[J]. 海洋环境科学, 2021, 40(3): 407−416. doi: 10.12111/j.mes.20200066Lao Qibin, Liu Guoqiang, Gao Jinsong, et al. Study on the characteristics and eutrophication of nutrients in the mariculture farms of Qinzhou bay, South China[J]. Marine Environmental Science, 2021, 40(3): 407−416. doi: 10.12111/j.mes.20200066 [15] 徐敏, 韩保新, 龙颖贤. 钦州湾海域氮磷营养盐近30年变化规律及其来源分析[J]. 环境工程技术学报, 2012, 2(3): 253−258. doi: 10.3969/j.issn.1674-991X.2012.03.039Xu Min, Han Baoxin, Long Yingxian. Analysis of the variation trend and sources of nitrogen and phosphorus in Qinzhou Bay in the last 30 years[J]. Journal of Environmental Engineering Technology, 2012, 2(3): 253−258. doi: 10.3969/j.issn.1674-991X.2012.03.039 [16] 何帅. 茅尾海水质数值模拟及环境容量研究[D]. 青岛: 中国海洋大学, 2015.He Shuai. Numerical study on water quality and environmental capacity of Maowei Sea[D]. Qingdao: Ocean University of China, 2015. [17] 张栋. 钦州湾营养盐时空变化的影响因素与陆源TDN的量化减排研究[D]. 南宁: 广西大学, 2020.Zhang Dong. The influence factors for spatio-temporal changes of nutrients and the quantitative reduction of terrestrial TDN in Qinzhou Bay[D]. Nanjing: Guangxi University, 2020. [18] Lu Dongliang, Huang Xueren, Yang Bin, et al. Composition and distributions of nitrogen and phosphorus and assessment of eutrophication status in the Maowei Sea[J]. Journal of Ocean University of China, 2021, 20(2): 361−371. doi: 10.1007/s11802-021-4557-y [19] 吕赫, 张少峰, 宋德海, 等. 围填海累积效应对钦州湾水动力环境的影响[J]. 海洋与湖沼, 2021, 52(4): 823−833. doi: 10.11693/hyhz20201200342Lü He, Zhang Shaofeng, Song Dehai, et al. The Cummulative effect of land reclamation on hydrodynamics in Qinzhou Bay[J]. Oceanologia et Limnologia Sinica, 2021, 52(4): 823−833. doi: 10.11693/hyhz20201200342 [20] Lyu H, Song Dehai, Zhang Shaofeng, et al. Compound effect of land reclamation and land-based pollutant input on water quality in Qinzhou Bay, China[J]. Science of the Total Environment, 2022, 826: 154183 [21] Chen Changsheng, Liu Hedong, Beardsley R C. An unstructured grid, finite-volume, three-dimensional, primitive equations ocean model: application to coastal ocean and estuaries[J]. Journal of Atmospheric and Oceanic Technology, 2003, 20(1): 159−186. doi: 10.1175/1520-0426(2003)020<0159:AUGFVT>2.0.CO;2 [22] 李克强, 王修林, 石晓勇, 等. 胶州湾围隔浮游生态系统氮、磷营养盐迁移–转化模型研究[J]. 海洋学报, 2007, 29(3): 76−83.Li Keqiang, Wang Xiulin, Shi Xiaoyong, et al. Modeling nitrogen and phosphorus transport and transformation in pelagic ecosystem in mesocosm in Jiaozhou Bay[J]. Haiyang Xuebao, 2007, 29(3): 76−83. [23] Wang Yan, Song Dehai, Li Keqiang, et al. Calculation of city total maximum allocated load of total nitrogen for jurisdictions in Qingdao, China: a water quality-based modeling approach[J]. Science of the Total Environment, 2019, 652: 455−470. doi: 10.1016/j.scitotenv.2018.10.113 [24] 李克强, 王修林, 韩秀荣, 等. 莱州湾围隔浮游生态系统氮、磷营养盐迁移–转化模型研究[J]. 中国海洋大学学报(自然科学版), 2007, 37(6): 987−994.Li Keqiang, Wang Xiulin, Han Xiurong, et al. Modeling nitrogen and phosphorus transformation in pelagic ecosystem in mesocsom in Laizhou Bay[J]. Periodical of Ocean University of China, 2007, 37(6): 987−994. [25] Chen Ya’nan, Song Dehai, Li Keqiang, et al. Hydro-biogeochemical modeling of the early-stage outbreak of green tide (Ulva prolifera) driven by land-based nutrient loads in the Jiangsu coast[J]. Marine Pollution Bulletin, 2020, 153: 111028. doi: 10.1016/j.marpolbul.2020.111028 [26] 王晓玮, 赵骞, 赵仕兰. 海洋环境容量及入海污染物总量控制研究进展[J]. 海洋环境科学, 2012, 31(5): 765−769.Wang Xiaowei, Zhao Qian, Zhao Shilan. Research progress on marine environmental capacity and total amount control of marine pollutant[J]. Marine Environmental Science, 2012, 31(5): 765−769. [27] 余静, 孙英兰, 张越美, 等. 宁波—舟山海域入海污染物环境容量研究[J]. 环境污染与防治, 2006, 28(1): 21−24. doi: 10.3969/j.issn.1001-3865.2006.01.007Yu Jing, Sun Yinglan, Zhang Yuemei, et al. Environmental capacity assessment of pollutants in Ningbo-Zhoushan sea area[J]. Environmental Pollution & Control, 2006, 28(1): 21−24. doi: 10.3969/j.issn.1001-3865.2006.01.007 [28] 张学庆, 孙英兰. 胶州湾入海污染物总量控制研究[J]. 海洋环境科学, 2007, 26(4): 347−350, 359. doi: 10.3969/j.issn.1007-6336.2007.04.012Zhang Xueqing, Sun Yinglan. Study on the environmental capacity in Jiaozhou Bay[J]. Marine Environmental Science, 2007, 26(4): 347−350, 359. doi: 10.3969/j.issn.1007-6336.2007.04.012 [29] 王金南. 环境经济学: 理论、方法、政策[M]. 北京: 清华大学出版社, 1994.Wang Jinnan. Environmental Economics[M]. Beijing: Tsinghua University Press, 1994. [30] 王萱, 陈伟琪, 江毓武, 等. 基于数值模拟的海湾环境容量价值损失的预测评估——以厦门同安湾围填海为例[J]. 中国环境科学, 2010, 30(3): 420−425.Wang Xuan, Chen Weiqi, Jiang Yuwu, et al. Evaluation of losses in bay environmental capacity based on numerical simulation—a case study of sea reclamation in Tong’an Bay, Xiamen[J]. China Environmental Science, 2010, 30(3): 420−425. [31] 康建华, 林毅力, 王雨, 等. 钦州湾海洋环境的富营养化水平评价及其对浮游植物叶绿素a的影响[J]. 海洋开发与管理, 2020, 37(11): 67−74. doi: 10.3969/j.issn.1005-9857.2020.11.012Kang Jianhua, Lin Yili, Wang Yu, et al. Assessment of the eutrophication level of the marine environment and its effect on phytoplankton chlorophyll a in Qinzhou Bay[J]. Ocean Development and Management, 2020, 37(11): 67−74. doi: 10.3969/j.issn.1005-9857.2020.11.012 [32] 钦州市生态环境局. 2018年钦州市环境统计公报[EB/OL]. (2019−11−29)[2022−05−05]. http://sthjj.qinzhou.gov.cn/hjbh/trwrgkhxf/201912/t20191204_3024656.html.Ecological Environment Bureau of Qinzhou Municipality. 2018 Qinzhou city environmental statistics bulletin[EB/OL]. (2019−11−29)[2022−05−05]. http://sthjj.qinzhou.gov.cn/hjbh/trwrgkhxf/201912/t20191204_3024656.html. [33] 钦州市人民政府. 钦州市人民政府办公室关于印发钦州市水污染防治行动计划工作方案的通知[EB/OL]. (2016−01−29)[2022−05−05]. http://www.qinzhou.gov.cn/zcwj_246/zfgb/2016zfgb/2016_1/201601/t20160129_42497.html.Qinzhou Municipal People's Government. Notice of Qinzhou municipal people's government office on printing and distributing the work plan of Qinzhou municipal water pollution prevention and control action plan[EB/OL]. (2016−01−29)[2022−05−05]. http://www.qinzhou.gov.cn/zcwj_246/zfgb/2016zfgb/2016_1/201601/t20160129_42497.html. [34] 钦州市人民政府. 钦州市物价局关于在钦州港区原水供水中征收污水处理费有关问题的批复[EB/OL]. (2017−06−15)[2022−05−05]. http://zwgk.qinzhou.gov.cn/auto2521/bmwj_2875/201706/t20170616_171054.html.Qinzhou Municipal People's Government. Reply of Qinzhou Price Bureau on the collection of sewage treatment fees in Qinzhou Port raw water supply[EB/OL]. (2017−06−15)[2022−05−05]. http://zwgk.qinzhou.gov.cn/auto2521/bmwj_2875/201706/t20170616_171054.html. -

 点击查看大图

计量
- 文章访问数: 325
- HTML全文浏览量: 179
- PDF下载量: 54
- 被引次数: 0
